Boric Acid Price Update: Sustained Growth Across Key Markets in Q1 2026
14-Aug-2025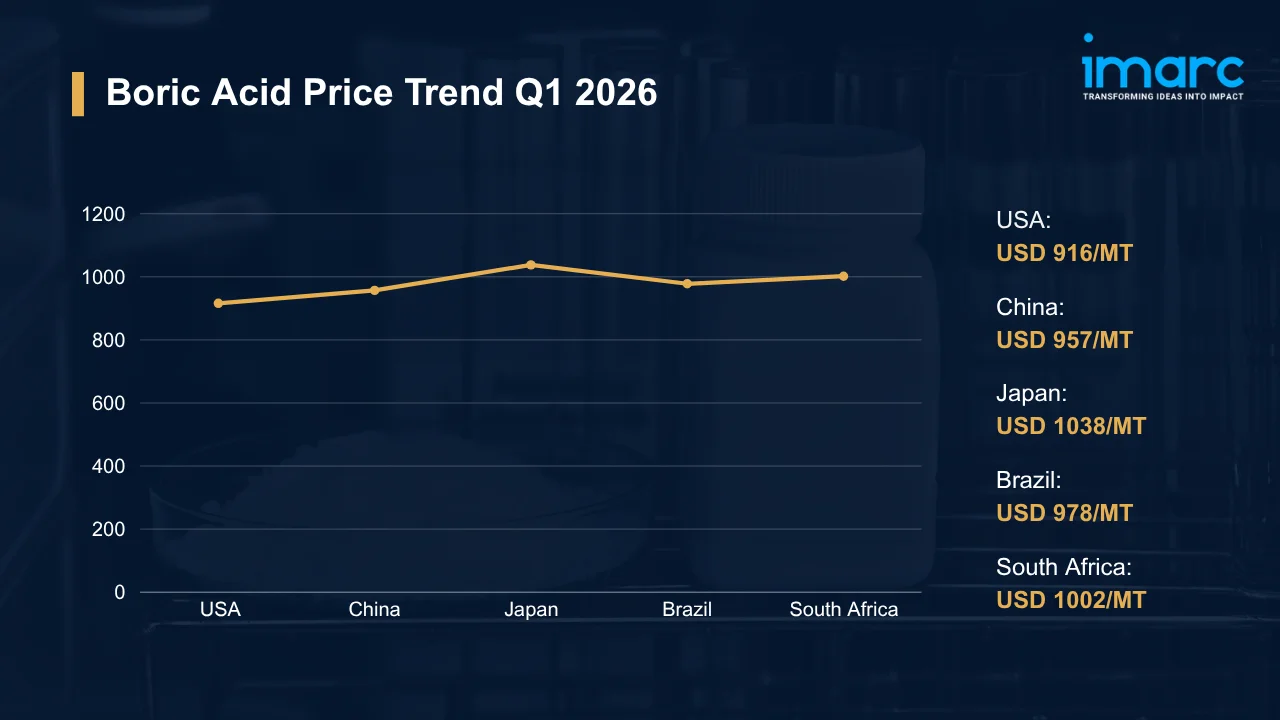
Boric acid is a white crystalline inorganic compound characterized by weak acidity and high water solubility. Derived from boron minerals such as colemanite and kernite, it functions as a critical precursor across glass and fiberglass production, ceramics, agriculture, flame retardants, electronics, and pharmaceuticals. Upstream boron ore extraction costs, refining energy inputs, ocean freight rates, and demand cycles in glass manufacturing and farm micronutrient programs together govern boric acid prices across global markets.
Global Market Overview:
Globally, the boric acid industry reached a volume of 1,046.82 Thousand Tons in 2025. Market projections indicate steady growth, with the industry expected to reach a volume of 1,569.50 Thousand Tons by 2034, with a compound annual growth rate (CAGR) of 4.60% during 2026-2034. Across end-use sectors, glass and fiberglass manufacturers, fertilizer producers, and electronics fabricators drive volume off-take in nearly equal measure. Broadening deployment in renewable energy substrates and flame-retardant composites further reinforces the upward boric acid price trend, as supply concentration in a handful of producing nations keeps procurement risk elevated for import-reliant buyers.
Boric Acid Price Trend Q1 2026:
Regional prices (USD per MT) and QoQ changes Q1 2026 vs Q4 2025:
| Region | Price (USD/MT) | QoQ Change | Direction |
|---|---|---|---|
| USA | 916 | +3.32% | ↑ |
| China | 957 | +2.11% | ↑ |
| Japan | 1,038 | +0.61% | ↑ |
| Brazil | 978 | +6.12% | ↑ |
| South Africa | 1,002 | +4.45% | ↑ |
To access real-time prices Request Sample
What Moved Prices:
USA:
- In Q1 2026, boric acid prices in the USA reached USD 916/MT, a 3.32% QoQ gain. Steady procurement from glass manufacturing, chemical processing, and agricultural micronutrient users sustained demand, while efficient import logistics and consistent raw material flows from domestic California mines limited supply-side friction through the period.
- Supported by disciplined production at the Boron Mine and measured import volumes from South American origins, the market held its upward bias well into March. Chemical processing output expanded across Gulf Coast facilities, reinforcing buying interest. Monitoring the boric acid price chart throughout Q1 2026 showed a consistent, uninterrupted rise instead of a singular spike, highlighting the demand-driven aspect of the quarterly increase.
China:
- During Q1 2026, boric acid prices in China climbed to USD 957/MT as domestic consumption from ceramics, fiberglass, and fertilizer producers ran at elevated rates. Supply-side output constraints among regional miners narrowed spot availability, and favorable export conditions from major producers kept transaction volumes tight through the quarter.
- Constrained by controlled operating rates at several eastern processing facilities, spot market liquidity tightened noticeably in February. Electronics glass and flat-panel display manufacturers maintained scheduled procurement without deferring orders, removing the usual buffer of deferred buying. Earlier-than-typical contract securing by industrial buyers further firmed assessed values into March.
Japan:
- In Q1 2026, boric acid prices in Japan edged to USD 1,038/MT, the smallest QoQ gain across tracked regions at 0.61%. Specialty glass and semiconductor-adjacent manufacturers sustained steady import procurement, while moderate upstream raw material cost increases filtered through the supply chain without triggering sharp upward price moves.
- Against the backdrop of a structurally weak yen, landed costs for Japanese importers drifted upward even as freight rate changes remained moderate. Local supply carried no significant overhang. Glass and industrial fabricators maintained consistent off-take without accelerating purchases, keeping the overall trajectory measured rather than accelerating sharply.
Brazil:
- During Q1 2026, boric acid prices in Brazil surged to USD 978/MT, the largest QoQ increase at 6.12% among all tracked markets. Fertilizer and chemical manufacturing buyers accelerated procurement well ahead of agricultural application cycles, while logistical and transportation bottlenecks on major import corridors compressed available spot supply through the quarter.
- With BRL exchange rate volatility adding uncertainty to import-denominated transaction costs, distributors moved to cover positions earlier than usual. Port congestion at Santos and Paranagua limited inbound shipment throughput, leaving buyers with fewer alternatives and reinforcing upward price momentum. Limited competing supply from alternative origins gave sellers pricing leverage throughout the period.
South Africa:
- In Q1 2026, boric acid prices in South Africa rose to USD 1,002/MT, a 4.45% QoQ advance. Agricultural, industrial, and water treatment applications drove moderate demand, yet import availability proved the more consequential variable as inbound supply through Durban and Coega tightened more sharply than end-use consumption itself warranted.
- Held back by persistent port infrastructure constraints and longer-than-usual dwell times for containerized imports, procurement lead times extended through February. Buyers reliant on Asia-origin cargoes absorbed both higher freight premiums and currency-related cost escalation on ZAR-denominated procurement. Chemical processing consumption added incremental steady-state demand, preventing any softening of the import cost floor.
Drivers Influencing the Market:
Several factors continue to shape boric acid pricing and market behavior:
- Glass, Fiberglass, and Ceramics Sector Demand: Borosilicate glass, insulation fiberglass, and advanced ceramics collectively account for a substantial share of global boric acid output. Consistent capacity utilization among tile and sanitaryware manufacturers in Asia and Europe anchors the baseline off-take volume that underpins the boric acid price index across producing regions. Rising construction output in Southeast Asian markets and expanding LCD panel fabrication in East Asia add incremental demand layers year on year.
- Upstream Boron Ore and Mineral Cost Dynamics: At the raw material level, colemanite and kernite extraction economics set the production cost floor for refiners globally. Turkey's state-controlled producer accounts for the bulk of refined borate supply, a concentration that leaves downstream markets exposed to single-source risk when ore output tightens. Permitting delays and overland logistics costs on Turkish export corridors pass directly into finished boric acid valuations, particularly for European and Asian buyers.
- Energy Expenditure in Refining and Processing: Calcination and refining stages consume significant quantities of natural gas and electricity, keeping boric acid production cost profiles tightly coupled to regional energy markets. Producers in Turkey, China, and the US face divergent gas pricing environments that directly shape their competitive position on international tenders. Elevated energy cost periods compress refiner margins and translate into upward finished-goods pricing across major trade lanes.
- Ocean Freight and Logistics Economics: Container freight rate movements on Asia-Europe and Transpacific corridors translate directly into landed cost shifts for import-dependent boric acid markets. Drewry's World Container Index recorded a 12% weekly surge to USD 2,182 per 40ft container in December 2025, extending a four-week run of gains on major East-West trade lanes, with further firmness recorded into Q1 2026. Brazil, South Africa, and Japan absorb these rate swings through procurement cost calculations with limited ability to substitute domestic supply.
- Environmental and Regulatory Compliance: Tightening environmental standards governing boron ore mining, boric acid handling, and discharge protocols raise operational compliance expenditures for producers and distributors alike. Per the Federal Register, the USGS formally added boron to the US 2025 Critical Minerals List in November 2025, reflecting supply chain vulnerability and strategic economic importance. Federal investment into domestic boron projects now accelerates as a direct consequence, reshaping the longer-term supply landscape.
- Trade Policy and Currency Dynamics: Export concentration in Turkey and evolving US tariff frameworks create intermittent pricing risk for importers across the Americas, Asia, and Africa. BRL and ZAR depreciation cycles elevate procurement costs on import-denominated transactions for Brazilian and South African buyers, while yen weakness amplifies landed costs across Japanese import channels. Bilateral trade adjustments and critical mineral policy shifts add a further layer of forward procurement uncertainty.
Recent Highlights & Strategic Developments:
Recent strategic moves within the industry further illustrate evolving dynamics:
- In October 2025, 5E Advanced Materials, Inc. completed the initial shipment of 20 Tons of boric acid produced at its Fort Cady facility in Southern California, alongside plans to dispatch an additional 1,000 pounds to support domestic boron carbide (B4C) manufacturing capacity.
Outlook & Strategic Takeaways:
Looking ahead, the boric acid market is expected to sustain gradual volume expansion through 2034, fueled by fiberglass and specialty glass consumption growth, rising agricultural micronutrient adoption across Latin America and Africa, and widening electronics-grade applications in semiconductor fabrication. Upstream ore cost trajectories and container freight rate dynamics on import corridors will remain the decisive variables shaping the boric acid price forecast for buyers and producers alike.
To navigate this complex landscape, stakeholders should:
- Assess Freight Market Developments: Monitor container shipping rate trends on Asia-Europe, Transpacific, and Asia-South Africa corridors to anticipate landed cost movements. Negotiate logistics contracts incorporating Drewry WCI-linked rate adjustment mechanisms to limit exposure to spot market surges.
- Evaluate Downstream Demand Indicators: Track glass production output indices, agricultural micronutrient application cycles, and electronics order books across principal consumption regions. Correlate demand signals with procurement planning to optimize inventory positioning ahead of seasonal peaks.
- Review Regulatory Compliance Expenditures: Audit compliance costs tied to boron handling, storage, and environmental discharge obligations across all operating jurisdictions. Identify process efficiencies that reduce the regulatory burden without compromising chemical safety obligations.
- Strengthen Currency Exposure Management: Implement hedging strategies for procurement denominated in BRL, ZAR, and JPY to stabilize landed cost projections in volatile-currency markets. Align treasury and procurement functions so foreign exchange coverage tracks anticipated import payment timelines.
- Explore Emerging Application Segments: Investigate growth potential in boron carbide for defense and nuclear applications, borate-based electrolytes for energy storage, and advanced flame-retardant composites. Engage research partners to assess commercial viability of novel end-uses that expand addressable demand.
- Monitor Regional Price Differentials: Track quarterly pricing variations across the USA, Japan, Brazil, South Africa, and China to identify cost-saving windows. Benchmarking boric acid price per MT against landed import costs equips procurement teams to choose between competing origins at each contract renewal.
Subscription Plans & Customization:
IMARC offers flexible subscription models to suit varying needs:
- Monthly Updates: 12 deliverables/year
- Quarterly Updates: 4 deliverables/year
- Biannual Updates: 2 deliverables/year
Each includes detailed datasets (Excel + PDF) and post-report analyst support.

Get in Touch With Us
UNITED STATES
Phone: +1-201-971-6302
INDIA
Phone: +91-120-433-0800
UNITED KINGDOM
Phone: +44-753-714-6104
Email: [email protected]
Client Testimonials


.webp)


