Copper Plate Price Increases 6.0% in Germany, 3.5% in Australia — Q1 2026 Update
24-Oct-2025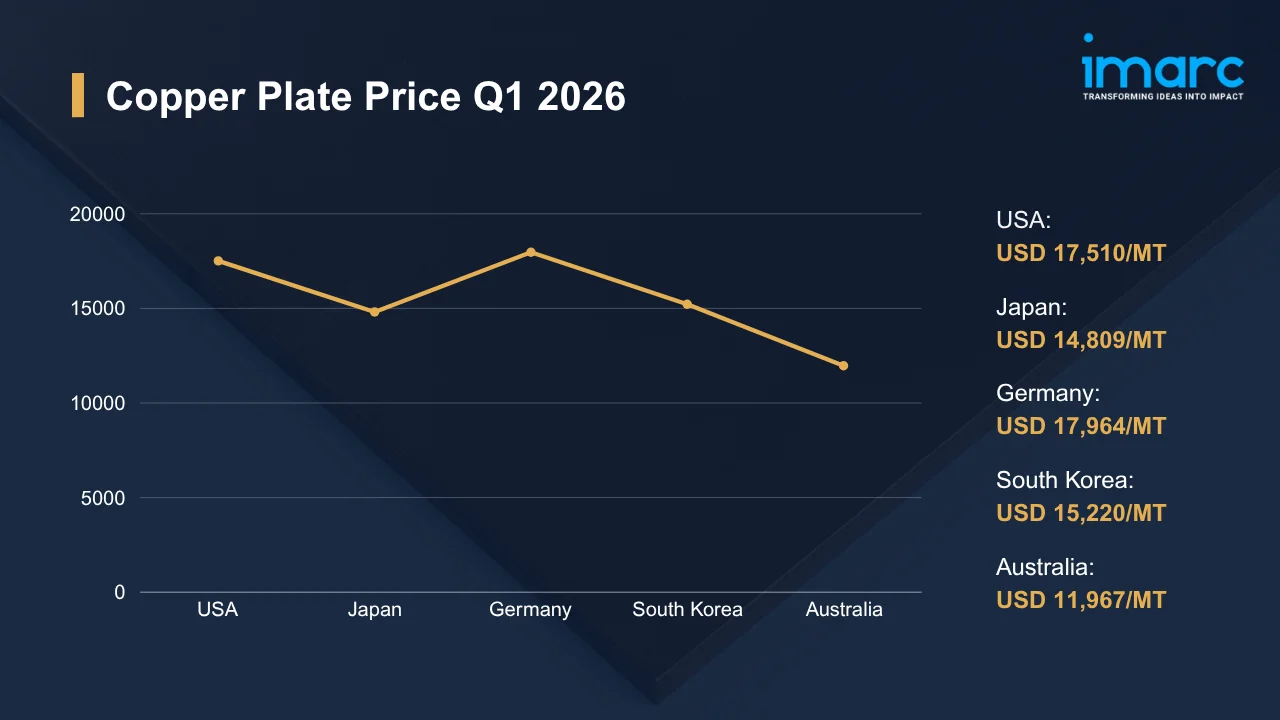
Summary:
Every tracked copper plate market gained ground in Q1 2026. Lifted by steady pull from electrical, construction, and electronics buyers, with disciplined mill output and balanced imports keeping supply orderly, copper plate prices firmed through the quarter as inventories drew down on consistent off-take. Across the tracked markets, gains ranged from 2.0% to 6.0% quarter-on-quarter. Geopolitical risk added another layer to the picture. As of April 8, 2026, the pricing for Brent crude oil shipments was recorded at USD 124.68 for each barrel.
Copper Plate Price Q1 2026:
Regional prices (USD per MT) and QoQ changes Q1 2026 vs Q4 2025:
| Region | Price (USD/MT) | QoQ Change | Direction |
|---|---|---|---|
| USA | 17,510 | +2.0% | ↑ Growth |
| Japan | 14,809 | +2.2% | ↑ Growth |
| Germany | 17,964 | +6.0% | ↑ Growth |
| South Korea | 15,220 | +2.9% | ↑ Growth |
| Australia | 11,967 | +3.5% | ↑ Growth |
To access real-time prices Request Sample
Kindly note: IMARC’s pricing database tracks copper plate price movements across major global markets.
What Moved Prices:
USA:
- During Q1 2026, US copper plate prices climbed to USD 17,510/MT, lifted by Gulf Coast manufacturers, electrical equipment fabricators, and construction contractors holding consistent monthly off-take through March even as broader macro signals stayed mixed. Across the quarter, refined cathode availability held firm. Imports flowed in on schedule, leaving spot premiums orderly.
- Pull through the copper plate price chart for North America leaned positive across the quarter, with grid reinforcement work, electrical-equipment manufacturing, and renewable installations all keeping order books from going quiet even as some converters trimmed inventory targets. At Gulf and East Coast mills, operating momentum remained stable, while the market avoided any major spot buying rushes during the period.
Japan:
- In Q1 2026, Japan copper plate prices firmed to USD 14,809/MT, helped along by Tokyo and Nagoya electronics fabricators, automotive component plants, and precision equipment producers all running on familiar monthly schedules even as the yen drifted against the dollar. At major mills, output stayed flat. Across buyers, cautious order sizes prevailed throughout.
- Yen weakness pushed CIF import costs marginally higher, though precision equipment exports, consumer electronics shipments, and automotive component orders kept domestic mills with full backlogs through the quarter, leaving little room for buyer pushback on offer levels. Through March, forward-cover positions stayed light. Spot tonnage cleared without surcharge layers.
Germany:
- In Q1 2026, Germany copper plate prices climbed to USD 17,964/MT, the panel’s strongest gain, with construction firms, mechanical engineering producers, and grid electrification work driving steady regional off-take that held up even through soft February data prints. At domestic mills, production ran at full tilt. Import arrivals stayed orderly across the quarter.
- Mittelstand converters across the Rhine corridor kept booking copper plate at steady volumes, with grid upgrades and machinery production leading the order book and forward-cover activity climbing through March as buyers tried to lock supply ahead of expected Q2 tightness. On the inventory side, positions stayed lean throughout. Spot premiums firmed week by week.
South Korea:
- During Q1 2026, South Korea copper plate prices firmed to USD 15,220/MT, with Ulsan shipyards, Suwon electronics plants, and Busan component fabricators all booking consistent monthly tonnage even as Won fluctuations against the dollar pressured CIF economics on selected lanes. Across the quarter, smelter output ran steady. Cargoes cleared customs without notable delays.
- Korean rolling mills kept inventories within standard target ranges through the quarter, with export-oriented producers feeding consistent monthly tonnage to downstream electronics and shipbuilding clients while spot trade flowed smoothly across intra-Asian corridors despite occasional Won-driven repricing pressure. Across cargoes, FOB premiums held firm. Procurement discipline kept buyers patient throughout.
Australia:
- In the first quarter of 2026, Australian copper plate prices reached USD 11,967/MT, with construction sites, mining sector procurement, and infrastructure projects across Western Australia keeping a steady draw on regional inventory through the quarter and pushing offer levels gradually higher. Across the supply chain, logistics costs stayed flat. Operational expenses tracked the long-term trend.
- Export tonnage into Southeast Asia tightened domestic availability through the quarter, with mining equipment OEMs and grid-related infrastructure projects keeping a constructive market tone while AUD softness against the dollar lifted landed import costs from Asian origins and pushed local offer levels higher. Through March, spot premiums climbed steadily. Customer order books stayed full throughout.
Copper Plate Price Outlook After the Israel–Iran–USA Conflict:
Rising Energy Costs and Refined Copper Feedstock Pressure for Copper Plate: Energy volatility flowing from the conflict might amplify cost pressure on copper plate smelters and rolling mills, especially where regional power tariffs track Brent benchmarks tightly enough to feed through into electricity bills within weeks. On the feedstock side, refined copper stays exposed to risk-off swings.
Regional Demand Uncertainty and Price Volatility for Copper Plate: Buyer appetite across major copper plate regions might soften if conflict headwinds drag on through the third quarter, though electrical and construction end users will hold their baseline tonnage requirements regardless of macro noise. Across spot trades, volatility will likely widen further. Speculative flows might whipsaw intraday levels on every ceasefire or escalation headline.
Immediate Market Reaction:
As the conflict reshapes Middle East trade, copper plate buyers turn cautious. Asian and European converters pull from non-conflict origins, while Middle East-adjacent procurement faces lengthening lead times and surcharges piling onto spot inquiries. Across regional benchmarks, risk premiums climb measurably. Even where physical demand looks steady, the copper plate price index sits above Q4 2025 averages on shifting cost structure alone. Around the Strait of Hormuz, rerouting via the Cape of Good Hope and Asian transshipment hubs might lift working capital cycles for carriers managing delivery commitments under wartime conditions across the foreseeable horizon.
Impact on Copper Plate Prices:
The conflict might trigger several key changes in the copper plate market:
- Elevated Feedstock and Energy Cost Transmission: Higher Brent crude and natural gas pricing will pass through to smelter electricity bills and refining input costs across major copper plate production hubs in Asia, Europe, and North America throughout 2026, particularly where long-term power contracts contain fuel-indexed repricing windows. To offset this, producers might lift posted offer levels across regional contracts. Across 2026, recovery margins on incremental energy expense will firm gradually.
- Logistics and Insurance Premium Repricing: Container and bulk shipping rates on conflict-adjacent lanes will rise as carriers reroute around Strait of Hormuz exposure, while tanker insurance premiums climb sharply for vessels transiting the Persian Gulf and adjacent waters across the foreseeable horizon. Within landed copper plate prices, these cost layers will accumulate through 2026. Buyers tied to Middle East-adjacent infrastructure face the steepest cost exposure.
- Demand Hesitancy and Procurement Hedging Behavior: Hedging activity across major converters and trading firms is expected to increase, with copper plate price risks managed more actively through LME and SHFE positions, keeping market fluctuations elevated through 2026. At the same time, buyers may continue postponing non-essential purchases as visibility across industrial demand remains limited in most regions.
Together, these dynamics will reshape near-term copper plate pricing, with cost-push transmission from refined feedstock lifting offer levels even as demand-side caution among electrical and construction buyers softens absorption rates across major end use segments over time. Across regions, pricing power runs uneven. Lag effects will narrow as 2026 progresses through subsequent quarters.
Supply Chain Disruptions:
Strait of Hormuz disruption hits Middle East-adjacent copper plate trade flows directly. Around the Cape of Good Hope, Suez rerouting adds 14 to 21 days to standard Asia-Europe schedules, while bunker surcharges and wartime risk premiums layer onto every landed cost calculation moving across the major trading desks. According to Al Jazeera, in early March 2026, war-risk insurance premiums for tankers transiting the region jumped to 1% of ship value during peak escalation, up from about 0.2% before the conflict.
Alternative routing through Asian transshipment hubs and Pacific corridors will partially offset disruption, though port congestion at Mundra, Singapore, and Jebel Ali might stretch lead times further as rerouted volumes pile up. Drawing on buffers, producers will hold exposure in check. Across copper plate fabricators, forward-cover positions will likely activate to lock in tonnage, while procurement teams reassess vendor concentration under prolonged conflict scenarios that may persist through year-end. Vendor portfolios will diversify gradually through 2026.
Global Market Overview:
Globally, the copper plate industry reached a volume of 4.0 Million Tons in 2025. Market projections indicate steady growth, with the industry expected to reach 6.0 Million Tons by 2034, with a compound annual growth rate (CAGR) of 4.33% during 2026-2034. Pulled by electronics, automotive, and renewable energy infrastructure deployment, the copper plate price trend continues building momentum, while supply-side constraints and conductive-material innovation shape long-term trajectory across major regional markets globally. Across major economies, grid electrification keeps reinforcing the structural growth picture.
Recent Highlights & Strategic Developments:
Recent strategic moves within the industry further illustrate evolving dynamics:
- In October 2025, African Discovery Group inked a term sheet to acquire the Butembo Copper exploration license in the Democratic Republic of Congo, with the deal structured as a 100% share purchase of SOCIETE GRABIN MINING SAS to anchor a combined copper enterprise built for sustained value creation.
Copper Plate Price Forecast (2026):
Near-term copper plate prices will remain sensitive to conflict-driven energy swings and shifting downstream demand patterns, with procurement caution likely persisting among electrical equipment manufacturers, automotive fabricators, and construction contractors well into the second half of 2026. Should geopolitical risk ease, prices might stabilize as supply chains normalize. Energy and feedstock signals will set the cadence.
Should hostilities intensify, copper plate prices will likely face renewed upward pressure as energy costs climb, logistics expenses widen across trade routes, and risk premiums on conflict-adjacent corridors expand sharply through coming quarters. In conflict-exposed zones, producers might curtail output. A diplomatic resolution will ease freight rates and restore feedstock supply, allowing prices to drift toward pre-conflict levels by late 2026. Across these scenarios, the copper plate price forecast will firm or ease through 2026.
Strategic Takeaways:
Looking ahead, the copper plate market is expected to thread a multi-year period defined by elevated geopolitical risk premiums, structural electrification-driven demand growth, and tighter refined-copper feedstock dynamics across major producing regions. Stakeholders must steer through sustained pricing volatility while staying positioned to capture growth opportunities on disciplined procurement.
To navigate this complex landscape, stakeholders should:
- Monitor Regional Price Differentials: Track quarterly pricing variations across the USA, Germany, Japan, South Korea, and Australia. Benchmark landed costs against contract rates and adjust sourcing regionally to identify cost-saving procurement windows and sustain value capture across major markets.
- Monitor Geopolitical Risk Exposure: Track escalation dynamics in the current conflict and assess how shifts in hostility levels might affect copper plate pricing, feedstock availability, and logistics costs. Establish internal alert thresholds that trigger procurement or hedging action immediately.
- Diversify Feedstock Supply Channels: Evaluate alternative refined copper suppliers beyond current vendor portfolios to mitigate concentration risk over time. Secure secondary supply agreements that activate during periods of primary source disruption, capacity constraint, or quality variance across regional supplier deliveries.
- Diversify Supply Chain Routes: Evaluate alternative sourcing geographies and shipping corridors to reduce dependence on conflict-exposed trade lanes. Secondary supplier agreements and contingency freight arrangements will provide critical resilience if primary routes face sustained disruption through coming quarters of conflict.
- Adjust Procurement Strategy for Conflict Conditions: Adopt flexible contract structures with price reopener clauses and force majeure provisions to protect against geopolitical price spikes through 2026. Precautionary inventory buffers might reduce exposure if supply tightens abruptly under wartime trade conditions across regions.
- Benchmark Against End-Use Demand: Evaluate copper plate price per MT against electrical, construction, and renewable sector demand signals quarterly. Align procurement timing with downstream order books to capture favorable pricing windows during demand softness across regional copper markets globally.
Subscription Plans & Customization:
IMARC offers flexible subscription models to suit varying needs:
- Monthly Updates — 12 deliverables/year
- Quarterly Updates — 4 deliverables/year
- Biannual Updates — 2 deliverables/year
Each includes detailed datasets (Excel + PDF) and post-report analyst support.

Get in Touch With Us
UNITED STATES
Phone: +1-201-971-6302
INDIA
Phone: +91-120-433-0800
UNITED KINGDOM
Phone: +44-753-714-6104
Email: [email protected]
Client Testimonials


.webp)


