Hydrogen Price Increases 1.5% in Japan, 1.4% in Netherlands — Q1 2026 Update
24-Oct-2025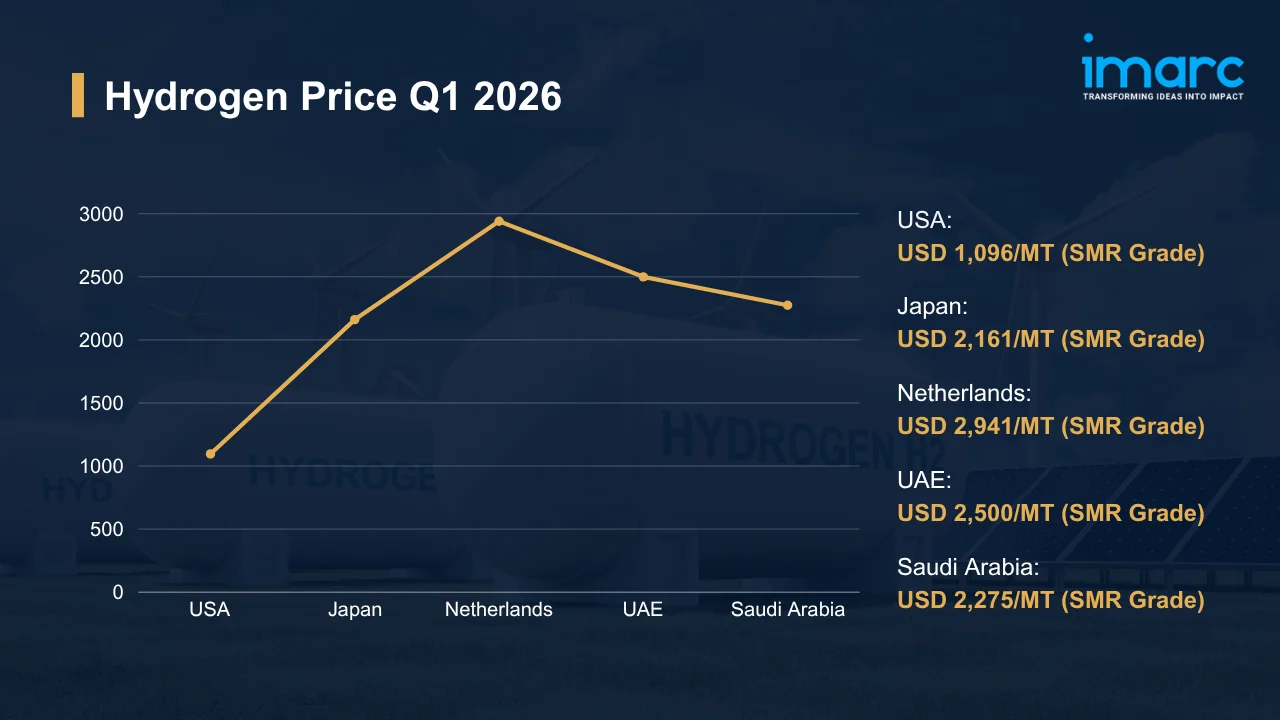
Summary:
Q1 2026 delivered a modest but unmistakably broad recovery across global hydrogen markets, with firming SMR-grade demand from refining, ammonia, and early-stage energy applications pulling prices off their historic Q4 2025 lows in every tracked region. Between 1.0% and 1.5% QoQ — that is the full range across which hydrogen prices moved, a tight spread that signals synchronized restocking rather than any supply-side shock. Against this backdrop, on March 30, 2026, the Israel–Iran–USA conflict pushed Brent crude to USD 116 per barrel following the Strait of Hormuz closure, introducing feedstock cost pressure that will reshape hydrogen pricing well into mid-2026.
Hydrogen Price Q1 2026:
Regional prices (USD per MT) and QoQ changes Q1 2026 vs Q4 2025:
| Region | Price (USD/MT) | QoQ Change | Direction |
|---|---|---|---|
| USA | 1,096 (SMR Grade) | +1.0% | ↑ Growth |
| Japan | 2,161 (SMR Grade) | +1.5% | ↑ Growth |
| Netherlands | 2,941 (SMR Grade) | +1.4% | ↑ Growth |
| UAE | 2,500 (SMR Grade) | +1.2% | ↑ Growth |
| Saudi Arabia | 2,275 (SMR Grade) | +1.1% | ↑ Growth |
To access real-time prices Request Sample
Kindly note: IMARC’s pricing database tracks hydrogen price movements across major global markets.
What Moved Prices:
USA:
- During Q1 2026, hydrogen prices in the USA firmed to USD 1,096/MT (SMR Grade), a 1.0% QoQ gain that ended four consecutive quarters of decline and confirmed the hydrogen price chart’s turn toward stabilization, driven by recovering offtake from Gulf Coast refinery operations and early-stage fuel cell deployment programs. Prices held steady as buyers restocked measured volumes. Feedstock economics reinforced the move upward, as domestically produced natural gas remained ample at contained input costs, giving producers room to incrementally rebuild offtake volumes without compressing margins on new supply commitments.
- Selectively, procurement teams at ammonia and petroleum refining facilities stepped up restocking activity after two periods of conservative sourcing posture. Inland logistics conditions remained stable throughout the quarter, removing freight-driven cost pressure that had periodically firmed delivered prices in prior periods and widening the margin available to buyers committing to near-term volumes. Buyer commitments stayed modest in scale nonetheless, with most converters preferring structured short-cycle arrangements over extended volume positions ahead of the still-evolving geopolitical cost outlook.
Japan:
- In Q1 2026, SMR-grade hydrogen prices in Japan rose to USD 2,161/MT, climbing 1.5% QoQ as consumption from refining, chemical processing, and mobility-related pilot programs provided a firmer demand floor than the prior quarter’s sharp contraction had sustained. Tight domestic production flexibility persisted as a structural constraint throughout. Structured long-term import arrangements, aligned with Japan’s national hydrogen economy roadmap, kept buyer volumes stable without triggering the kind of speculative spot activity that could have amplified the upward price move disproportionately.
- Anchoring buyer sentiment through the quarter, policy subsidies tied to Japan’s hydrogen roadmap kept procurement timelines predictable despite uncertainty from conflict-related LNG supply disruptions entering the region. Currency dynamics and landed import costs introduced moderate variability in delivered benchmarks for liquefied hydrogen and ammonia-carrier shipments from Gulf and Australian origins. Run rates held firm across all major industrial zones. Refinery operations across the Keihin and Chiba industrial corridors served as the primary demand anchor, reinforcing incremental volume growth and preventing the kind of procurement withdrawal that had characterized Q4 2025.
Netherlands:
- In the first quarter of 2026, hydrogen prices in the Netherlands climbed to USD 2,941/MT (SMR Grade), a 1.4% QoQ gain underpinned by a gradual pickup in industrial offtake from chemicals and processing segments as buyers moved past the conservative sourcing behavior that had defined Q4 2025. Supply held steady throughout the quarter. The hydrogen price trend through the period reflected incremental demand normalization rather than any acute availability squeeze, with established production capacity and reliable pipeline infrastructure ensuring that restocking activity could proceed without cost escalation on the supply side.
- Elevated by EU carbon pricing mechanisms and advancing electrolyzer project pipelines, long-term procurement interest across the region stayed high through the period, even as near-term spot market dynamics remained anchored to operational consumption. Rhine corridor logistics conditions were stable. Mittelstand industrial buyers approached the quarter with measured restocking intent, preferring short-cycle sourcing structures that preserved the flexibility needed to pivot quickly if feedstock cost volatility linked to the Middle East conflict accelerated in the coming months.
UAE:
- During Q1 2026, UAE hydrogen prices rose to USD 2,500/MT (SMR Grade), a 1.2% QoQ increase generated by consistent refining and industrial fuel demand held against a backdrop of steady integrated production output throughout the period. Integrated production stayed reliable throughout the quarter. Long-term supply arrangements and petrochemical-linked infrastructure insulated the domestic market from acute procurement pressure, allowing large-scale industrial operations to maintain sourcing continuity through established frameworks without expanding spot activity.
- Export-oriented hydrogen and ammonia production had already kept the domestic market tighter than peers through Q4 2025, preventing the steep declines seen elsewhere and leaving less room for a proportional rebound once demand firmed. Spot activity remained subdued through Q1 2026, with buyers focused on logistics planning and industrial run-schedule alignment over incremental restocking, reflecting a market that had not experienced the same procurement vacuum that drove sharper recoveries in Japan and the Netherlands.
Saudi Arabia:
- In Q1 2026, hydrogen prices in Saudi Arabia edged up to USD 2,275/MT (SMR Grade), a 1.1% QoQ rise that reflected the combined effect of steady domestic demand from refining and ammonia production and the cushion provided by strong upstream integration in the country’s gas and hydrocarbon value chain. Upstream integration strength held throughout the quarter. Vision 2030–linked investment in green and blue hydrogen infrastructure sustained institutional offtake activity, ensuring demand breadth beyond conventional industrial channels without requiring aggressive spot market participation from procurement teams.
- Contained by domestic natural gas availability at competitive input costs, SMR-grade production economics reinforced a pricing environment that rewarded contracted buyers over those seeking spot volumes and prevented any cost-push from the supply side entering Q1 2026. Infrastructure development milestones continued to advance on schedule. Near-term price formation remained anchored to conventional SMR-grade demand dynamics, even as large-scale green hydrogen project development continued generating background procurement interest from buyers seeking to establish future positions in low-carbon supply chains.
Hydrogen Price Outlook After the Israel–Iran–USA Conflict:
Rising Energy Costs and Natural Gas Feedstock Pressure for Hydrogen: SMR-grade hydrogen’s direct natural gas feedstock exposure means the conflict transmits immediately into input cost pressure across every import-dependent producing region. At 70% above pre-conflict levels by March 2026, European TTF gas benchmarks reached €54.5 per megawatt-hour, driven by Qatar’s force majeure declaration on LNG exports and near-total Strait of Hormuz transit restriction. Producers reliant on imported natural gas feedstock will face margin compression that flows into offered hydrogen prices across European and Northeast Asian markets before demand adjustments can absorb the cost shift.
Regional Price Volatility and Demand Uncertainty for Hydrogen: Pricing certainty, once the baseline assumption in structured hydrogen procurement, is no longer reliable as the conflict extends into its second month. For buyers in refining, chemical processing, and mobility segments, the cost of SMR-grade output becomes harder to forecast quarter-on-quarter when natural gas benchmarks are moving by double-digit percentages within a single week, and procurement teams might recalibrate sourcing timelines rather than commit to volumes at prices that could shift materially before delivery. The heaviest exposure sits squarely with markets that source the largest share of their hydrogen feedstock via Gulf-region LNG imports, a supply route that remains severely constrained as of April 2026.
Immediate Market Reaction:
Across the hydrogen market, cost assumptions for SMR-grade producers are being actively reshaped as feedstock pricing connects to energy disruptions concentrated in the Gulf region and no longer tracks historical input cost curves. The hydrogen price index faces upward recalibration as Qatari LNG exports through the Strait of Hormuz remain near-totally restricted, compressing the natural gas supply available to European and Asian SMR operators below the volumes needed to cover normal production schedules. Short on feedstock options, production facilities dependent on Gulf-origin imports might encounter acute cost escalation if the disruption extends past mid-2026 without meaningful rerouting alternatives.
Impact on Hydrogen Prices:
The conflict might trigger several key changes in the hydrogen market:
- Natural Gas Feedstock Cost Escalation: With Middle Eastern LNG exports severely restricted and European gas storage at critically low levels entering Q1 2026, SMR-grade hydrogen producers face a feedstock cost squeeze that will transmit directly into offered prices across most tracked markets. Buyers in Europe and Northeast Asia dependent on imported natural gas might absorb these increases through contract renegotiation or a pivot toward longer-term supply lock-ins. Contract structures will need to reflect this new cost reality as the conflict extends beyond its initial phase.
- Green Hydrogen Competitive Positioning: Sustained natural gas price inflation might narrow the cost premium that green hydrogen carries over SMR-grade alternatives in markets with access to low-cost renewable electricity. This dynamic will accelerate procurement interest in electrolyzer-based supply in Europe and parts of Asia-Pacific, creating a bifurcated pricing landscape where green hydrogen gains relative competitiveness during periods of sustained fossil feedstock inflation.
- Export Route Disruption and Regional Price Divergence: Gulf-region hydrogen and ammonia producers supplying feedstock-linked volumes to global buyers face logistics disruptions that might prevent consistent export flows through the conflict period. Markets across Asia and Europe are likely to experience tighter supply and higher landed costs, as war-risk insurance premiums and rerouting around the Cape of Good Hope lengthen transit times by ten to fourteen days and increase fuel expenses for every Aframax tanker voyage.
Taken together, these three pressures might generate a two-speed hydrogen pricing environment through the remainder of 2026, with SMR-grade markets absorbing feedstock-driven cost inflation while green hydrogen gradually closes the cost gap from below. Teams that embed scenario flexibility into their sourcing frameworks now carry a tangible cost advantage as the conflict’s market impact compounds through Q2 and Q3 2026.
Supply Chain Disruptions:
The Strait of Hormuz is the main export corridor for Gulf-region LNG and natural gas, which form the feedstock base for global SMR-grade hydrogen production. Since hostilities began, shipping through the strait has dropped sharply, severely disrupting the region’s gas export flows. For hydrogen producers dependent on Qatari and Saudi-origin gas feedstock, this disruption is expected to keep procurement costs elevated and may force rapid sourcing shifts toward North American or North Sea-linked supply alternatives if the disruption continues.
Rerouting around the Cape of Good Hope adds ten to fourteen days per voyage, a burden that flows upward through LNG landed costs and directly into SMR-grade hydrogen production economics at every facility dependent on seaborne feedstock supply. Those cost additions accumulate quickly and compound across the supply chain. Gulf-based hydrogen and ammonia exporters are managing logistics through limited Saudi and UAE pipeline bypass capacity and selective vessel negotiations with Iran, though these workarounds will not restore the throughput volumes needed to stabilize feedstock availability in the near term. Accelerating supplier diversification away from Gulf-origin feedstock is the single most actionable response for procurement teams exposed to this disruption.
Global Market Overview:
Globally, the hydrogen industry was valued at USD 201.4 Billion in 2025. Market projections indicate steady growth, with the industry expected to reach USD 305.9 Billion by 2034, with a compound annual growth rate (CAGR) of 4.70% during 2026-2034. Clean energy policy frameworks across major economies are expanding hydrogen’s end use base rapidly in transportation, power generation, and heavy industrial decarbonization. Driven by falling electrolyzer costs and rising renewable power capacity, electrolysis-based production is gaining commercial viability across markets where it previously could not compete on unit economics.
Recent Highlights & Strategic Developments:
Recent strategic moves within the industry further illustrate evolving dynamics:
- In March 2026, thyssenkrupp nucera expanded its footprint in the international hydrogen industry with a new FEED study for a significant project in India. The firm collaborated with Juno Joule to create a green ammonia plant that included a significant electrolysis system. The initiative will combine renewable energy sources to generate export-focused green ammonia, aiding Europe’s clean energy needs and broadening sustainable industrial uses.
- In February 2025, Spanish gas grid operator Enagás committed over USD 4.18 Billion toward infrastructure investment by 2030, positioning hydrogen infrastructure as the strategic centerpiece of its transition away from conventional gas operations.
Hydrogen Price Forecast (2026):
Near-term hydrogen prices will remain sensitive to natural gas cost movements and conflict-driven LNG supply disruptions across key sourcing corridors for the foreseeable future. Sustained by low European gas storage levels and a Strait of Hormuz that has yet to fully reopen, procurement caution in European and Northeast Asian markets will persist well into the second half of 2026. That persistence might accelerate a structural shift toward electrolyzer-based green hydrogen supply in markets where renewable electricity is cheap enough to make the switch economically viable ahead of the usual adoption timeline.
If geopolitical hostilities intensify and Gulf export infrastructure remains impaired, SMR-grade hydrogen prices will face renewed upward pressure as feedstock cost increases pass through to offered prices and conflict-exposed Gulf exporters curtail logistics operations. European markets carry the sharpest near-term exposure: gas storage levels entered the summer refill season at historically low levels, and any delay in Hormuz reopening will deepen that deficit before autumn. Conversely, a diplomatic resolution and full reopening of the Strait of Hormuz might ease natural gas feedstock costs, allowing hydrogen prices to stabilize or retrace the gains made through Q1 2026 as LNG supply flows normalize. Buyers navigating both scenarios will find the hydrogen price forecast most useful when treated as a live scenario-planning input rather than a single-point prediction.
Strategic Takeaways:
Looking ahead, the hydrogen market is expected to sustain long-term growth momentum as clean energy transition policies deepen procurement demand across the transportation, refining, and industrial decarbonization sectors worldwide. Geopolitical and feedstock cost volatility from the Israel–Iran–USA conflict will sharpen the need for adaptive, scenario-aware sourcing and supply chain risk management frameworks.
To navigate this complex landscape, stakeholders should:
- Monitor Geopolitical Risk Exposure: Track escalation dynamics in the current conflict and assess how shifts in hostility levels might affect hydrogen pricing, feedstock availability, and logistics costs. Establish internal alert thresholds that trigger procurement or hedging action before cost increases materialize in active contract renewals.
- Diversify Supply Chain Routes: Evaluate alternative sourcing geographies and shipping corridors to reduce dependence on conflict-exposed trade lanes. Secondary supplier agreements and contingency freight arrangements will provide critical resilience if primary Gulf-region hydrogen and LNG routes face sustained disruption.
- Adjust Procurement Strategy for Conflict Conditions: Adopt flexible contract structures with price reopener clauses and force majeure provisions to protect against geopolitical price spikes. Precautionary inventory buffers might reduce exposure if SMR-grade supply tightens abruptly across conflict-exposed production and export origins.
- Track Regional Price Differentials: Monitor the hydrogen price per MT across key supply regions quarterly to identify cost-saving procurement windows. Benchmark landed costs against prevailing contract rates to capture arbitrage opportunities between diverging SMR-grade and green hydrogen markets.
- Evaluate Green Hydrogen Competitiveness: Assess electrolyzer-based supply options in markets with low-cost renewable electricity access, particularly as natural gas price inflation narrows the cost premium. Securing pilot green hydrogen offtake agreements might reduce long-term feedstock dependency on geopolitically exposed natural gas supply chains.
- Monitor Natural Gas Benchmark Movements: Track Dutch TTF and Henry Hub prices as leading indicators for SMR-grade hydrogen production economics across European and North American markets. Establish cost modeling frameworks that translate gas price movements into expected hydrogen pricing impact across key procurement regions and active contract structures.
Subscription Plans & Customization:
IMARC offers flexible subscription models to suit varying needs:
- Monthly Updates — 12 deliverables/year
- Quarterly Updates — 4 deliverables/year
- Biannual Updates — 2 deliverables/year
Each includes detailed datasets (Excel + PDF) and post-report analyst support.

Get in Touch With Us
UNITED STATES
Phone: +1-201-971-6302
INDIA
Phone: +91-120-433-0800
UNITED KINGDOM
Phone: +44-753-714-6104
Email: [email protected]
Client Testimonials


.webp)


