
Adsorbents Market Size, Share, Trends and Forecast by Type, Application, and Region, 2026-2034
Adsorbents Market Size and Share:
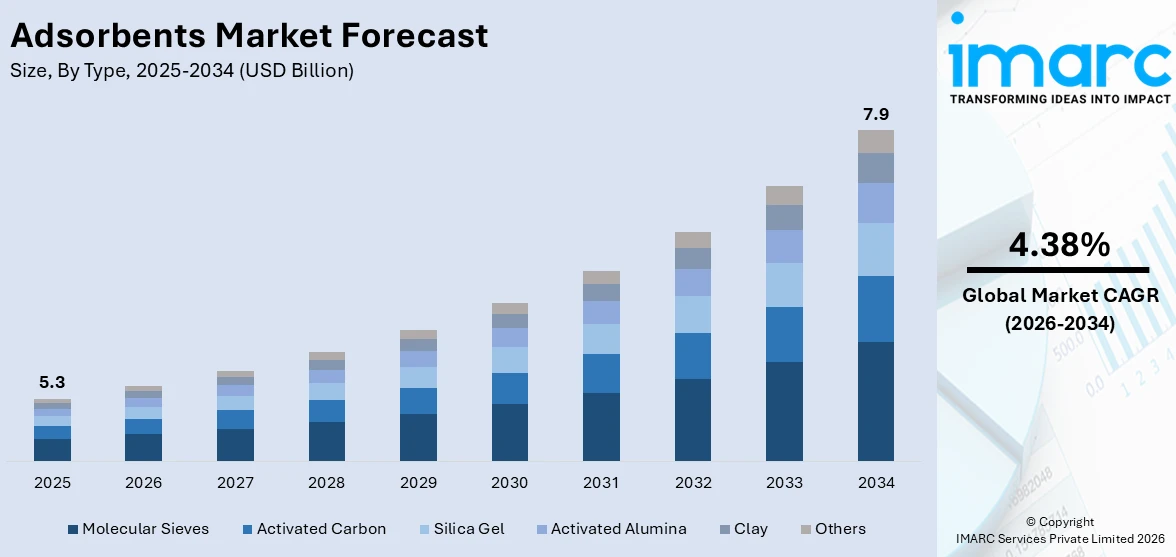
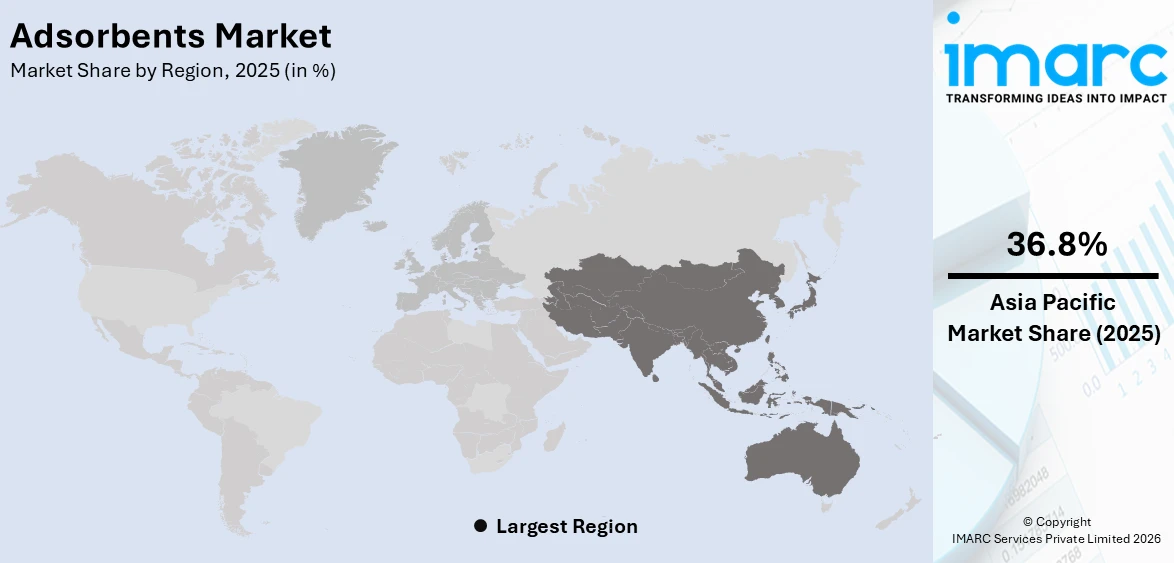
The global adsorbents market size was valued at USD 5.3 Billion in 2025. Looking forward, IMARC Group estimates the market to reach USD 7.9 Billion by 2034, exhibiting a CAGR of 4.38% during 2026-2034. Asia Pacific currently dominates the market, holding a significant market share of over 36.8% in 2025. Industrial growth, rising pollution control regulations, water treatment demand, petrochemical expansion, pharmaceutical needs, urbanization, economic development, and technological advancements are some of the major factors driving the adsorbents market share.
|
Report Attribute
|
Key Statistics
|
|---|---|
|
Base Year
|
2025
|
|
Forecast Years
|
2026-2034
|
|
Historical Years
|
2020-2025
|
|
Market Size in 2025
|
USD 5.3 Billion |
|
Market Forecast in 2034
|
USD 7.9 Billion |
| Market Growth Rate (2026-2034) | 4.38% |
The market is driven by increasing demand for adsorbents in water treatment, air purification, and industrial applications. Rising environmental concerns and stringent regulations on wastewater treatment and air pollution control are key factors fueling the adsorbents market growth. The growing use of adsorbents in petrochemical refining, gas separation, and chemical processing further boosts demand. Additionally, industries like pharmaceuticals and food & beverage rely on adsorbents for purification and moisture control. Technological advancements in nanomaterials and bio-based adsorbents enhance efficiency and sustainability. The expanding oil & gas sector, increasing use of activated carbon, silica gel, and zeolites, and rising consumer awareness of clean water and air further propel the market, making adsorbents essential for various industrial and environmental applications.
To get more information on this market Request Sample
The adsorbents market in the United States is driven by stringent environmental regulations, increasing demand for water treatment, and the need for air purification. The Environmental Protection Agency (EPA) enforces strict wastewater and emission control policies, boosting the adoption of industry adsorbents. Growth in the oil & gas sector, particularly in refining and natural gas processing, also fuels demand. High-quality adsorbents are necessary for purification and moisture control in expanding pharmaceutical operations as well as food and beverage sectors. The adsorbents market receives additional efficiency together with sustainability through technological improvements in nano-adsorbents and bio-based materials. The market for adsorbents continues to expand in the United States because consumer demand for purified air and water keeps growing while industrial operations increase their filtration and gas separation activities. For instance, in February 2024, Merichem Technologies announced that their SULFURTRAP® Lead/Lag Vessel Skid-Mounted Systems are available for leasing. SULFURTRAP has long been recognized as the leading hydrogen sulfide treatment option for gas streams. Merichem Technologies now offers an innovative lease arrangement that allows gas streams containing H2S to be cleaned using a ready-to-ship sulfur adsorption device with little capital expenditure. Furthermore, because SULFURTRAP® changeout is so simple and quick, end users of this system can save money on media changes while increasing the safety of the changeout procedure for their employees.
Adsorbents Market Trends:
Increasing Demand for Environmentally Friendly Adsorbents
There is no shortage of demand for sustainable and green adsorbents in industries as environmental awareness intensifies and governments become increasingly stringent with regulations. As the world's industries look to meet international sustainability targets, demand for adsorbents derived from natural, renewable, and non-poisonous sources is on the up. Environmental-friendly adsorbents, including those developed from agriculture wastes, natural polymers, and low environmental footprint activated carbons, are being incorporated into various applications from wastewater treatment to air filtration. They not only lower environmental contamination but also provide conformity to increasingly stringent regulations. Governments across the globe are backing the production and application of such adsorbents. For example, in the European Union, the Circular Economy Action Plan among other legislation encourages sustainable behavior, including the utilization of environmental-friendly materials within industrial processes. By 2030, by the European Commission, the EU is planning to recycle 65% of the municipal waste that will increase the demand for environment-friendly adsorbents for treating waste.
Advancements in Nanotechnology
Nanotechnology is transforming the adsorbents industry through increased efficiency and selectivity in adsorption processes. Nanostructured materials, such as nanoparticles, nanofibers, and nanocomposites, have high surface area and special chemical properties that enormously enhance their adsorption capability. These nanostructured materials can identify and target specific pollutants with more accuracy, which makes them suitable for heavy metal separation, air filtration, and chemical separation applications. Nanotechnology-based adsorbents are also cheaper and need fewer materials to obtain target performance levels. In the case of water purification, for instance, utilizing nanomaterials enables improved efficiency in adsorption, and this has promoted novel solutions for the development of water filtration systems. Nanomaterials' novel properties, says the National Institute of Standards and Technology (NIST), are propelling their use in environmental and industrial applications. The U.S. Environmental Protection Agency (EPA) has referred to the ability of nanotechnology to eliminate up to 99% of impurities in certain instances, thus making it a focal point for the development of water treatment technologies.
Rising Demand for Water and Air Purification Solutions
With mounting worldwide alarm at water scarcity and air contamination, the call for adsorbents employed in purification applications is booming. Such adsorbents as activated carbon find extensive use for the extraction of contaminants including heavy metals, organic impurities, and poisons from air and water. The solution has attracted heavy investments by industries and municipalities to abide by water and air quality requirements. With increasingly tighter environmental regulations, cost-efficient and high-capacity adsorbents are needed in industrial water treatment plants as well as municipal water treatment plants. For instance, the Maximum Contaminant Level (MCL) of lead in drinking water is regulated by the Environmental Protection Agency (EPA) in the U.S. to 15 parts per billion (ppb), which has resulted in widespread use of adsorbents in water filtration systems. According to industrial reports, in 2023, over 44 million individuals in the U.S. were estimated to be served by water systems that were not in compliance with safe drinking water standards, highlighting the need for effective adsorbent-based purification technologies.
Adsorbents Industry Segmentation:
IMARC Group provides an analysis of the key trends in each segment of the global adsorbents market report, along with forecasts at the global, regional and country levels from 2026-2034. Our report has categorized the market based on type and application.
Analysis by Type:
- Molecular Sieves
- Activated Carbon
- Silica Gel
- Activated Alumina
- Clay
- Others
Molecular sieves lead the market with around 27.6% of market share in 2025. Molecular sieves hold the largest share in the adsorbents market due to their superior adsorption capabilities, high selectivity, and wide industrial applications. Made from synthetic zeolites, they efficiently remove moisture, separate gases, and purify liquids in industries like oil & gas, petrochemicals, pharmaceuticals, and air separation. Their ability to operate under extreme conditions and offer precise molecular filtration makes them ideal for drying, refining, and gas purification processes. Additionally, molecular sieves have a longer lifespan and higher adsorption capacity compared to traditional adsorbents like activated carbon or silica gel, further driving their demand in industrial and environmental applications worldwide.
Analysis by Application:
Access the comprehensive market breakdown Request Sample
- Petroleum Refining
- Gas Refining
- Chemicals
- Water Treatment
- Air Separation and Dying
- Packaging
- Others
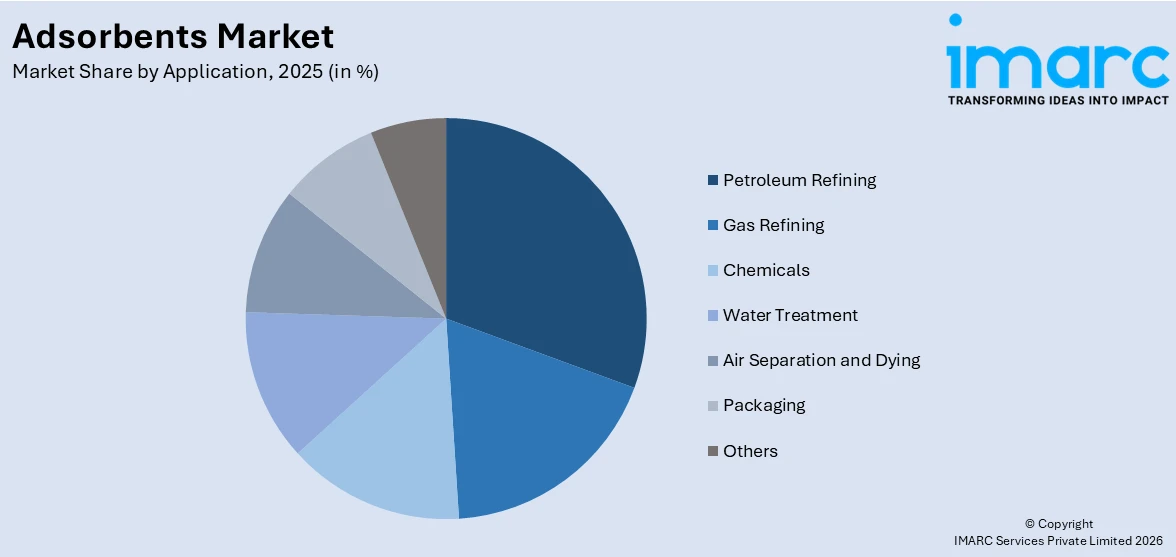
Petroleum refining leads the market with around 33.6% of the market share in 2025. Petroleum refining holds the largest share of the adsorbents market due to the high demand for adsorbents in processes like desulfurization, dehydration, and purification. Refining operations require adsorbents such as molecular sieves, activated alumina, and silica gel to remove impurities like sulfur compounds, water, and contaminants from crude oil and natural gas. Stringent environmental regulations on fuel quality and emissions drive the need for advanced adsorption technologies. Additionally, the expansion of refineries, increasing global energy demand, and rising investments in cleaner fuel production further boost adsorbent usage, making petroleum refining the dominant segment in the adsorbents market.
Regional Analysis:
To get more information on the regional analysis of this market Request Sample
- North America
- United States
- Canada
- Europe
- Germany
- France
- United Kingdom
- Italy
- Spain
- Russia
- Others
- Asia Pacific
- China
- Japan
- India
- South Korea
- Australia
- Indonesia
- Others
- Latin America
- Brazil
- Mexico
- Others
- Middle East and Africa
In 2025, Asia Pacific accounted for the largest market share of over 36.8%. The Asia Pacific adsorbents market is growing at a fast pace due to growing industrialization and urbanization. As per industrial reports, in 2022 China alone contributed close to 40% of the region's consumption of adsorbents, specifically in wastewater treatment and air filtration processes. India is increasingly investing in industrial pollution control using adsorbents. Growing demand for clean water, tougher environmental regulations, and energy-efficient solutions are driving market growth. Regional leading players, including Shandong Blue Sail and Calgon Carbon, are also looking to increase production capacity and launch new product lines. The industrial requirements and middle-class growth in the region are also increasing demand for niche adsorbents in industries such as automotive, food processing, and pharmaceuticals, making Asia Pacific a key market player on the global stage.
Key Regional Takeaways:
North America Adsorbents Market Analysis
The adsorbents market in North America is driven by stringent environmental regulations, increasing demand for water and air purification, and industrial growth. The U.S. Environmental Protection Agency (EPA) enforces strict emission and wastewater treatment policies, boosting the adoption of adsorbents in industries like oil & gas, chemicals, and pharmaceuticals. The expanding petrochemical sector, driven by shale gas exploration, further fuels the demand for efficient gas separation and purification solutions. Additionally, advancements in nanotechnology and bio-based adsorbents enhance performance and sustainability. Rising consumer awareness of clean air and water, along with growing applications in food processing and healthcare, strengthens market growth.
United States Adsorbents Market Analysis
In 2025, the United States accounted for over 85.80% of the adsorbents market in North America. The U.S. market for adsorbents is growing strongly, with each of the industries of water treatment, oil & gas, and pharmaceuticals demanding. U.S. activated carbon production totaled about 150,000 metric tons in 2022, and much of it was used for water and air treatment purposes, says a report by the U.S. Geological Survey (USGS). Galloping environmental issues and government-imposed regulations are compelling industries to implement adsorbent technologies to manage waste and control pollution. The expanding applications of adsorbents in air and water filtration, combined with an increasing need for sustainable products, is additionally driving market growth. Calgon Carbon and Chemviron are two prominent players in the industry with their sophisticated solutions addressing industrial requirements as well as environmental demands. Technological innovation in reusable adsorbents and green manufacturing techniques is driving competition, making the U.S. a major player in the global market for adsorbents.
Europe Adsorbents Market Analysis
European adsorbents are on the growth path, catalyzed by the rising application in industry as well as stringently enforced environment laws. To this effect, it is on record that environmental protection in Europe cost about €67 billion (USD 70.24 billion) for the year 2023, as per reports. This includes environmental investments in purification plants for both water and air as well as sewage treatment factories. Germany and France are among the countries that are at the forefront of using adsorbent materials for industrial waste treatment and carbon capture purposes. Within EU Green Deal programs, member nations are prioritizing upgrading air quality standards, increasing the demand for activated carbon even further. Also, the increasing trend of bio-based adsorbents is driving technological innovation, with firms such as Ingevity and Kuraray leading the way in developing more efficient and sustainable materials. Incentives backed by governments are speeding up R&D, guaranteeing Europe's leadership in determining the adsorbent market outlook.
Latin America Adsorbents Market Analysis
Latin America's adsorbents market is growing, especially in Brazil, with huge investment in water treatment and pollution management. According to industrial reports, in 2022, around 32 million individuals in Brazil did not have access to treated water, and 89 million did not have basic sewage collection. To meet these requirements, Brazil established a new legal system in 2020 that compels universal coverage of drinking water and sanitation by the year 2033. The initiative will cost a USD 168.7 billion investment, projected to give a USD 264.4 billion GDP growth by 2033. The initiatives involve an emphasis on water purification and sanitation, sectors where adsorbents such as activated carbon are crucial. Brazil has, in 2023, inaugurated the Sustainable Regional Infrastructure Development Fund that would facilitate faster public-private partnerships (PPPs) on water and sewage projects. With 48 large projects being structured, the use of adsorbents, particularly for water treatment and sewage will increase substantially. These investments are making Brazil a leader of adsorbent consumption in the region for environmental and industrial applications.
Middle East and Africa Adsorbents Market Analysis
The Middle East and African region is witnessing an increasing demand for adsorbents due to investment in water treatment and pollution control schemes. The government of Saudi Arabia has pledged a major investment of USD 4 billion into treated water reuse schemes with a view to augmenting the quantity of recycled water, as per reports. This move is within the country's wider efforts in facing water shortages as well as improving water management processes, even boosting the need for adsorbents, especially for water treatment and filtration use. The country is also witnessing investment in other sectors, including industrial and environmentalization, as this adds to the increasing demand for adsorbents. As countries emphasize pollution abatement and sustainability, the Middle East and African adsorbent market is ready to boom as a result of these strategic investments.
Competitive Landscape:
The adsorbents market is highly competitive, with key players focusing on innovation, sustainability, and cost-effective solutions. Major companies such as BASF SE, Arkema, Honeywell International, Clariant, and W.R. Grace dominate the market with advanced materials like activated carbon, silica gel, and zeolites. These firms invest in R&D to develop high-performance adsorbents for industries including oil & gas, water treatment, pharmaceuticals, and air purification. Competition is driven by stringent environmental regulations, technological advancements in nanomaterials, and increasing demand for efficient adsorption solutions. Strategic partnerships, mergers, and acquisitions further shape the market, as companies expand their global footprint and enhance product offerings.
The report provides a comprehensive analysis of the competitive landscape in the adsorbents market with detailed profiles of all major companies, including:
- Arkema S.A.
- Axens S.A.
- BASF SE
- Cabot Corporation
- Calgon Carbon Corporation
- Clariant AG
- Graver Technologies LLC (Marmon Industrial LLC)
- PQ Corporation (CPQ Midco I Corporation)
- W. R. Grace and Company
Latest News and Developments:
- February 2025: PQ and ADDITIVA Produtos Químicos have formed a partnership to distribute PQ's silica products, marketed as GASIL®, in Brazil. The collaboration leverages ADDITIVA's technical and commercial expertise to enhance PQ's presence in the Brazilian market, providing access to high-quality silicas for various industrial applications.
- January 2025: Calgon Carbon and American Water finalized a nine-year supply agreement to provide granular activated carbon, equipment, and reactivation services for PFAS treatment at over 50 American Water sites across 10 states. The partnership aims to meet U.S. EPA standards for PFAS while ensuring environmentally responsible, cost-effective water purification.
Adsorbents Market Report Scope:
| Report Features | Details |
|---|---|
| Base Year of the Analysis | 2025 |
| Historical Period | 2020-2025 |
| Forecast Period | 2026-2034 |
| Units | Billion USD |
| Scope of the Report |
Exploration of Historical Trends and Market Outlook, Industry Catalysts and Challenges, Segment-Wise Historical and Future Market Assessment:
|
| Types Covered | Molecular Sieves, Activated Carbon, Silica Gel, Activated Alumina, Clay, Others |
| Applications Covered | Petroleum Refining, Gas Refining, Chemicals, Water Treatment, Air Separation and Dying, Packaging, Others |
| Regions Covered | Asia Pacific, Europe, North America, Latin America, Middle East and Africa |
| Countries Covered | United States, Canada, Germany, France, United Kingdom, Italy, Spain, Russia, China, Japan, India, South Korea, Australia, Indonesia, Brazil, Mexico |
| Companies Covered | Arkema S.A., Axens S.A., BASF SE, Cabot Corporation, Calgon Carbon Corporation, Clariant AG, Graver Technologies LLC (Marmon Industrial LLC), PQ Corporation (CPQ Midco I Corporation) and W. R. Grace and Company |
| Customization Scope | 10% Free Customization |
| Post-Sale Analyst Support | 10-12 Weeks |
| Delivery Format | PDF and Excel through Email (We can also provide the editable version of the report in PPT/Word format on special request) |
Key Benefits for Stakeholders:
- IMARC’s industry report offers a comprehensive quantitative analysis of various market segments, historical and current market trends, market forecasts, and dynamics of the adsorbents market from 2020-2034.
- The research report provides the latest information on the market drivers, challenges, and opportunities in the global adsorbents market.
- The study maps the leading, as well as the fastest-growing, regional markets. It further enables stakeholders to identify the key country-level markets within each region.
- Porter's five forces analysis assists stakeholders in assessing the impact of new entrants, competitive rivalry, supplier power, buyer power, and the threat of substitution. It helps stakeholders to analyse the level of competition within the adsorbents industry and its attractiveness.
- The competitive landscape allows stakeholders to understand their competitive environment and provides insight into the current positions of key players in the market.
Frequently Asked Questions About the Adsorbents Market Report
The adsorbents market was valued at USD 5.3 Billion in 2025.
The adsorbents market is projected to exhibit a CAGR of 4.38% during 2026-2034, reaching a value of USD 7.9 Billion by 2034.
The market is driven by rising environmental regulations, increasing demand for water treatment and air purification, and expanding industrial applications in oil & gas, pharmaceuticals, and food processing. Technological advancements in nanomaterials, growing energy sector needs, and cost-effective, high-performance adsorption solutions further fuel market growth across various industries.
Asia Pacific currently dominates the adsorbents market, accounting for a share of 36.8%. Rapid industrialization, strict environmental regulations, water purification demand, oil & gas growth, pharmaceutical expansion, urbanization, economic development, and technological advancements are driving the market growth.
Some of the major players in the adsorbents market include Arkema S.A., Axens S.A., BASF SE, Cabot Corporation, Calgon Carbon Corporation, Clariant AG, Graver Technologies LLC (Marmon Industrial LLC), PQ Corporation (CPQ Midco I Corporation) and W. R. Grace and Company.
Need more help?
- Speak to our experienced analysts for insights on the current market scenarios.
- Include additional segments and countries to customize the report as per your requirement.
- Gain an unparalleled competitive advantage in your domain by understanding how to utilize the report and positively impacting your operations and revenue.
- For further assistance, please connect with our analysts.
 Request Customization
 Speak to an Analyst
 Request Brochure
 Inquire Before Buying
Benefits of Customization
- Personalize this research
- Triangulate with your data
- Get data as per your format and definition
- Gain a deeper dive into a specific application, geography, customer, or competitor
- Any level of personalization
Get in Touch With Us
UNITED STATES
Phone: +1-201-971-6302
INDIA
Phone: +91-120-433-0800
UNITED KINGDOM
Phone: +44-753-714-6104
Email: [email protected]
Client Testimonials


.webp)


