
Ammonia Prices, Trend, Chart, Demand, Market Analysis, News, Historical and Forecast Data Report 2026 Edition
Ammonia Price Trend, Index and Forecast
Track real-time and historical ammonia prices across global regions. Updated monthly with market insights, drivers, and forecasts.
Ammonia Prices July 2026
| Region | Price (USD/KG) | Latest Movement |
|---|---|---|
| Africa | 0.58 | -10.8% ↓ Down |
| Northeast Asia | 0.3 | -9.1% ↓ Down |
| Europe | 0.67 | -10.7% ↓ Down |
| South America | 0.67 | -6.9% ↓ Down |
| Middle East | 0.47 | -16.1% ↓ Down |
| North America | 0.59 | -11.9% ↓ Down |
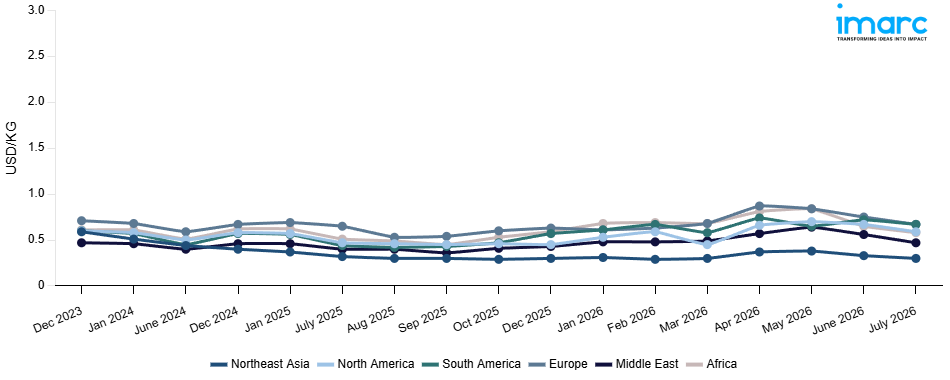
Ammonia Price Index (USD/KG):
The chart below highlights monthly ammonia prices across different regions.
Get Access to Monthly/Quarterly/Yearly Prices, Request Sample
Market Overview Q1 Ending March 2026
Africa: The ammonia prices in Africa reached 0.68 USD/KG in March 2026. The upward pricing movement registered between December and March 2026 was 15.3%. Strong demand from the fertilizer manufacturing, industrial chemical, and mining sectors drove robust ammonia procurement activity and reinforced bullish pricing conditions across African markets throughout the review period. Rising upstream natural gas feedstock costs at key producing nations elevated ammonia manufacturing expenses considerably and provided sustained upward support to prevailing regional market rates during the quarter. Constrained import cargo availability from Middle Eastern and Eastern European supplying regions tightened overall African supply conditions and intensified competition among downstream buyers for available volumes.
Northeast Asia: The ammonia prices in Northeast Asia reached 0.30 USD/KG in March 2026. The pricing movement between December and March 2026 remained unchanged. Steady demand from the fertilizer, chemical synthesis, and industrial manufacturing sectors maintained consistent ammonia procurement activity across Northeast Asian markets throughout the review period. Stable upstream natural gas and coal feedstock costs at regional production facilities sustained manufacturing expenses at existing levels and provided balanced support to prevailing regional market prices. Adequate domestic production from Chinese and regional ammonia manufacturing facilities maintained sufficient supply and prevented any significant directional movement in market prices.
Europe: The ammonia prices in Europe reached 0.68 USD/KG in March 2026. The upward pricing movement registered between December and March 2026 was 7.9%. Strong demand for ammonia from fertilizer, nitric acid, and specialty chemical production industries kept purchases strong and contributed to the bullish pricing environment in Europe during the review period. High natural gas prices, which serve as a raw material input to regional factories' production processes, led to higher production costs and maintained upward pressure on market prices in Europe during the quarter. Limited local supply amid seasonal plant maintenance helped sustain strong demand for ammonia from downstream buyers. Restocking by fertilizer and specialty chemical manufacturers amid anticipated seasonal demand increases further buttressed the bullish price environment.
South America: The ammonia prices in South America reached 0.58 USD/KG in March 2026. The upward pricing movement registered between December and March 2026 was 1.8%. Marginally firming demand from the agricultural fertilizer and industrial chemical manufacturing sectors provided modest procurement support and contributed to mildly bullish conditions across South American markets during the review period. Slightly elevated upstream natural gas feedstock costs at regional and importing production facilities placed incremental upward pressure on ammonia manufacturing expenses and supported the prevailing marginal price increase throughout the quarter. Steady import cargo availability from Middle Eastern and North American supplying regions maintained adequate supply conditions and limited the extent of upward price movement during the period.
Middle East: The ammonia prices in the Middle East reached 0.49 USD/KG in March 2026. The upward pricing movement registered between December and March 2026 was 14.0%. The active importation of ammonia from Middle Eastern suppliers to meet strong demand from Asian and African importers was instrumental in driving consistent upward price pressures in the region during the review period. The increase in the cost of natural gas, a raw material for the production process, led to a surge in manufacturing costs. The tight supply situation in the region, driven by high export volumes and strong demand from the local fertilizer production sector, generated strong bullish sentiment during the review period.
North America: The ammonia prices in North America reached 0.45 USD/KG in March 2026. The pricing movement between December and March 2026 remained unchanged. Steady demand from the agricultural fertilizer blending, industrial chemical, and mining sectors maintained consistent ammonia procurement activity across North American markets throughout the review period. Stable upstream natural gas feedstock costs at domestic production facilities sustained manufacturing expenses at existing levels and provided balanced support to prevailing regional market prices. Adequate domestic ammonia production output from Gulf Coast and Midwest manufacturing facilities maintained sufficient supply conditions and prevented any notable directional movement in regional price levels.
Market Overview Q4 Ending December 2025
Africa: The ammonia prices in Africa reached 0.59 USD/KG in December 2025. The upward pricing movement registered between September and December 2025 was 31.6%. The substantial price surge was primarily driven by severely tightened supply conditions resulting from reduced domestic production output and constrained import availability, significantly limiting regional volumes. Robust demand from the fertilizer blending and industrial chemical sectors intensified procurement competition amid critically limited spot market availability. Escalating upstream natural gas feedstock costs further elevated production expenses for regional manufacturers.
Northeast Asia: The ammonia prices in Northeast Asia reached 0.30 USD/KG in December 2025. The upward pricing movement between September and December 2025 was 1.2%. With consistent demand from the urea, ammonium nitrate, and caprolactam manufacturing sectors, and with baseline procurement activity maintained throughout the quarter, the marginal price increase reflected a generally stable market environment. Additional pricing assistance for regional producers was given by stable upstream feedstock costs for coal gasification and natural gas. Major synthesis facilities’ controlled manufacturing output prevented excess market availability by maintaining balanced supply demand dynamics.
Europe: The ammonia prices in Europe reached 0.63 USD/KG in December 2025. The upward pricing movement registered between September and December 2025 was 17.5%. The notable price appreciation was primarily driven by escalating natural gas feedstock costs across the region, which significantly elevated production expenses for domestic ammonia manufacturers operating energy intensive Haber Bosch synthesis processes. Tightened supply conditions, driven by reduced plant operating rates due to unfavorable energy economics, further constrained regional availability. Sustained demand from the fertilizer, explosives, and industrial chemical sectors maintained robust procurement activity throughout the quarter.
South America: The ammonia prices in South America reached 0.57 USD/KG in December 2025. The upward pricing movement registered between September and December 2025 was 33.3%. The extraordinary price surge was driven by acute supply tightness stemming from constrained domestic production capacity and severely reduced import availability, which critically limited regional volumes. Robust demand from the fertilizer manufacturing and agricultural chemical sectors intensified procurement competition amid expanding crop cultivation activity across the region. Rising upstream natural gas feedstock costs further elevated production expenses for regional manufacturers.
Middle East: The ammonia prices in the Middle East reached 0.43 USD/KG in December 2025. The upward pricing movement registered between September and December 2025 was 20.2%. Firm export demand from conventional importing destinations, which increased procurement activity amid tightening global supply conditions, was the driving force behind the notable price appreciation. Despite previously competitive energy pricing advantages, regional firms' production costs increased due to rising upstream natural gas feedstock costs. Available export volumes were further constrained by tighter supply conditions resulting from planned maintenance turnarounds at key synthesis facilities.
North America: The ammonia prices in North America reached 0.45 USD/KG in December 2025. The downward pricing movement registered between September and December 2025 was 0.4%. The negligible price decline reflected a predominantly stable market environment, with moderate demand from the fertilizer, explosives, and industrial chemical sectors sustaining consistent procurement volumes throughout the quarter. Abundant domestic natural gas availability maintained competitive feedstock costs for regional producers, while adequate production capacity ensured comfortable supply levels across the distribution network. Steady consumption from the ammonium nitrate and urea manufacturing segments sustained baseline offtake fundamentals, while balanced inventory positions among key distributors limited significant pricing fluctuation.
Market Overview Q3 Ending September 2025
Africa: In Africa, ammonia prices declined sharply as weaker demand from fertilizer producers and the mining sector constrained market activity. The ammonia price index reflected bearish sentiment, compounded by sufficient natural gas availability keeping production costs stable. Export opportunities also softened, with global buyers favoring competitively priced material from other regions. Overall, abundant supply and reduced industrial offtake drove the downward trend across the region this quarter.
Northeast Asia: In Northeast Asia, ammonia prices slipped due to oversupply conditions and subdued consumption from downstream fertilizers and chemicals. The ammonia price index indicated mild bearish momentum, supported by steady natural gas feedstock availability and stable production levels. Export demand remained muted as competing regions offered more attractive pricing. Limited recovery from industrial applications kept procurement weak, leaving the market in a cautious position.
Europe: In Europe, ammonia prices rose slightly as firm demand from fertilizer and industrial chemicals sectors supported procurement. The ammonia price index reflected modest bullish momentum, aided by supply constraints from select production facilities undergoing maintenance. Higher energy costs also contributed to upward pressure on domestic production economics. Buyers remained cautious, but steady consumption trends in agriculture and chemicals underpinned the regional market outlook.
South America: In South America, ammonia prices edged higher as resilient demand from agriculture, particularly fertilizers, provided market support. The ammonia price index trended upward, with seasonal consumption boosting procurement levels. While feedstock costs remained stable, localized supply limitations in certain markets helped sustain the modest upward momentum. Sentiment stayed cautiously optimistic, with expectations of steady demand in the near term.
Middle East: In the Middle East, ammonia prices fell steeply as subdued fertilizer demand and oversupply conditions weighed on the market. The ammonia price index dropped as robust natural gas availability kept production abundant, outpacing regional consumption. Export opportunities were limited, with competitive supply from Asia and the Americas adding pressure. Market participants adopted a cautious approach, keeping offtake restricted amid bearish sentiment.
North America: In North America, ammonia prices eased as weaker consumption from agriculture and industrial chemicals reduced buying momentum. The ammonia price index showed mild downward pressure, despite steady production from domestic facilities. Competitive imports also challenged local producers, further softening sentiment. While industrial demand held relatively steady, reduced seasonal fertilizer requirements contributed to the overall price decline during the quarter.
Ammonia Price Trend, Market Analysis, and News
IMARC's latest publication, “Ammonia Prices, Trend, Chart, Demand, Market Analysis, News, Historical and Forecast Data Report 2026 Edition,” presents a detailed examination of the ammonia market, providing insights into both global and regional trends that are shaping prices. This report delves into the spot price of ammonia at major ports and analyzes the composition of prices, including FOB and CIF terms. It also presents detailed ammonia prices trend analysis by region, covering North America, Europe, Asia Pacific, Latin America, and Middle East and Africa. The factors affecting ammonia pricing, such as the dynamics of supply and demand, geopolitical influences, and sector-specific developments, are thoroughly explored. This comprehensive report helps stakeholders stay informed with the latest market news, regulatory updates, and technological progress, facilitating informed strategic decision-making and forecasting.
.webp)
Ammonia Industry Analysis
The global ammonia industry size reached USD 86.9 Billion in 2025. By 2034, IMARC Group expects the market to reach USD 128.0 Billion, at a projected CAGR of 4.18% during 2026-2034. Growth is primarily driven by rising demand for fertilizers to support global agriculture, expanding use in industrial chemicals such as nitric acid and urea, and increasing application in refrigeration, textiles, and emerging hydrogen energy solutions.
Latest developments in the Ammonia Industry:
- September 2025: Hanwha Power Systems received Approval in Principle (AiP) from the American Bureau of Shipping for a retrofit design converting 174,000 m³ LNG carriers to ammonia-fuel gas turbines. This design operates on 100% ammonia without pilot oil in small quantities.
- June 2025: India-headquartered hydrogen company Hygenco Green Energies inaugurated a green ammonia production facility at Gopalpur Industrial Park in Odisha, with plans to scale up to an annual capacity of 1.1 Million Tonnes. The project follows the company’s earlier commissioning of a commercial-scale green hydrogen plant in Hisar, reflecting its strategic commitment to expanding clean energy infrastructure. For this initiative, Hygenco has partnered with Denmark-based Topsoe as the technology licensor, integrating advanced green ammonia synthesis technologies to support India’s decarbonization goals.
- April 2025: CF Industries formed a joint venture with JERA Co., Inc. and Mitsui & Co., Ltd. to build a USD 4 billion low-carbon (“blue”) ammonia production facility at its Blue Point Complex in Louisiana. The plant is expected to have annual capacity of ~1.4 million metric tons of ammonia and will include CO₂ capture, compression, and sequestration, with production slated to begin in 2029.
Product Description
Ammonia (NH₃) is a colorless gas with a pungent odor, composed of nitrogen and hydrogen. It is primarily produced via the Haber-Bosch process, combining nitrogen from the air with hydrogen derived from natural gas. Ammonia is highly soluble in water and plays a vital role in global agriculture as a feedstock for nitrogen-based fertilizers, including urea, ammonium nitrate, and ammonium sulfate. It is also used in the manufacture of industrial chemicals, explosives, and textiles, as well as in refrigeration systems as a refrigerant. With its versatility across agricultural, industrial, and energy sectors, ammonia remains a cornerstone chemical in global supply chains.
Report Coverage
| Key Attributes | Details |
|---|---|
| Product Name | Ammonia |
| Report Features | Exploration of Historical Trends and Market Outlook, Industry Demand, Industry Supply, Gap Analysis, Challenges, Ammonia Price Analysis, and Segment-Wise Assessment. |
| Currency/Units | US$ (Data can also be provided in local currency) or Metric Tons |
| Region/Countries Covered | The current coverage includes analysis at the global and regional levels only. Based on your requirements, we can also customize the report and provide specific information for the following countries: Asia Pacific: China, India, Indonesia, Pakistan, Bangladesh, Japan, Philippines, Vietnam, Thailand, South Korea, Malaysia, Nepal, Taiwan, Sri Lanka, Hongkong, Singapore, Australia, and New Zealand Europe: Germany, France, United Kingdom, Italy, Spain, Russia, Turkey, Netherlands, Poland, Sweden, Belgium, Austria, Ireland, Switzerland, Norway, Denmark, Romania, Finland, Czech Republic, Portugal and Greece North America: United States and Canada Middle East & Africa: Saudi Arabia, UAE, Israel, Iran, South Africa, Nigeria, Oman, Kuwait, Qatar, Iraq, Egypt, Algeria, and Morocco Latin America: Brazil, Mexico, Argentina, Columbia, Chile, Ecuador, Peru The list of countries presented is not exhaustive. Information on additional countries can be provided if required by the client. |
| Information Covered for Key Suppliers |
|
| Customization Scope | The report can be customized as per the requirements of the customer |
| Report Price and Purchase Option |
Plan A: Monthly Updates - Annual Subscription
Plan B: Quarterly Updates - Annual Subscription
Plan C: Biannually Updates - Annual Subscription
|
| Post-Sale Analyst Support | 360-degree analyst support after report delivery |
| Delivery Format | PDF and Excel through email (We can also provide the editable version of the report in PPT/Word format on special request) |
Key Benefits for Stakeholders:
- IMARC’s report presents a detailed analysis of ammonia pricing, covering global and regional trends, spot prices at key ports, and a breakdown of FOB and CIF prices.
- The study examines factors affecting ammonia price trend, including input costs, supply-demand shifts, and geopolitical impacts, offering insights for informed decision-making.
- The competitive landscape review equips stakeholders with crucial insights into the latest market news, regulatory changes, and technological advancements, ensuring a well-rounded, strategic overview for forecasting and planning.
- IMARC offers various subscription options, including monthly, quarterly, and biannual updates, allowing clients to stay informed with the latest market trends, ongoing developments, and comprehensive market insights. The ammonia price charts ensure our clients remain at the forefront of the industry.
Frequently Asked Questions About the Ammonia Price Index Report
The ammonia prices in July 2026 were 0.58 USD/Kg in Africa, 0.3 USD/Kg in Northeast Asia, 0.67 USD/Kg in Europe, 0.67 USD/Kg in South America, 0.47 USD/Kg in Middle East, and 0.59 USD/Kg in North America.
The ammonia pricing data is updated on a monthly basis.
We provide the pricing data primarily in the form of an Excel sheet and a PDF.
Yes, our report includes a forecast for ammonia prices.
The regions covered include North America, Europe, Asia Pacific, Middle East, and Latin America. Countries can be customized based on the request (additional charges may be applicable).
Yes, we provide both FOB and CIF prices in our report.
Need more help?
- Speak to our experienced analysts for insights on the current market scenarios.
- Include additional segments and countries to customize the report as per your requirement.
- Gain an unparalleled competitive advantage in your domain by understanding how to utilize the report and positively impacting your operations and revenue.
- For further assistance, please connect with our analysts.
 Request Customization
 Inquire Before Buying
 Speak to an Analyst
 Request Brochure
Benefits of Customization
- Personalize this research
- Triangulate with your data
- Get data as per your format and definition
- Gain a deeper dive into a specific application, geography, customer, or competitor
- Any level of personalization
Get in Touch With Us
UNITED STATES
Phone: +1-201-971-6302
INDIA
Phone: +91-120-433-0800
UNITED KINGDOM
Phone: +44-753-714-6104
Email: [email protected]
Client Testimonials


.webp)


Why Choose Us
IMARC offers trustworthy, data-centric insights into commodity pricing and evolving market trends, enabling businesses to make well-informed decisions in areas such as procurement, strategic planning, and investments. With in-depth knowledge spanning more than 1000 commodities and a vast global presence in over 150 countries, we provide tailored, actionable intelligence designed to meet the specific needs of diverse industries and markets.
1000
+Commodities
150
+Countries Covered
3000
+Clients
20
+Industry
Robust Methodologies & Extensive Resources
IMARC delivers precise commodity pricing insights using proven methodologies and a wealth of data to support strategic decision-making.
Subscription-Based Databases
Our extensive databases provide detailed commodity pricing, import-export trade statistics, and shipment-level tracking for comprehensive market analysis.
Primary Research-Driven Insights
Through direct supplier surveys and expert interviews, we gather real-time market data to enhance pricing accuracy and trend forecasting.
Extensive Secondary Research
We analyze industry reports, trade publications, and market studies to offer tailored intelligence and actionable commodity market insights.
Trusted by 3000+ industry leaders worldwide to drive data-backed decisions. From global manufacturers to government agencies, our clients rely on us for accurate pricing, deep market intelligence, and forward-looking insights.