
Amusement Parks Market Size, Share, Trends and Forecast by Rides, Revenue Source, Age Group, and Region, 2026-2034
Amusement Parks Market Size, Share, Trends & Forecast (2026-2034)
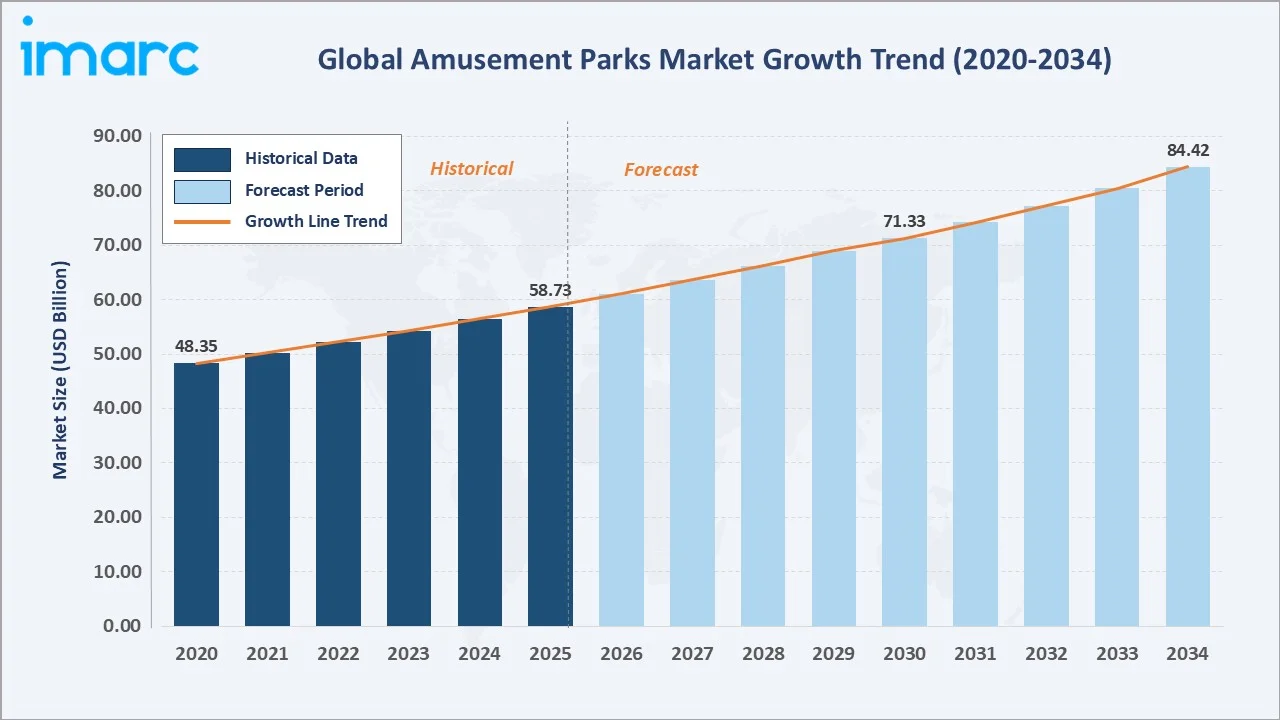
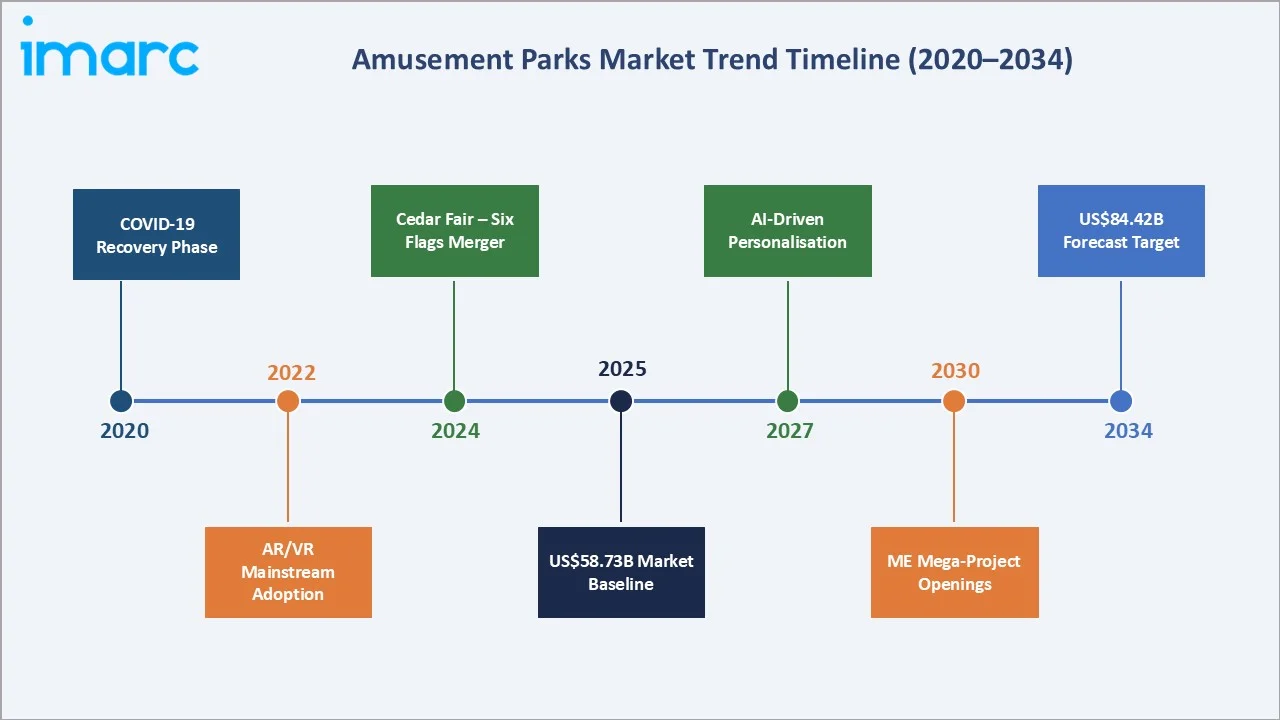
The global amusement parks market size was valued at USD 58.73 Billion in 2025 and is projected to reach USD 84.42 Billion by 2034, exhibiting a CAGR of 3.96% during the forecast period 2026-2034. The market is powered by robust global tourism growth, rising middle-class disposable incomes, and an accelerating wave of technology-driven experiences including augmented reality (AR), virtual reality (VR), and animatronics-enhanced attractions.
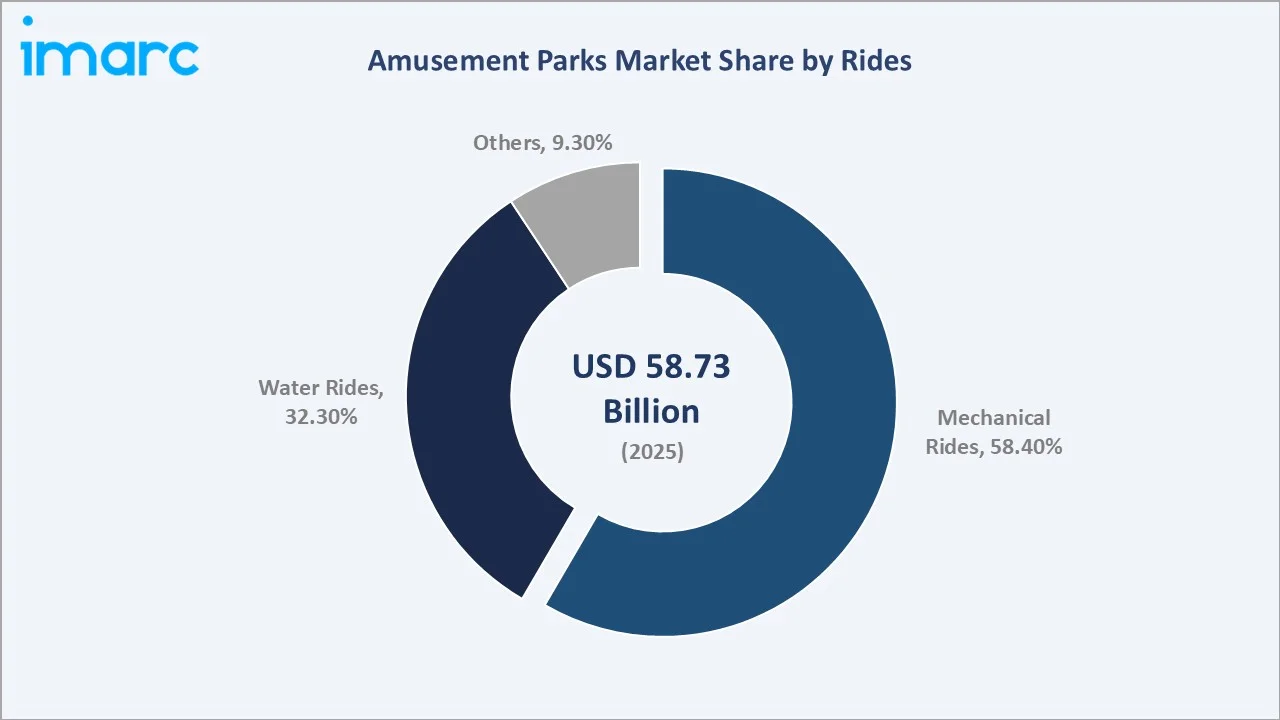
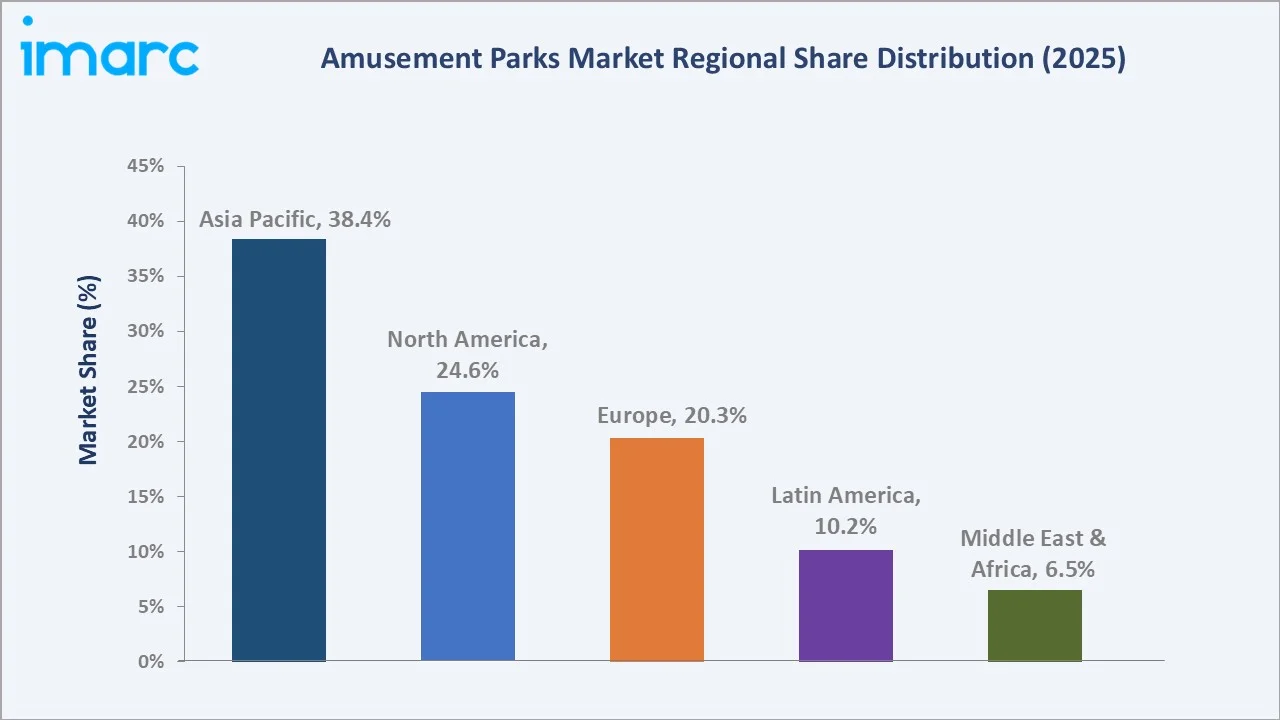
Mechanical rides dominate the rides segment at 58.4% in 2025, while Ticket Sales remain the primary revenue source at 42.6%. Asia Pacific commands the largest regional share at 38.4%, underpinned by massive greenfield park development in China, India, and Southeast Asia.
Market Snapshot
|
Metric |
Value |
|
Market Size 2025 |
USD 58.73 Billion |
|
Forecast Market Size 2034 |
USD 84.42 Billion |
|
CAGR (2026-2034) |
3.96% |
|
Base Year |
2025 |
|
Historical Period |
2020-2025 |
|
Forecast Period |
2026-2034 |
|
Largest Region |
Asia Pacific (38.4% share, 2025) |
|
Fastest Growing Region |
Asia Pacific |
|
Leading Rides Segment |
Mechanical Rides (58.4%, 2025) |
|
Leading Revenue Source |
Ticket Sales (42.6%, 2025) |
To get more information on this market, Request Sample
Executive Summary
The global amusement parks industry is entering a sustained growth phase driven by tourism recovery, immersive technology adoption, and an expanding base of family-oriented consumers across emerging markets. Valued at USD 58.73 Billion in 2025, the market is forecast to reach USD 84.42 Billion by 2034 at a CAGR of 3.96%. This trajectory reflects both the resilience of established parks in North America and Europe and the remarkable greenfield expansion underway in Asia Pacific, the Middle East, and Latin America.
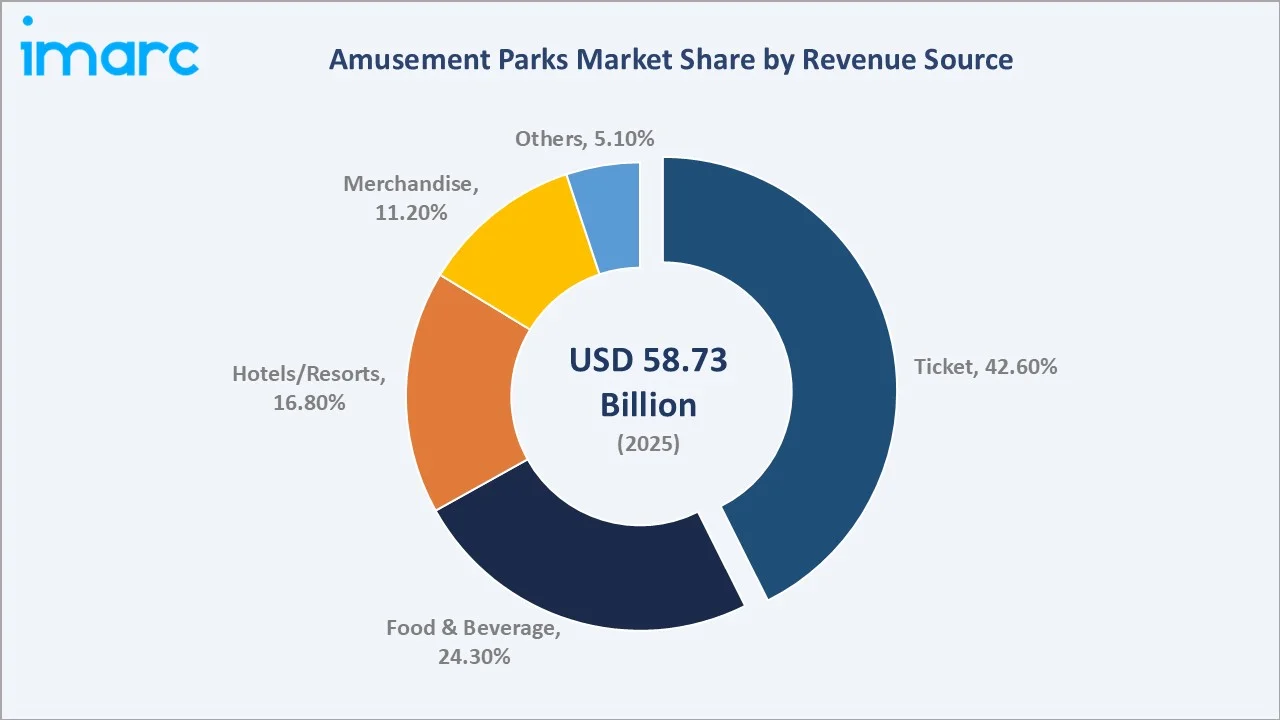
Ticket revenues account for 42.6% of total market revenue in 2025, underscoring the continued dominance of gate admission as the core monetization model. However, ancillary revenue streams are growing rapidly. Food and Beverage contributes 24.3%, Hotels and Resorts 16.8%, and Merchandise 11.2%, signaling a structural shift toward integrated destination resort models where visitors generate multi-day spending across the full park ecosystem.
Mechanical Rides command 58.4% of the rides segment, supported by sustained consumer appetite for high-thrill roller coasters, dark rides, and immersive themed attractions. Water Rides hold a 32.3% share and are growing fastest in climate-suitable regions. Asia Pacific leads with a 38.4% global revenue share, fueled by China's Chimelong and Fantawild expansions, Japan's Universal Studios Japan, and India's emerging amusement infrastructure.
Key Market Insights
|
Insight |
Data |
|
Largest Rides Segment |
Mechanical Rides – 58.4% (2025) |
|
Second Rides Segment |
Water Rides – 32.3% (2025) |
|
Largest Revenue Source |
Ticket Sales – 42.6% (2025) |
|
Fastest-Growing Rev. Source |
Hotels/Resorts – 16.8%, rising with resort-park models |
|
Leading Region |
Asia Pacific – 38.4% revenue share (2025) |
|
Top Companies |
Walt Disney, Merlin, Cedar Fair, SeaWorld, Comcast |
|
Market Opportunity |
AR/VR integration & luxury park resort expansions |
Key Analytical Observations Supporting the Above Data:
- Mechanical Rides' 58.4% dominance in 2025 reflects sustained consumer demand for high-adrenaline experiences, with record-breaking roller coasters serving as signature anchor attractions for parks across all geographies.
- Water Rides at 32.3% are expanding fastest in the Middle East and Southeast Asia, where hot climates and luxury resort park models create natural demand for waterpark integration within larger mixed-use entertainment resorts.
- Ticket revenue at 42.6% remains dominant but is under structural pressure as leading operators adopt dynamic and tiered pricing strategies – The price of a day ticket for the Disney World park in Orlando ranges from $109 to $159 depending on the time of year.
- Hotels and Resorts revenue at 16.8% is the fastest-growing ancillary segment as operators pursue the integrated destination resort model, maximizing length of stay and per-visitor spend beyond the park gate.
- Asia Pacific's 38.4% share reflects a dual growth engine: China's private operators building national-scale networks while international operators including Universal, Disney, and Merlin simultaneously expand their Asian footprints.
- The Middle East and Africa's 6.5% share belies its growth velocity, with Saudi Arabia's entertainment program targeting USD 64 Billion in investment by 2030.
Global Amusement Parks Market Overview
Amusement parks are commercially operated recreational destinations offering a curated portfolio of rides, entertainment, food and beverage, hospitality, and retail experiences within a themed or branded environment. They range from single-day regional attraction parks to multi-day integrated resort destinations anchored by intellectual property (IP) licensing from entertainment franchises.
The market ecosystem spans ride design and manufacturing, infrastructure construction, technology integration (AR/VR, animatronics, IoT), park operations, hospitality management, and IP licensing. Macroeconomic catalysts include global international tourist arrivals surpassing 1.4 Billion by 2024 (UNWTO estimates), rising household discretionary expenditure in Asia and Latin America, and urban entertainment complex development driven by government tourism mandates in the Middle East and Southeast Asia.
Market Dynamics
To evaluate market opportunities, Request Sampl
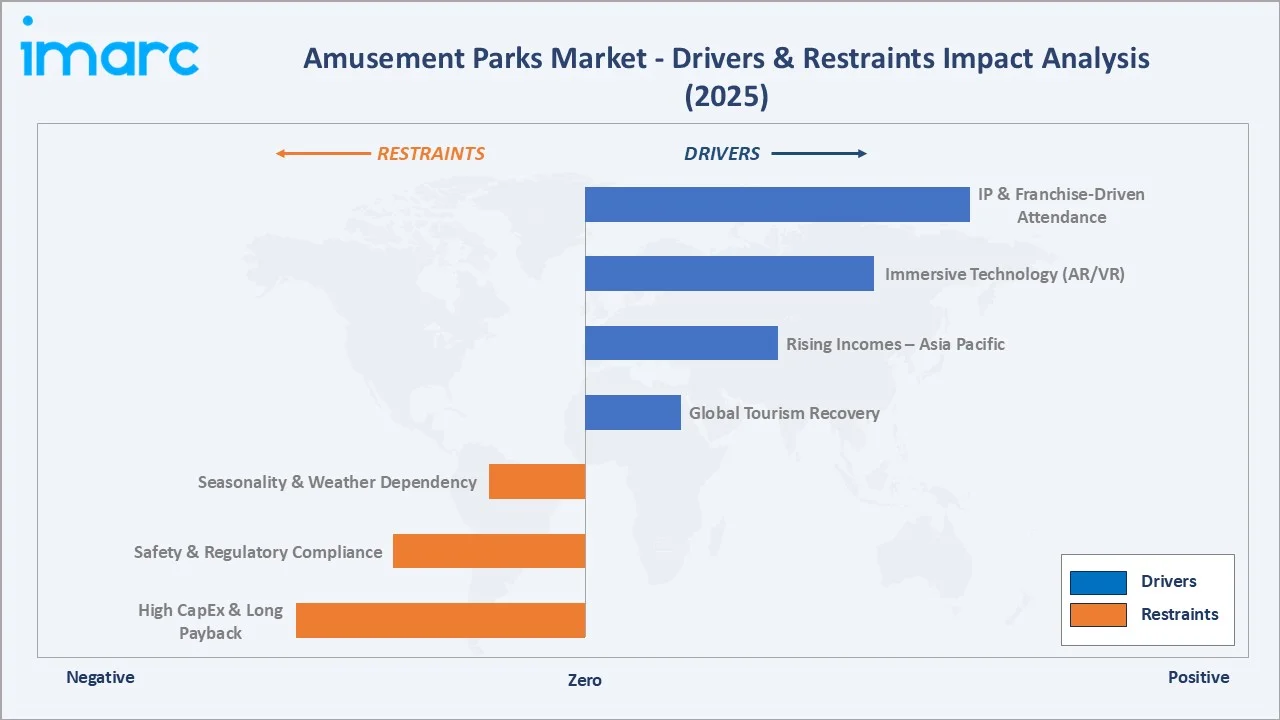
Market Drivers
- Tourism Recovery and Rising Global Travel: International tourist arrivals reached approximately 1.4 billion in 2024, representing 99% recovery to pre-pandemic levels, according to UN Tourism (UNWTO), with continued growth expected in the coming years. Additionally, the U.S. Travel Association reported domestic leisure travel spending of approximately USD 876 Billion in 2024, supporting strong North American amusement park attendance and visitor demand.
- Rising Disposable Incomes in Emerging Markets: Asia Pacific continues to experience rapid middle-class expansion, with nearly 1 billion new middle-class consumers expected globally by 2030, led largely by South and Southeast Asia, according to Brookings Institution. India remains a key contributor, driven by rising income levels, urbanization, and increasing discretionary spending on leisure and entertainment.
- Immersive Technology Integration: The deployment of AR/VR attractions, 4D cinematic experiences, animatronics, and IoT-enabled personalized park navigation apps is enhancing visitor engagement, increasing dwell time, and boosting in-park spending. Major operators such as Disney and Universal are investing heavily in immersive lands, interactive gaming zones, and app-based personalization to drive higher per-visitor monetization and repeat visitation.
- IP and Franchise-Driven Attendance: Strong intellectual property ecosystems from Disney, Universal, and Warner Bros. continue to drive visitation and monetization. Disney’s Parks, Experiences and Products segment generated approximately USD 34.2 Billion in revenue in fiscal year 2024, highlighting the strong revenue-generating potential of IP-driven theme park experiences.
Market Restraints
- High Capital Expenditure and Long Payback Periods: Large-scale destination theme parks typically require USD 2–5 billion in initial investment, with mega-projects such as new Disney or Universal parks sometimes exceeding USD 5–10 billion. These projects generally have long payback periods of 10–20 years, creating substantial barriers to entry and limiting expansion speed even for established operators.
- Safety and Regulatory Compliance: Theme Park operators face stringent safety standards, including daily ride inspections, maintenance protocols, and regulatory oversight. Although serious incidents are rare, high-profile accidents can lead to ride shutdowns, reputational damage, legal exposure, and increased regulatory scrutiny, making safety compliance a critical operational priority across global markets.
- Seasonal and Weather Dependency: Theme parks, particularly outdoor parks in North America and Europe, experience strong seasonal demand concentrated in peak summer months and holiday periods. Attendance is typically concentrated within 90–120 peak operating days annually, and adverse weather during these peak periods can significantly impact attendance, revenue, and profitability.
Market Opportunities
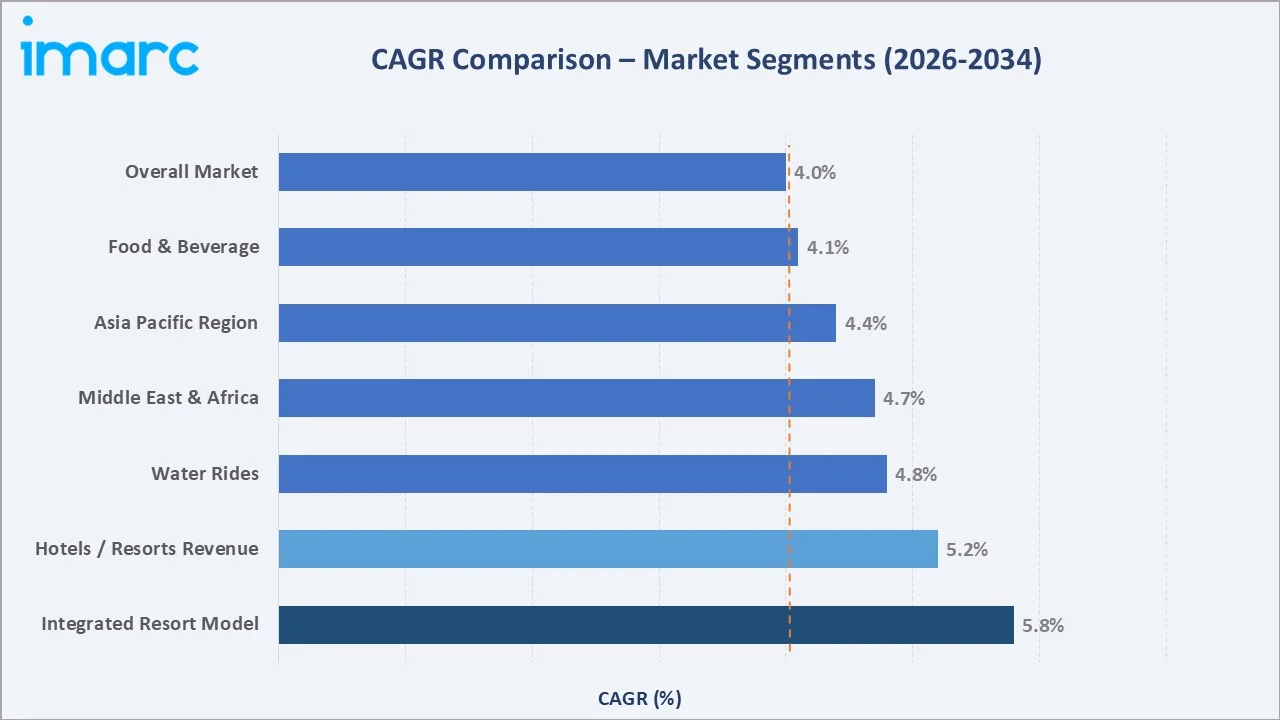
- Integrated Resort Development: The convergence of amusement parks with hotels, retail, convention centers, and entertainment districts is creating high-value destination resort models. For example, Resorts World Sentosa (Singapore) reported approximately USD 2.4 billion annual revenue in recent years, driven by gaming, hotels, attractions, and F&B operations, demonstrating the revenue potential of integrated ecosystems.
- Middle East Entertainment Mega-Projects: Saudi Arabia’s Vision 2030 strategy is accelerating large-scale entertainment investments, including Qiddiya (~USD 40 billion) and NEOM (~USD 500 billion long-term development). These giga-projects include theme parks, entertainment districts, and tourism infrastructure that will significantly expand regional amusement park capacity
- Digital Monetization and Personalization: Theme park operators are increasingly using mobile apps, wearable devices, and AI-driven personalization to enhance guest experiences and drive incremental revenue. Disney’s MagicBand and MyMagic+ ecosystem enables seamless payments, personalized experiences, and data-driven upselling, which has been linked to longer stays, higher guest satisfaction, and increased in-park spending.
Market Challenges
- Competition from Home and Digital Entertainment: The rapid growth of streaming platforms, gaming, and immersive at-home entertainment continues to compete for consumer leisure time and discretionary spending. The global gaming market alone exceeded USD 180 billion in 2023, highlighting strong competition for entertainment spending. As a result, amusement park operators must continuously invest in new rides, themed attractions, and immersive experiences to sustain visitation frequency and guest engagement.
- Labor and Operating Cost Inflation: Amusement parks are highly labor-intensive businesses requiring large seasonal and full-time workforces. Rising minimum wages and labor shortages in the U.S., UK, and Europe have increased staffing and operational costs. Major operators such as Disney and Six Flags have reported margin pressure from wage inflation, with theme park operating margins typically ranging between 15–30% depending on scale and seasonality, leading to profitability pressure during cost inflation periods..
Emerging Market Trends
1. Immersive Technology and the Experiential Revolution
Augmented reality (AR), virtual reality (VR), projection mapping, and AI-driven interactive storytelling are increasingly redefining theme park experiences. Studies show immersive technologies enhance visitor engagement, satisfaction, and revisit intention, with VR-based attractions significantly improving overall visitor experience and behavioral intent compared to traditional rides. Major operators such as Disney and Universal continue to invest heavily in immersive IP-based attractions and interactive environments to boost guest engagement and repeat visitation.
2. Integrated Destination Resort Model
Leading operators are transitioning from single-day parks to multi-day destination resorts combining hotels, retail, and entertainment districts. The TEA/AECOM Theme Index notes that operators investing in resort-style expansions reported higher per-capita spending and multiple transactions per visitor. Disney, Universal, and regional developers increasingly focus on integrated resort ecosystems to extend visitor stay duration and increase total revenue per guest.
3. Sustainability and Eco-Themed Park Concepts
Environmental sustainability is becoming a key strategic differentiator in the amusement park industry. SeaWorld has committed to conservation initiatives including marine ecosystem restoration and reduction of single-use plastics across parks. Similarly, Merlin Entertainments has introduced a 2030 sustainability and carbon-reduction strategy focused on energy efficiency, waste reduction, and conservation projects across global attractions.
4. Dynamic Pricing and Revenue Optimization
Theme Park operators are increasingly adopting dynamic pricing models like airlines and hotels. Disney has introduced demand-based ticket pricing across multiple parks, where prices fluctuate based on seasonality and demand. This strategy improves crowd management and enhances revenue optimization, with date-based pricing already implemented in Disneyland Paris and planned expansion across U.S. parks.
5. Expansion in Asia Pacific and the Middle East
Asia Pacific continues to emerge as the fastest-growing amusement park region, supported by strong development activity in China and rising tourism demand across emerging Asian economies. Meanwhile, the Middle East is becoming a key investment hub, with major projects including Disney’s planned Abu Dhabi theme park and multiple attractions under development in Saudi Arabia’s Qiddiya entertainment city.
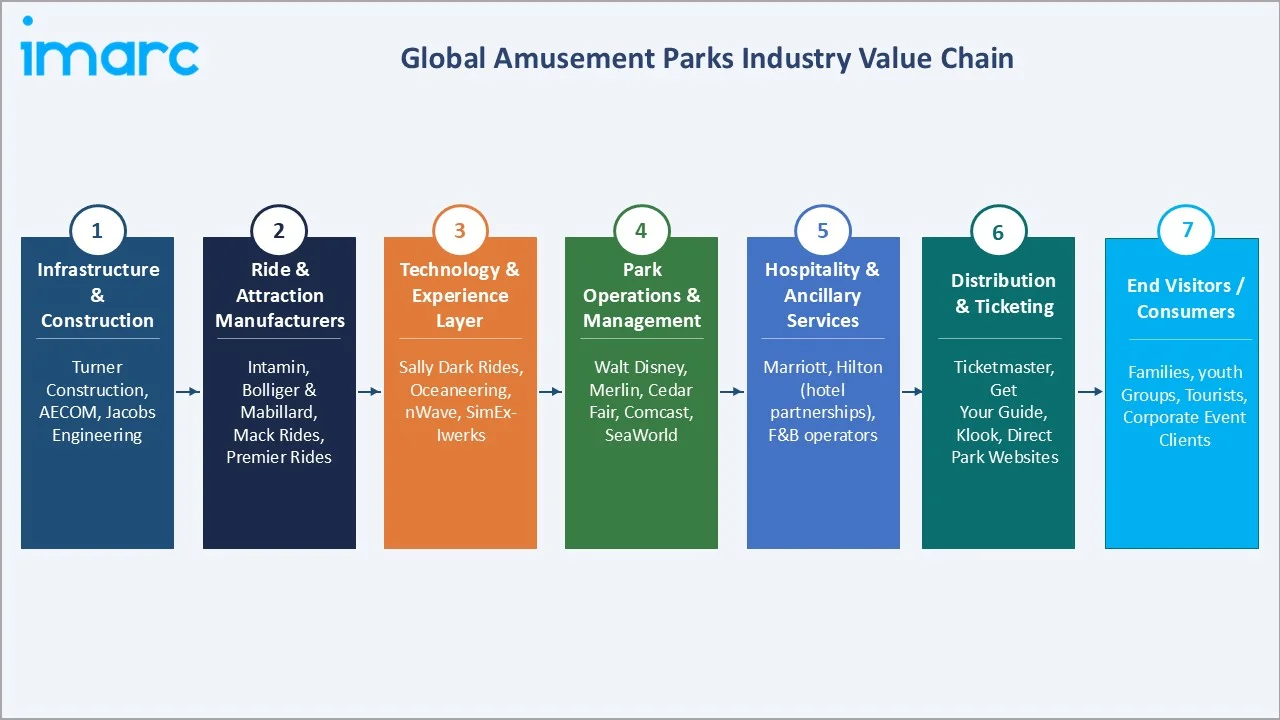
Industry Value Chain Analysis
The amusement parks value chain spans seven integrated stages from infrastructure design through end-visitor engagement. Each stage presents distinct competitive dynamics, specialized expertise requirements, and investment profiles.
|
Stage |
Key Players / Examples |
|
Infrastructure & Construction |
Turner Construction, AECOM, Jacobs Engineering |
|
Ride & Attraction Manufacturers |
Intamin, Bolliger & Mabillard, Mack Rides, Premier Rides |
|
Technology & Experience Layer |
Sally Dark Rides, Oceaneering, nWave, SimEx-Iwerks |
|
Park Operations & Management |
Walt Disney, Merlin, Cedar Fair, Comcast, SeaWorld |
|
Hospitality & Ancillary Services |
Marriott, Hilton (hotel partnerships), F&B operators |
|
Distribution & Ticketing |
Ticketmaster, GetYourGuide, Klook, direct park websites |
|
End Visitors / Consumers |
Families, youth groups, tourists, corporate event clients |
Technology Landscape in the Amusement Parks Industry
Technology is the foremost differentiator in the modern amusement parks competitive landscape. The sector is undergoing a multi-dimensional transformation across ride engineering, visitor personalization, operational efficiency, and immersive experience creation.
Ride Engineering and Simulation
Advanced ride engineering is enabling faster and more immersive attractions through hydraulic and electromagnetic launch systems. For instance, Formula Rossa accelerates from 0–100 km/h in about two seconds. Multi-axis motion platforms combined with projection and physical effects are also expanding, with manufacturers like Bolliger & Mabillard and Intamin leading innovation.
AR/VR and Immersive Experience Technologies
AR and VR technologies are increasingly integrated into attractions to enhance storytelling and immersion. Rides such as Transformers and Spider-Man combine motion vehicles with large-scale projection systems. Parks in Europe and Asia are also piloting wearable and interactive AR experiences, reflecting growing investment in immersive entertainment technologies.
IoT and Smart Park Operations
IoT ecosystems increasingly support digital twin technology for ride monitoring, predictive maintenance, and operational planning. Disney has implemented digital twins for advanced attractions, while parks deploy AI-based crowd analytics and smart queue systems. Mobile apps and wearable technologies are becoming central interfaces for navigation, reservations, and virtual queuing.
Digital Ticketing and Personalization Platforms
Mobile ticketing, contactless entry, and app-based reservations are transforming guest engagement. Operators increasingly use digital platforms for virtual queues, mobile ordering, and personalized recommendations. These technologies help parks improve capacity utilization, enhance guest convenience, and increase in-park spending opportunities.
Market Segmentation Analysis
The report covers the following segments:
|
Segment Category |
Leading Segment |
Market Share |
Year |
|
Rides |
Mechanical Rides |
58.4% |
2025 |
|
Revenue Source |
Ticket |
42.6% |
2025 |
|
Age Group |
19 to 35 Years |
🔒 |
2025 |
|
Region |
Asia Pacific |
38.4% |
2025 |

By Rides
Mechanical Rides account for 58.4% of the rides portfolio in 2025. This segment encompasses roller coasters, dark rides, carousel systems, drop towers, and launch coasters – the core high-throughput attractions that anchor park attendance. Single-attraction capital budgets for flagship and world-record roller coasters increasingly exceed USD 50 million. Recent examples include Dollywood’s USD 50 million NightFlight Expedition (2026) .
To access detailed market analysis, Request Sample
By Revenue Source
Ticket sales remain the primary revenue pillar at 42.6% in 2025, though leading operators are deliberately diluting this share by growing ancillary revenues. The shift toward premium-tier admission – Lightning Lane at Disney, Express Pass at Universal – serves both revenue optimization and crowd management objectives.
Regional Market Insights
Regional market dynamics reflect distinct combinations of consumer demographics, tourism infrastructure, regulatory environments, and operator investment strategies.
|
Region |
Share (2025) |
Key Drivers & Companies |
|
Asia Pacific |
38.4% |
China, Japan, India leading; Universal Studios and Disney investments |
|
North America |
24.6% |
Walt Disney World, Universal Orlando, Cedar Fair portfolio |
|
Europe |
20.3% |
Merlin-dominated; Disneyland Paris; strong safety regulations |
|
Latin America |
10.2% |
Brazil & Mexico key markets; growing domestic tourism |
|
Middle East & Africa |
6.5% |
Abu Dhabi, Dubai, Riyadh mega-entertainment investments |
Asia Pacific is the global leader with a 38.4% revenue share in 2025. China is the largest national market, with Chimelong and Fantawild operating multi-park networks across major cities. Fantawild now operates over 40 theme parks across more than 20 cities in China, reflecting rapid domestic expansion and tourism demand growth . Universal Studios Japan ranks among the world's most visited parks. India is emerging rapidly, supported by strong domestic tourism growth and rising middle-class leisure spending.
North America holds 24.6% of the global market in 2025, anchored by Walt Disney World, Universal Orlando, and Disneyland. The U.S. market is mature with high per-guest spending, supported by major operators such as Disney, which reported approximately USD 34 billion in Parks revenue in FY2024. The Cedar Fair–Six Flags merger strengthened market consolidation and competitive positioning.
Europe accounts for 20.3% of global market revenue in 2025. Europe is led by Merlin Entertainments' global attraction portfolio and Disneyland Paris, the region’s most visited theme destination. Strict safety regulations, sustainability mandates, and energy efficiency requirements continue to influence capital investments and operational strategies.
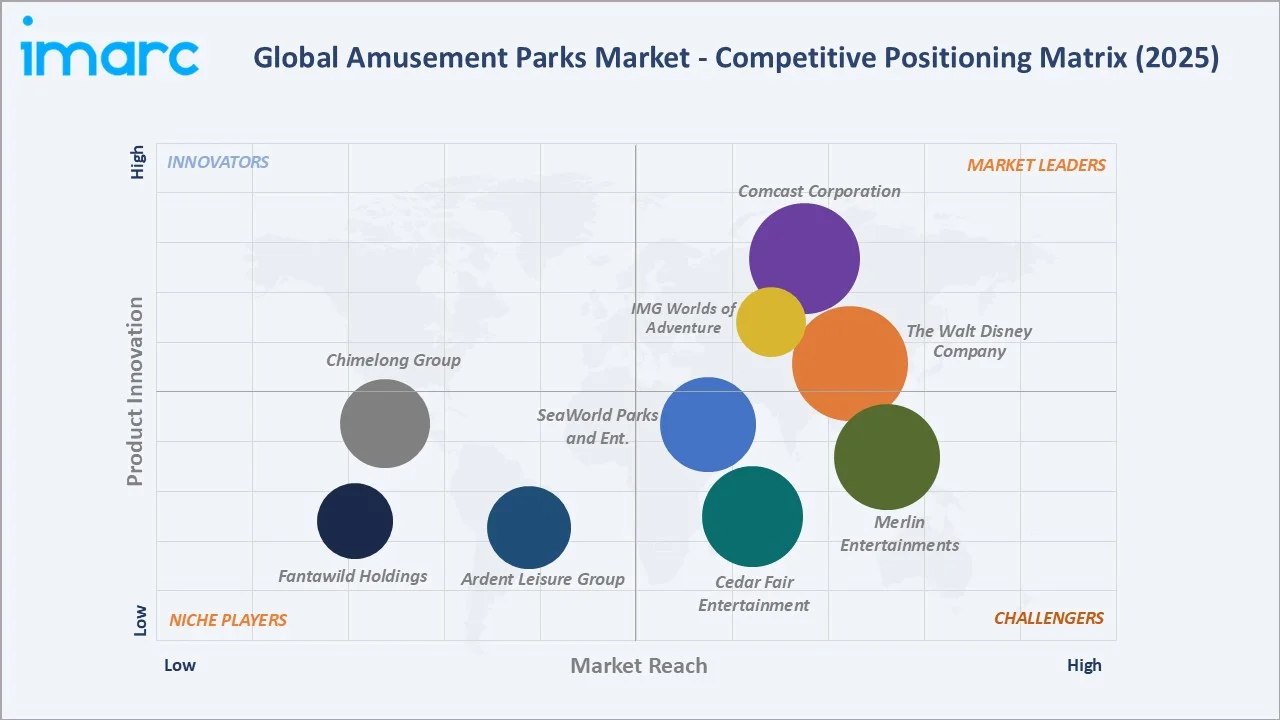
Competitive Landscape
The global amusement parks market is characterized by a concentrated competitive structure at the top, with five to six global operators commanding a combined market share estimated at 35–40% in 2025, while hundreds of regional and local operators account for the remainder.
|
Company |
Brand Name |
Position |
Strategic Focus |
|
The Walt Disney Company |
Disney Parks & Resorts |
Leader |
Global premium brand; 12+ parks; IP-driven moat |
|
Comcast Corporation |
Universal Parks & Resorts |
Leader |
Harry Potter, Nintendo themes; Epic Universe 2025 |
|
Merlin Entertainments |
LEGOLAND / Madame Tussauds |
Challenger |
Largest European operator; diversified portfolio |
|
Cedar Fair Entertainment |
Cedar Point / Knott's Berry Farm |
Challenger |
North American coaster-focused; 2024 Six Flags merger |
|
SeaWorld Parks & Ent. |
SeaWorld / Busch Gardens |
Challenger |
Marine-themed; pivot toward thrill rides post-2013 |
|
Chimelong Group |
Chimelong Resort Parks |
Emerging |
China's largest private park operator |
|
Ardent Leisure Group |
Dreamworld / WhiteWater World |
Emerging |
Australia-focused; post-incident safety transformation |
|
Fantawild Holdings |
Fantawild Adventure Series |
Emerging |
China IP-themed park chain; 30+ parks nationwide |
|
IMG Worlds of Adventure |
IMG Worlds of Adventure |
Emerging |
World's largest indoor theme park in Dubai |
Key Company Profiles
The Walt Disney Company (Disney Parks & Resorts)
- Overview: The Walt Disney Company is the world's largest amusement park operator by revenue, with Parks, Experiences & Products generating approximately USD 34.15 Billion in FY2024. Disney operates 12 theme parks across six resort destinations globally, including the United States, France, Japan, China, and Hong Kong.
- Strategic Focus: Disney is investing heavily in technology integration, including Genie+ queue management, MagicBand+ personalization, and major Star Wars and Avatar land expansions. The company announced USD 60 Billion in parks and experiences investment over the next ten years in 2024.
Comcast Corporation (Universal Parks & Resorts)
- Overview: Universal Destinations & Experiences operates parks in Orlando, Hollywood, Osaka, Beijing, and Singapore, with Epic Universe (Orlando) opening in 2025 as the most significant new theme park investment in decades, with development costs estimated at approximately USD 6–7 Billion.
- Strategic Focus: Universal is executing an aggressive expansion strategy underpinned by blockbuster IP including Harry Potter, Nintendo, Jurassic World, and DreamWorks. Epic Universe represents one of the largest single-park investments globally, designed to transform Universal Orlando into a multi-day destination resort.
Merlin Entertainments
- Overview: Merlin Entertainments is Europe’s largest visitor attraction operator and one of the world’s largest, with 140+ attractions across more than 20 countries, including LEGOLAND, Madame Tussauds, SEA LIFE, and Alton Towers. Merlin was taken private in 2019 by a consortium led by Blackstone, Kirkbi, and CPPIB .
- Strategic Focus: Merlin is expanding its LEGOLAND resort portfolio in Asia Pacific and North America, while investing in operational efficiency and sustainability initiatives. The company continues to focus on destination LEGOLAND resorts and branded indoor attractions to support long-term international growth.
Cedar Fair Entertainment / Six Flags (Combined Entity)
- Overview: Cedar Fair and Six Flags completed a merger in 2024, creating a combined entity with 40+ parks across North America and enhanced operational scale. The merger is expected to generate approximately USD 200 Million in annual cost synergies through procurement efficiencies and operational consolidation.
- Strategic Focus: The combined company is focused on portfolio optimization, premium experience investment, and cross-park season pass expansion. Leveraging flagship parks and expanding guest spending initiatives are expected to support attendance growth and improved profitability.
SeaWorld Parks & Entertainment
- Overview: SeaWorld Parks & Entertainment, renamed United Parks & Resorts in 2024, operates 12 parks across the United States under SeaWorld, Busch Gardens, Aquatica, Discovery Cove, and Sesame Place brands.
- Strategic Focus: Capital allocation has shifted toward high-capacity roller coasters and ride-focused attractions. Major investments including Mako, Ice Breaker, and Iron Gwazi have supported attendance growth and strengthened the company’s repositioning toward thrill-based destination parks.
Market Concentration Analysis
The global amusement parks market exhibits a moderately concentrated structure. The top five operators – Disney, Comcast/Universal, Merlin, Cedar Fair–Six Flags, and SeaWorld – collectively account for an estimated 35–40% of global market revenue in 2025.
Consolidation is accelerating. The Cedar Fair–Six Flags merger in 2024 is the most prominent recent example of scale-driven consolidation in North America. In Asia, international operators are entering via joint ventures and licensing agreements, given regulatory and consumer preference dynamics.
Investment & Growth Opportunities
Fastest-Growing Segments
- Hotels and Resorts (16.8% share, 2025): Integrated resort developments represent one of the most attractive growth investments in the amusement park sector, as multi-day visitors generate significantly higher per-capita spending across accommodation, food & beverage, and merchandise. Major destination operators such as Disney and Universal prioritize on-site hotel expansion to increase guest length-of-stay and overall visitor spending.
- Water Rides (32.3% share, 2025): Standalone waterparks and integrated waterpark-within-theme park developments are expanding across the Middle East, India, and Southeast Asia, supported by favorable climate conditions, tourism investments, and growing demand for family-focused leisure infrastructure in emerging tourism destinations.
- Technology-Enhanced Attractions: Theme parks are increasingly investing in VR, AR, and immersive technologies to enhance guest engagement and spending. Location-based VR entertainment adoption continues to grow, with amusement parks representing a key deployment segment for immersive attraction investments.
Emerging Markets
- Saudi Arabia: Saudi Arabia’s Vision 2030 entertainment strategy includes large-scale tourism and entertainment investments, including Qiddiya City near Riyadh. Government-backed entertainment projects aim to expand domestic tourism and position Saudi Arabia as a major regional leisure destination.
- India: Rapid urbanization, a growing middle class exceeding 300 Million by 2025, and limited per-capita theme park supply relative to population create a highly attractive greenfield opportunity for international operators.
- Southeast Asia: Vietnam, Indonesia, and Thailand are expanding tourism infrastructure at pace, with new resort developments incorporating entertainment attractions targeting both domestic and international visitors.
Venture and Institutional Investment Trends
Private equity investment in amusement parks has remained active. The Blackstone Group's ownership of Merlin, Ardent Leisure's listed status, and PIPE investments into Middle Eastern entertainment projects reflect institutional appetite for long-duration leisure infrastructure assets with stable recurring revenue characteristics.
Future Market Outlook (2026-2034)
The global amusement parks market is projected to grow from USD 58.73 Billion in 2025 to USD 84.42 Billion by 2034, at a CAGR of 3.96%. The growth trajectory is supported by a multi-decade structural expansion in global tourism, the continued rise of Asia Pacific as the world's largest regional market, and a sustained capital investment cycle by leading global operators.
The Middle East's mega-projects pipeline – Qiddiya, NEOM, expanded Yas Island, and Saudi entertainment clusters – will reshape the global competitive map by 2030, introducing a new cluster of world-class destination parks that will compete directly with Orlando and Osaka for international visitors.
Research Methodology
Primary Research
IMARC Group's primary research process includes structured interviews and consultations with senior executives at leading park operators, ride manufacturers, technology solution providers, and hospitality partners. Insights from over 50 industry stakeholders inform market sizing, trend validation, and competitive intelligence components of this report.
Secondary Research
Secondary research draws on company annual reports, regulatory filings, industry associations (IAAPA – International Association of Amusement Parks and Attractions), government tourism statistics (UNWTO, national tourism boards), and financial analyst coverage. All secondary data sources are cross-validated for consistency.
Forecasting Models
Market forecasts are generated using IMARC Group's proprietary bottom-up segmentation model, incorporating historical CAGR trends from 2020–2025, macroeconomic scenario inputs (GDP growth, tourism CAGR, consumer expenditure indices), and operator-level investment pipeline data.
Amusement Parks Market Report Scope:
| Report Features | Details |
|---|---|
| Base Year of the Analysis | 2025 |
| Historical Period | 2020-2025 |
| Forecast Period | 2026-2034 |
| Units | Billion USD |
| Scope of the Report |
Exploration of Historical Trends and Market Outlook, Industry Catalysts and Challenges, Segment-Wise Historical and Future Market Assessment:
|
| Rides Covered | Mechanical Rides, Water Rides, Others |
| Revenue sources Covered | Ticket, Food and Beverage , Merchandies, Hotel/ Resort,Others |
| Age Groups Covered | Up to 18 years, 19 to 35 years, 36 to 50 years, 51 to 65 years, More than 65 years. |
| Region Covered | Asia Pacific, Europe, North America, Latin America, Middle East and Africa |
| Countries Covered | United States, Canada, Germany, France, United Kingdom, Italy, Spain, Russia, China, Japan, India, South Korea, Australia, Indonesia, Brazil, Mexico |
| Companies Covered | Comcast CThe Walt Disney Company, Comcast Corporation, Merlin Entertainments, Cedar Fair Entertainment, SeaWorld Parks & Ent., Chimelong Group, Ardent Leisure Group, Fantawild Holdings, IMG Worlds of Adventure. |
| Customization Scope | 10% Free Customization |
| Post-Sale Analyst Support | 10-12 Weeks |
| Delivery Format | PDF and Excel through Email (We can also provide the editable version of the report in PPT/Word format on special request) |
Key Benefits for Stakeholders:
- IMARC’s report offers a comprehensive quantitative analysis of various market segments, historical and current market trends, market forecasts, and dynamics of the amusement parks market from 2020-2034.
- The research study provides the latest information on the market drivers, challenges, and opportunities in the global amusement parks market.
- The study maps the leading, as well as the fastest-growing, regional markets. It further enables stakeholders to identify the key country-level markets within each region.
- Porter's Five Forces analysis assists stakeholders in assessing the impact of new entrants, competitive rivalry, supplier power, buyer power, and the threat of substitution. It helps stakeholders to analyze the level of competition within the tonometer industry and its attractiveness.
- Competitive landscape allows stakeholders to understand their competitive environment and provides an insight into the current positions of key players in the market.
Frequently Asked Questions About the Amusement Parks Market Report
The global amusement parks market was valued at USD 58.73 Billion in 2025and is forecast to reach USD 84.42 Billion by 2034.
The market is projected to grow at a CAGR of 3.96% from 2026 to 2034, driven by tourism expansion, rising disposable incomes, and technology-driven visitor experience investments.
Asia Pacific leads with a 38.4% revenue share in 2025, driven by China, Japan, South Korea, and India's expanding park networks and growing middle-class consumer base.
The market is segmented by Rides (Mechanical, Water, Others), Revenue Source (Ticket, F&B, Hotels/Resorts, Merchandise, Others), Age Group, and Region.
Mechanical Rides dominate with a 58.4% share in 2025, encompassing roller coasters, dark rides, and drop towers that serve as primary attendance drivers for major parks.
Key players include The Walt Disney Company, Comcast Corporation, Merlin Entertainments, Cedar Fair Entertainment, SeaWorld Parks & Ent., Chimelong Group, Ardent Leisure Group, Fantawild Holdings, and IMG Worlds of Adventure.
Growth is driven by global tourism recovery, rising disposable incomes in Asia and Latin America, IP-driven attendance, immersive technology adoption, and integrated resort development models.
Key challenges include high capital expenditure requirements, labor cost inflation, weather and seasonality dependency, and competition from digital and at-home entertainment platforms.
AR/VR experiences, IoT-enabled park operations, AI personalization platforms, and digital ticketing systems are enhancing visitor experience, increasing per-visit spending, and improving operational efficiency.
North America held a 24.6% market share in 2025, anchored by Disney World, Universal Orlando, and the newly merged Cedar Fair–Six Flags entity comprising 50+ parks across the continent.
High-opportunity areas include Middle East greenfield development (Saudi Vision 2030), Asian integrated resort projects, waterpark expansion in hot climates, and technology-enhanced immersive attraction upgrades.
High-opportunity areas include Middle East greenfield development (Saudi Vision 2030), Asian integrated resort projects, waterpark expansion in hot climates, and technology-enhanced immersive attraction upgrades.
Need more help?
- Speak to our experienced analysts for insights on the current market scenarios.
- Include additional segments and countries to customize the report as per your requirement.
- Gain an unparalleled competitive advantage in your domain by understanding how to utilize the report and positively impacting your operations and revenue.
- For further assistance, please connect with our analysts.
 Request Customization
 Speak to an Analyst
 Request Brochure
 Inquire Before Buying
Benefits of Customization
- Personalize this research
- Triangulate with your data
- Get data as per your format and definition
- Gain a deeper dive into a specific application, geography, customer, or competitor
- Any level of personalization
Get in Touch With Us
UNITED STATES
Phone: +1-201-971-6302
INDIA
Phone: +91-120-433-0800
UNITED KINGDOM
Phone: +44-753-714-6104
Email: [email protected]
Client Testimonials


.webp)


