
Asia Pacific Artificial Intelligence Market Size, Share, Trends and Forecast by Type, Offering, Technology, System, End-Use Industry, and Country, 2026-2034
Asia Pacific Artificial Intelligence Market Size, Share, Trends & Forecast (2026-2034)
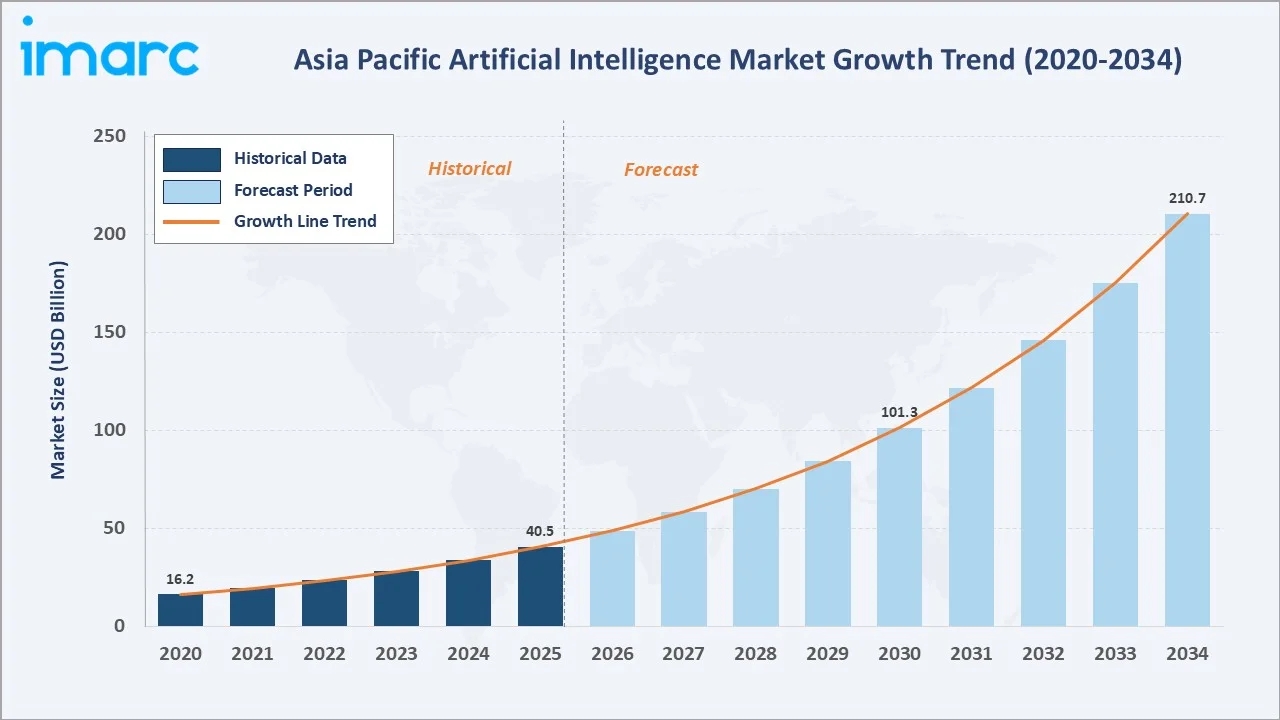
The Asia Pacific artificial intelligence market size was valued at USD 40.5 Billion in 2025 and is projected to reach USD 210.7 Billion by 2034, exhibiting a CAGR of 20.1% during 2026-2034. Rapid digital transformation across BFSI, healthcare, and manufacturing, large-scale government AI investments in China, Japan, and India, and the regional rollout of generative AI platforms are collectively driving Asia Pacific artificial intelligence market growth. Narrow/Weak AI dominates the type segment with a 91.6% share in 2025, while Software accounts for 46.8% of the offering split. China leads regional demand with a 36.4% share in 2025, supported by deep cloud and chip infrastructure.
Market Snapshot
|
Metric |
Value |
|
Market Size (2025) |
USD 40.5 Billion |
|
Forecast Market Size (2034) |
USD 210.7 Billion |
|
CAGR (2026-2034) |
20.1% |
|
Base Year |
2025 |
|
Historical Period |
2020-2025 |
|
Forecast Period |
2026-2034 |
|
Largest Country |
China (36.4% share, 2025) |
|
Fastest Growing Country |
India |
|
Leading Type |
Narrow/Weak AI (91.6%, 2025) |
|
Leading Offering |
Software (46.8%, 2025) |
The chart below shows Asia Pacific Artificial Intelligence market growth from 2020-2034 in USD Billion, with cloud and generative AI demand driving acceleration through the forecast period.
To get more information on this market, Request Sample
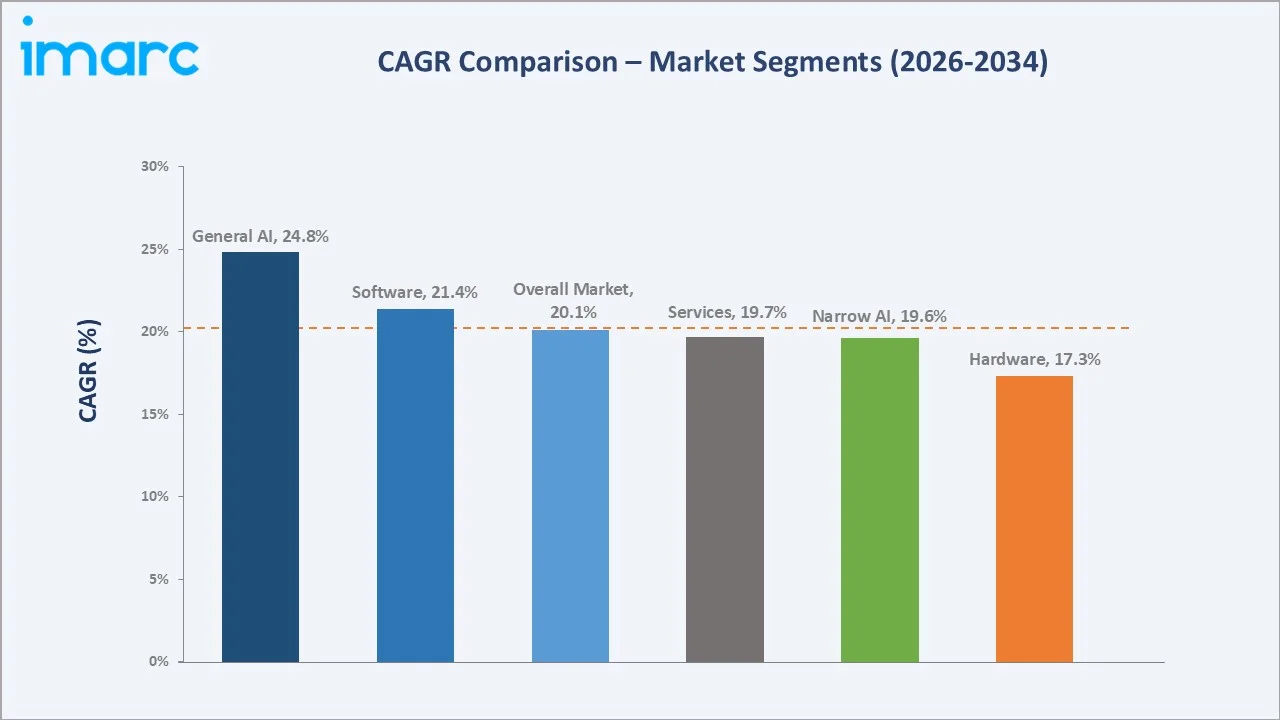
CAGR analysis identifies General/Strong AI and Software as the fastest-growing segments in the Asia Pacific Artificial Intelligence market through 2034, supported by enterprise model adoption.
Executive Summary
The Asia Pacific artificial intelligence market is being reshaped by enterprise digitalization, sovereign AI strategies, and rapid generative AI adoption. Valued at USD 40.5 Billion in 2025, up from USD 16.2 Billion in 2020, it is projected to reach USD 210.7 Billion by 2034 at a 20.1% CAGR. Public-sector AI funding, semiconductor capacity expansion, and rising cloud penetration are accelerating regional demand.
Narrow/Weak AI leads the market with a 91.6% share in 2025, anchored by computer vision, NLP, and recommendation engines deployed across BFSI, retail, and manufacturing. Software contributes 46.8% of revenue, followed by Services at 32.5% and Hardware at 20.7%. Key trends include sovereign foundation models, edge AI in factories, AI agent rollouts in financial services, and tighter regional AI governance frameworks.
China commands the largest country share at 36.4% in 2025, supported by Baidu, Alibaba, and Tencent ecosystems. Japan holds 14.8% with strong industrial AI uptake, while India at 13.2% is the fastest-growing market, driven by IT services exports, IndiaAI Mission funding, and rising GenAI deployment across enterprise SaaS.
Key Market Insights
|
Insight |
Data |
|
Largest Type Segment |
Narrow/Weak AI - 91.6% share (2025) |
|
Second Type Segment |
General/Strong AI - 8.4% share (2025) |
|
Leading Offering |
Software - 46.8% share (2025) |
|
Second Offering |
Services - 32.5% share (2025) |
|
Leading Country |
China - 36.4% (2025) |
|
Second Country |
Japan - 14.8% (2025) |
|
Fastest Growing Country |
India - 13.2% share (2025) |
|
Top Companies |
Baidu, Inc., Alibaba Cloud, Tencent, Huawei Cloud Computing Technologies Co., Ltd., SAMSUNG, NAVER Cloud Corp., and NEC Corporation |
Key Analytical Observations Supporting the Above Data Points:
- Narrow/Weak AI's 91.6% dominance in 2025 reflects the maturity of task-specific deployments such as fraud detection, computer vision, and chatbots, where ROI is well-established and integration with existing enterprise stacks remains straightforward.
- General/Strong AI at 8.4% share in 2025 represents foundation model and multimodal R&D, growing at 24.8% CAGR as Asia Pacific governments and hyperscalers fund regional large language models such as Baidu ERNIE, Alibaba Qwen, and Naver HyperCLOVA X.
- Software’s 46.8% share in 2025 is driven by demand for AI platforms, ML frameworks, and applications, while services growth reflects rising reliance on system integrators in India and Japan for enterprise AI deployment.
- China's 36.4% regional share in 2025 is supported by strong government backing for AI, a robust semiconductor ecosystem, and large-scale deployments by Baidu, Alibaba Cloud, and Tencent across smart cities and digital commerce.
- India's position as the fastest-growing market is driven by initiatives like the USD 1.25 billion IndiaAI Mission, a rapidly expanding AI talent pool, and strong participation from firms such as Tata Consultancy Services, Infosys, and Wipro in enterprise AI adoption.
- Asia Pacific generative AI investments remain at an early stage within broader AI spending, with rapid growth driven by rising hyperscaler investments from Alibaba Group, Tencent, NTT, and Naver to expand AI cloud infrastructure.
Asia Pacific Artificial Intelligence Market Overview
Artificial intelligence covers machine learning, natural language processing, computer vision, and generative AI, delivered through hardware, software, and services. The Asia Pacific Artificial Intelligence ecosystem connects chip and GPU suppliers, cloud and data centers, foundation model developers, MLOps platforms, application vendors, system integrators, and end-use industries spanning BFSI, healthcare, retail, manufacturing, and the public sector.
Regional demand is fueled by smart manufacturing, autonomous mobility pilots, fintech automation, and public-sector digitalization, supported by rising cloud adoption, expanding 5G networks, and national AI strategies across China, Japan, South Korea, India, and Singapore.
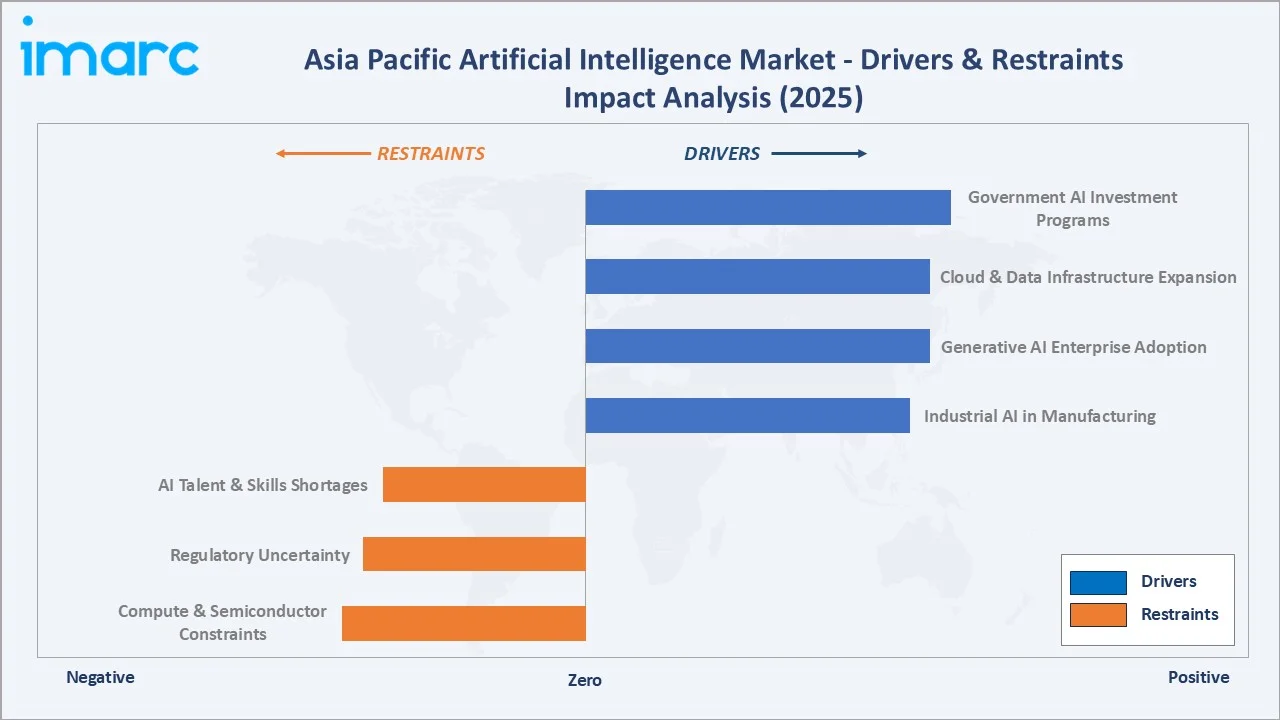
Market Dynamics
To evaluate market opportunities, Request Sample
Market Drivers
- Government AI Investment Programs: China's Next Generation AI Development Plan, Japan's AI Strategy 2022, India's USD 1.25 Billion IndiaAI Mission, and South Korea's AI semiconductor roadmap are channeling state funds into compute, talent, and applied AI deployment across priority sectors.
- Cloud and Data Infrastructure Expansion: Alibaba Cloud, Tencent Cloud, NTT, Naver Cloud, and Amazon Web Services are scaling Asia Pacific infrastructure with $40 billion investments, expanding GPU capacity and AI-ready data centers across key markets.
- Generative AI Enterprise Adoption: Banks, telcos, and retailers are deploying generative AI assistants for contact centers, software development, and content creation. Around 65% of Asia Pacific enterprises piloted generative AI by 2024, supporting strong recurring software demand.
- Industrial AI in Manufacturing: Predictive maintenance, computer vision quality inspection, and robotic process automation in automotive, electronics, and semiconductors plants across China, Japan, and South Korea are driving sustained AI software and edge hardware demand.
Market Restraints
- AI Talent and Skills Shortages: Although India, which had an AI talent pool of 600,000-650,000 in 2024, demand still outstrips supply across Asia Pacific. NASSCOM estimated a 51% AI talent gap in India in 2024, slowing enterprise rollout speeds.
- Regulatory Uncertainty: Divergent AI regulations across China's Generative AI Measures (2023), Japan's AI Guidelines, India's draft DPDP rules, and Singapore's Model AI Governance Framework create cross-border compliance complexity for regional AI vendors.
- Computer and Semiconductor Constraints: US export controls on advanced GPUs limit access to high-end accelerators in China and partly in other Asia Pacific markets, slowing high-end model training timelines for some operators.
Market Opportunities
- Sovereign Foundation Models: Regional foundation models tuned for local languages, regulations, and cultural context, including Baidu ERNIE, Alibaba Qwen, Naver HyperCLOVA X, and SoftBank's planned Japanese LLM, offer differentiated growth lanes outside global hyperscaler offerings.
- AI in Healthcare and Pharma: AI adoption in Asia Pacific healthcare is expanding across radiology, drug discovery, and hospital operations, supported by rapid market growth and increasing investments in AI-driven healthcare solutions across countries like Japan and South Korea.
- Industrial Edge AI: Semiconductor, automotive, and consumer electronics manufacturers across China, Japan, South Korea, and Taiwan are accelerating edge AI for low latency inferencing on the factory floor and in connected products.
Market Challenges
- Data Privacy and Cross-Border Data Flows: Strict data localization rules in China, India, and Indonesia complicate regional model training and limit centralized AI deployments for multinationals operating across multiple Asia Pacific markets.
- Monetization and ROI Pressure: Enterprise generative AI pilots in Asia Pacific often struggle to scale beyond proof-of-concept, with surveys indicating limited production deployment levels, raising concerns around monetization, governance, and near-term ROI realization.
- Energy and Compute Costs: Large language model training and inferencing drive substantial power and cooling demand, pressuring data center economics in markets with high electricity tariffs such as Japan, South Korea, and parts of India.
Emerging Market Trends
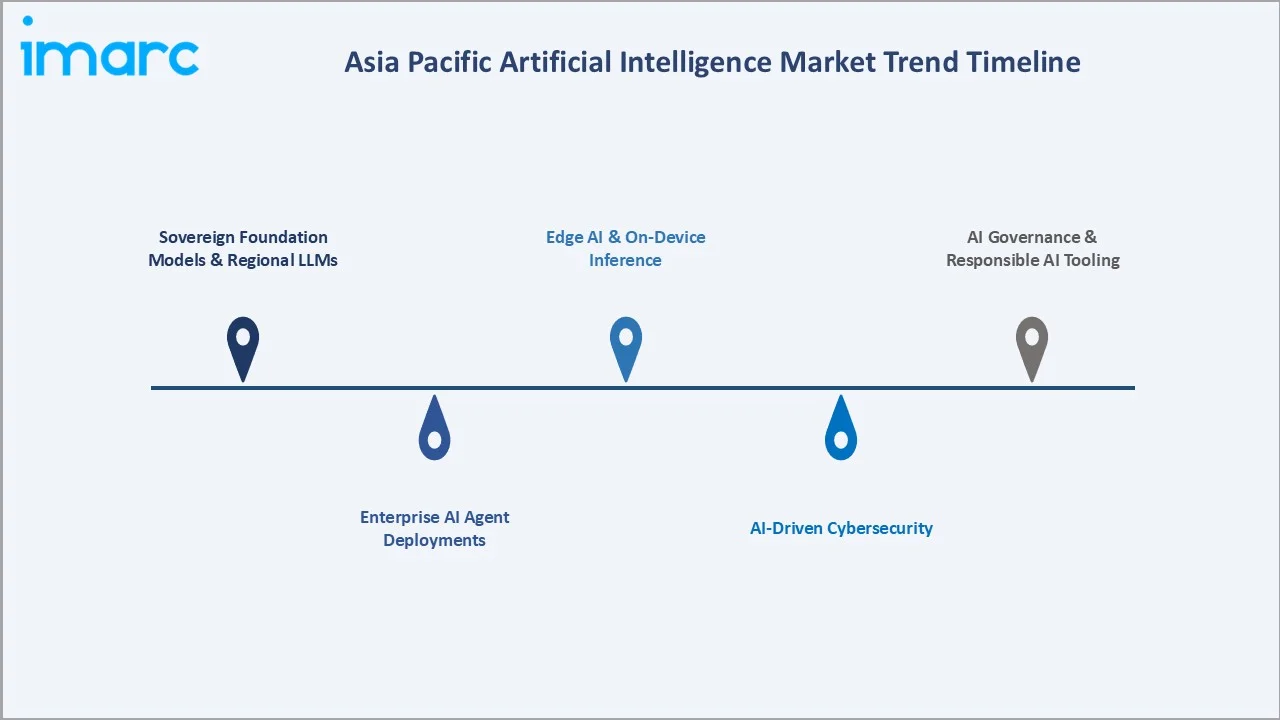
1. Sovereign Foundation Models and Regional LLMs
Asia Pacific governments and tech leaders are funding region-specific foundation models. Baidu ERNIE, Alibaba Qwen, Naver HyperCLOVA X, and India's BharatGPT initiatives target language coverage, regulatory alignment, and reduced dependency on US-developed models.
2. Enterprise AI Agent Deployments
Enterprises in banking, telecom, and retail are adopting AI copilots and automation tools for customer service and operations. Surveys indicate growing enterprise interest in agentic AI, though large-scale deployment remains in early stages across Asia Pacific.
3. Edge AI and On-Device Inference
Smartphone, automotive, and IoT manufacturers including Samsung, Huawei, and Sony are embedding AI accelerators on-device, enabling real-time inferencing for cameras, voice assistants, and ADAS without dependence on cloud connectivity.
4. AI-Driven Cybersecurity
AI-enabled cybersecurity solutions are gaining traction across BFSI and government sectors, improving threat detection and response. While exact growth rates vary, industry reports confirm faster adoption of AI-driven security tools compared to traditional cybersecurity solutions.
5. AI Governance and Responsible AI Tooling
Model risk management, explainability, and bias auditing tools are emerging as core enterprise needs. Singapore's AI Verify and Japan's AI safety institutes are setting frameworks that influence procurement requirements across Asia Pacific.
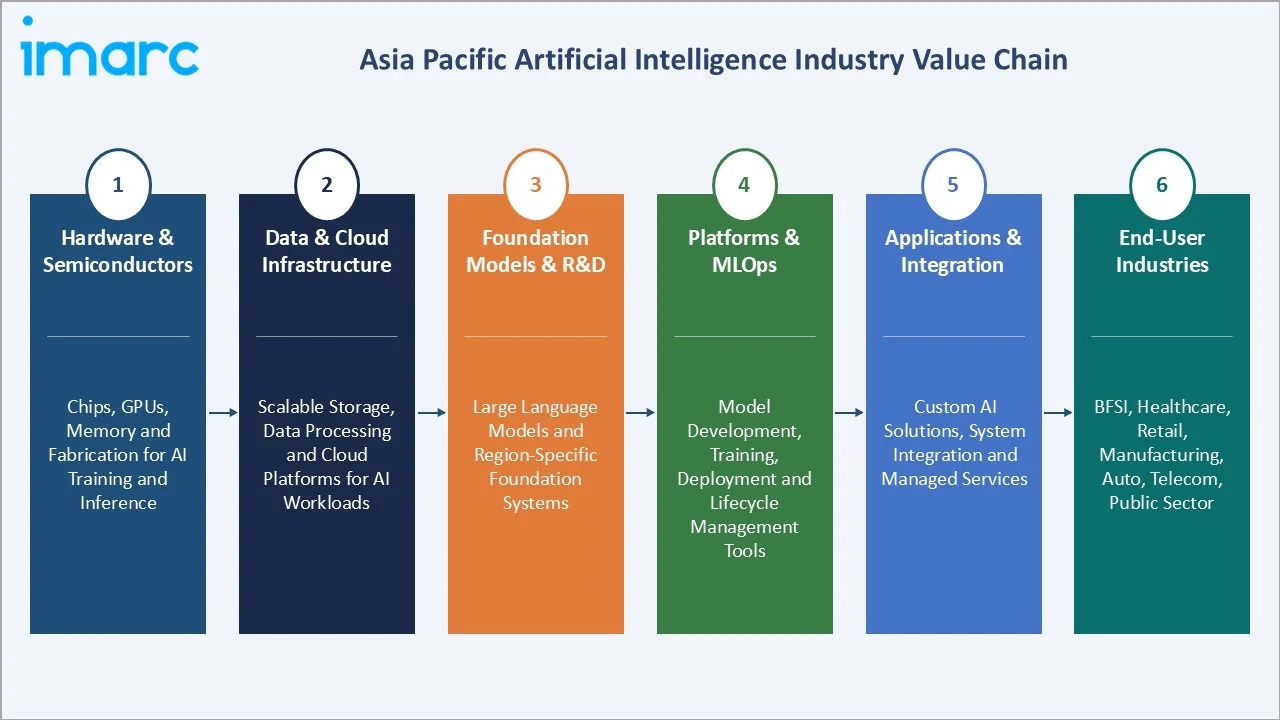
Industry Value Chain Analysis
The Asia Pacific Artificial Intelligence value chain spans hardware suppliers, data infrastructure, model development, deployment platforms, applications, and end-use industries. Each stage has distinct margin structures and competitive dynamics, with hyperscalers and foundation model developers capturing the highest economic value.
|
Stage |
Key Players / Examples |
|
Hardware & Semiconductors |
Includes chips, GPUs, memory, and fabrication enabling computation power required for training and inference workloads |
|
Data & Cloud Infrastructure |
Provides scalable storage, data processing, and cloud infrastructure supporting model training, deployment, and AI workloads |
|
Foundation Models & R&D |
Focuses on developing large language models and foundational systems enabling applications and localized AI capabilities |
|
Platforms & MLOps |
Offers tools for model development, training, deployment, monitoring, and lifecycle management across enterprise AI environments |
|
Applications & Integration |
Delivers customized AI solutions, system integration, and consulting services to embed AI into business processes |
|
End-User Industries |
BFSI, Healthcare, Retail, Manufacturing, Automotive, Telecom, Public Sector |
Foundation model developers and hyperscale cloud operators hold the highest value position, supported by deep capex, proprietary data, and full-stack control. System integrators and Indian IT services firms capture significant downstream value through enterprise AI deployment services.
Technology Landscape in the Asia Pacific Artificial Intelligence Industry
Generative AI and Large Language Models
Generative AI is the fastest-evolving technology layer, with regional foundation models such as Baidu ERNIE, Alibaba Qwen, and Naver HyperCLOVA X powering enterprise copilots, content creation, and code generation tools used across BFSI, retail, and IT services.
Computer Vision and Edge AI
Computer vision drives quality inspection, surveillance, and ADAS use-cases across China, Japan, and South Korea. Edge AI accelerators from Huawei Ascend, Samsung Exynos, and Sony Semiconductor enable on-device inferencing in industrial and consumer products.
Natural Language Processing for Multilingual Markets
Multilingual NLP is critical given Asia Pacific's linguistic diversity. Regional vendors are building speech recognition and translation engines for Mandarin, Japanese, Korean, Hindi, Bahasa, Thai, and Vietnamese, supporting customer service automation and accessibility tools.
AI Infrastructure - GPUs, Accelerators, and Cloud
AI infrastructure growth is driven by advanced GPUs, accelerators, and high-bandwidth memory, alongside strong hyperscaler investments across Asia Pacific to scale data centers and support AI training and inference workloads.
Market Segmentation Analysis
The report covers the following segments:
| Segment Category | Leading Segment | Market Share | Year |
|---|---|---|---|
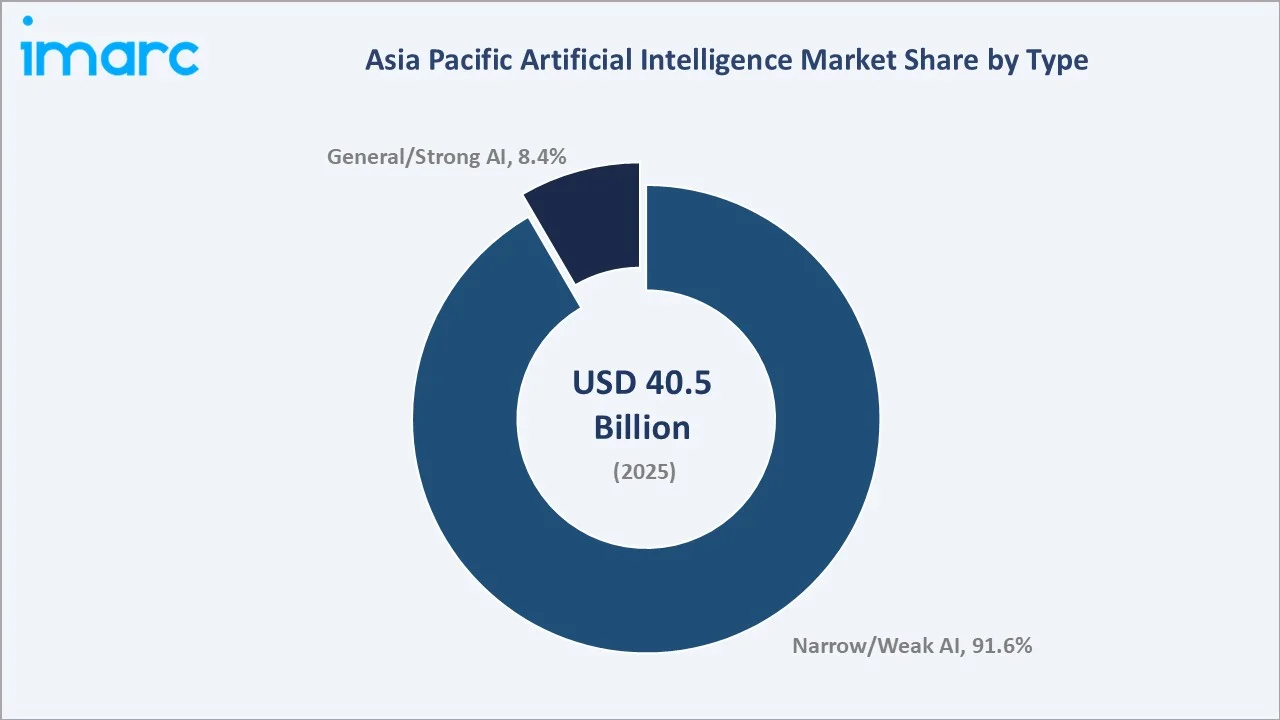
| Type | Narrow/Weak Artificial Intelligence | 91.6% | 2025 |
| Offering | Software | 46.8% | 2025 |
| Technology | Machine Learning | 🔒 | 2025 |
| System | Intelligence Systems | 🔒 | 2025 |
| End-Use Industry | Manufacturing | 🔒 | 2025 |
| Country | China | 36.4% | 2025 |

By Type
Narrow/Weak AI holds a 91.6% share in 2025, anchored by mature, task-specific deployments in fraud detection, recommendation engines, predictive maintenance, and computer vision. Banks, retailers, and manufacturers favor narrow AI for proven ROI, lower compute requirements, and simpler integration with existing IT stacks.
To access detailed market analysis, Request Sample
General/Strong AI accounts for 8.4% in 2025 but is the fastest-growing type segment, driven by foundation models, multimodal AI, and agentic systems. Heavy capex from Baidu, Alibaba, Naver, and SoftBank is expanding regional capability and pushing General AI into enterprise rollouts.
By Offering
Software leads with 46.8% share in 2025, covering AI platforms, ML libraries, packaged applications, and embedded AI in enterprise SaaS. Recurring license revenue and rapid generative AI software adoption in BFSI and IT services are key growth contributors.
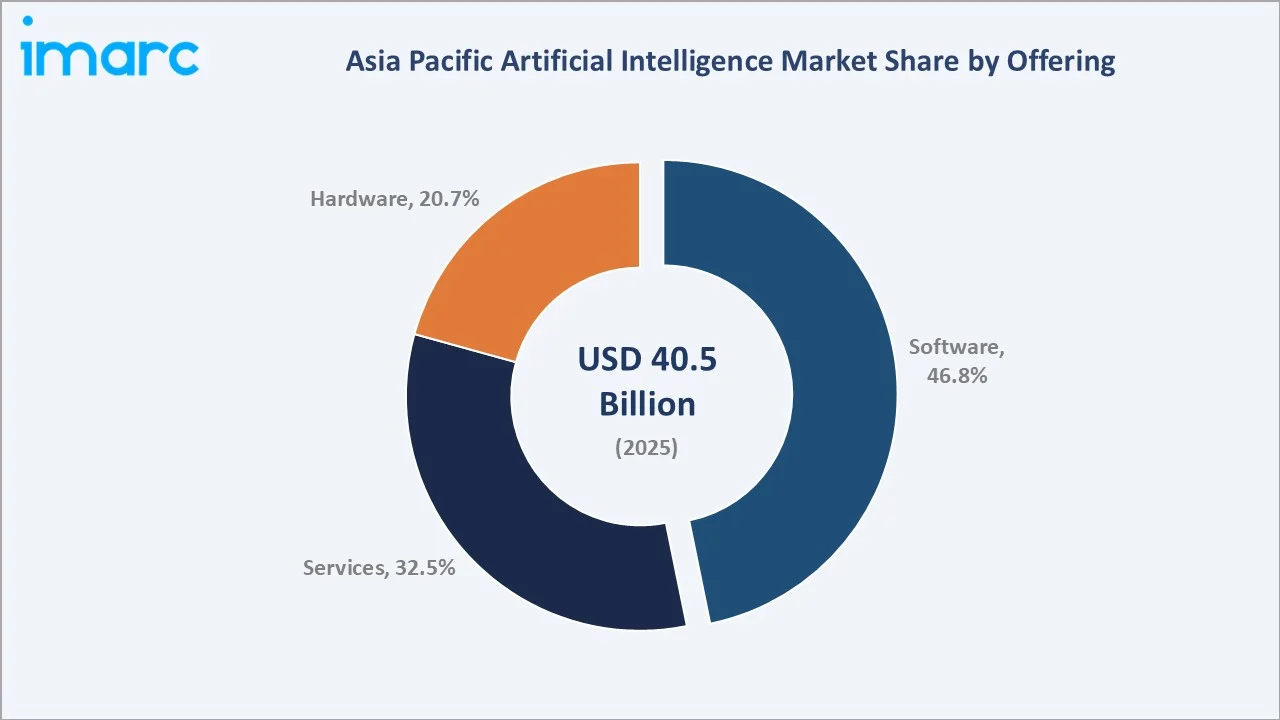
Services hold 32.5% in 2025, dominated by Indian and Japanese system integrators delivering AI consulting, deployment, and managed services. Hardware contributes 20.7%, supported by GPU, AI accelerator, and edge device demand from manufacturing, automotive, and consumer electronics players.
Country-Level Market Insights
|
Country |
Share (2025) |
Key Growth Drivers |
|
China |
36.4% |
Government AI funding, Baidu/Alibaba/Tencent ecosystems, smart city deployments, e-commerce AI, semiconductor build-out |
|
Japan |
14.8% |
Industrial AI in automotive and electronics, robotics, AI Strategy 2022, SoftBank LLM, NTT and NEC enterprise AI |
|
India |
13.2% |
IndiaAI Mission funding, TCS/Infosys/Wipro AI services exports, fintech and retail AI, talent base of 420,000+ AI professionals |
|
South Korea |
10.5% |
Naver HyperCLOVA X, Samsung AI chips, K-AI strategy, semiconductor and consumer electronics integration |
|
Australia |
8.3% |
Mining, BFSI, and government AI use-cases, federal AI investments, applied AI in resources and healthcare |
|
Indonesia |
6.7% |
Digital banking and e-commerce growth, government Making Indonesia 4.0 plan, fintech AI adoption |
|
Others |
10.1% |
Singapore AI hub, Thailand and Vietnam manufacturing AI, Malaysia data center build-out, Philippines BPO automation |
China commands a 36.4% Asia Pacific in 2025, supported by strong domestic players such as Baidu, Inc., Alibaba Cloud, Tencent, and Huawei Cloud Computing Technologies Co., Ltd., alongside government-backed AI initiatives, robust cloud investments, and integrated AI ecosystems.
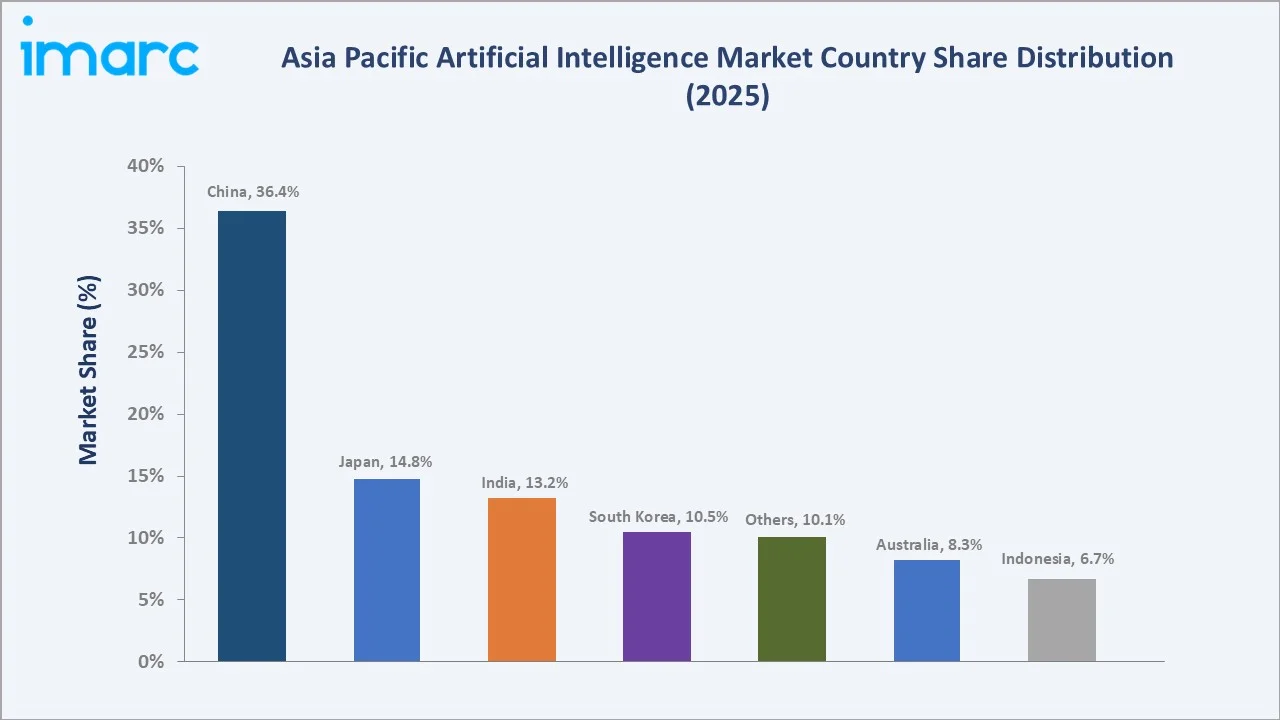
Japan at 14.8% is led by industrial AI, robotics, and enterprise software providers including NEC, Fujitsu, Hitachi, and SoftBank. India at 13.2% is the fastest-growing country, supported by IT services AI revenue, the IndiaAI Mission, and rapid generative AI adoption across BFSI, retail, and government. South Korea at 10.5% benefits from advanced memory and AI chip capabilities along with strong domestic AI models, while Australia at 8.3% and Indonesia at 6.7% support growth through mining analytics, digital banking, and expanding e-commerce adoption.
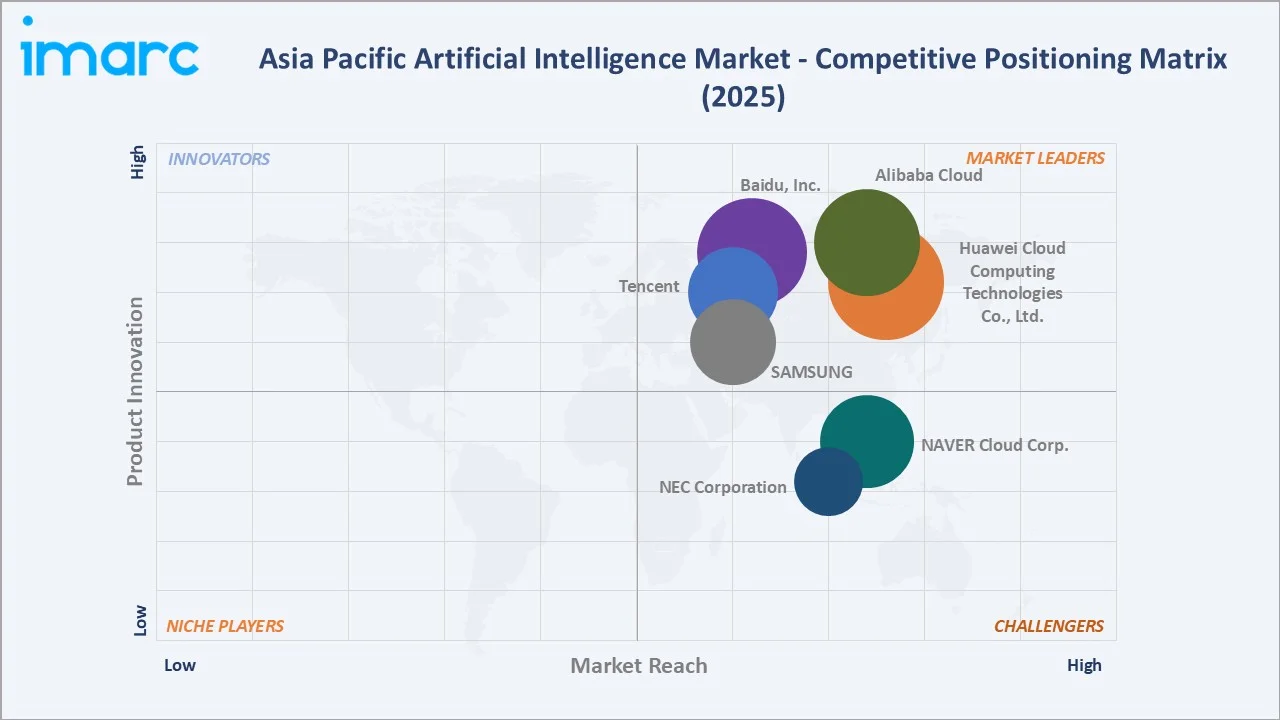
Competitive Landscape
|
Company Name |
Key Brand |
Market Position |
Core Strength |
|
Baidu, Inc. |
ERNIE |
Leader |
Foundation models, autonomous driving, search AI |
|
Alibaba Cloud |
Qwen |
Leader |
Cloud scale, e-commerce AI, regional foundation model |
|
Tencent |
Hunyuan |
Leader |
Gaming AI, social AI, financial cloud platform |
|
Huawei Cloud Computing Technologies Co., Ltd. |
Pangu |
Leader |
AI chips, full-stack platform, telecom AI |
|
SAMSUNG |
Samsung Gauss, Exynos AI Studio |
Leader |
AI semiconductors (HBM), on-device AI, consumer electronics |
|
NAVER Cloud Corp. |
HyperCLOVA X |
Challenger |
Korean LLM leadership, search and commerce AI |
|
NEC Corporation |
NEC the WISE |
Challenger |
Industrial AI, biometrics, public-sector deployments |
The market is characterized by strong regional specialization, with China leading large-scale AI deployment, Japan and South Korea focusing on industrial and edge AI, and India excelling in enterprise AI services, while overall regional AI spending reached about USD 73 Billion in 2024.
Key Company Profiles
Baidu, Inc.
Baidu, Inc., headquartered in Beijing, is a leading AI and internet company with strong capabilities in search, cloud, and autonomous driving. Its ERNIE foundation models and AI Cloud platform drive enterprise adoption, while Apollo supports robotaxi commercialization, positioning Baidu as a key AI ecosystem player in China and Asia Pacific.
- Product & Service Portfolio: ERNIE foundation models, AI Cloud services, Apollo autonomous driving, DuerOS conversational AI, and generative AI applications integrated across search and enterprise solutions.
- Recent Developments: In April 2024, Baidu announced its AI chatbot ERNIE Bot surpassed 200 million users, doubling since December. The platform records 200 million daily API calls and 85,000 enterprise clients, highlighting rapid adoption amid intensifying competition in China’s generative AI market.
- Strategic Focus: Baidu focuses on foundation model leadership, AI cloud expansion, autonomous driving commercialization, and generative AI integration across its consumer and enterprise products.
Alibaba Cloud
Alibaba Cloud, headquartered in Hangzhou, is a leading Asia Pacific cloud and AI provider under Alibaba Group. It delivers scalable cloud infrastructure and AI capabilities, with strong growth driven by enterprise digitalization and generative AI demand, supporting businesses across e-commerce, finance, and public-sector applications.
- Product & Service Portfolio: Qwen foundation models, Platform for AI (PAI), ModelScope, and AI-driven solutions integrated across cloud, e-commerce, and enterprise applications.
- Recent Developments: In September 2025, Alibaba Cloud announced over $50 billion investment in AI and cloud infrastructure, expanding global data centers and services. The move strengthens its position against global competitors, while accelerating enterprise AI adoption, partnerships, and generative AI innovation across international markets.
- Strategic Focus: Alibaba Cloud focuses on AI-driven cloud growth, advancing open foundation models, and expanding regional infrastructure to support enterprise digital transformation.
Tencent
Tencent, headquartered in Shenzhen, is a major technology and AI company with strong presence in social media, gaming, fintech, and cloud. Its AI capabilities are driven by Tencent Cloud and Hunyuan models, enabling integration of generative AI across consumer platforms and enterprise solutions in Asia Pacific.
- Product & Service Portfolio: Hunyuan large language models, Tencent Cloud TI Platform, AI-enabled WeChat features, Tencent Meeting AI tools, and AI-driven gaming and advertising solutions.
- Recent Developments: In March 2026, Tencent announced plans to launch Hunyuan 3.0 in April and develop an AI agent within WeChat. The move strengthens its generative AI strategy, following strong 2025 financial growth and deeper integration of AI across its ecosystem.
- Strategic Focus: Tencent focuses on embedding generative AI across its ecosystem, advancing multimodal models, and expanding AI-driven cloud and enterprise solutions.
Market Concentration Analysis
The Asia Pacific Artificial Intelligence market is moderately concentrated at the top, with Baidu, Inc., Alibaba Cloud, Tencent, Huawei Cloud Computing Technologies Co., Ltd., and Samsung collectively accounting for an estimated 35-40% of regional AI revenue in 2025. Their advantage stems from full-stack capabilities spanning chips, cloud, foundation models, and enterprise applications.
Fragmentation increases at the application and services layer, where hundreds of regional system integrators, AI startups, and vertical specialists compete for enterprise AI projects. Indian IT services firms alone account for over USD 10 - 12 Billion in regional AI implementation revenue in FY2026.
Consolidation is accelerating through hyperscaler acquisitions of vertical AI startups, sovereign foundation model partnerships, and government-backed mergers in Chinese AI infrastructure. Capital intensity of frontier AI continues to favor large incumbents, gradually concentrating R&D leadership.
Investment & Growth Opportunities
Fastest-Growing Segments
Generative AI software, AI cloud services, and AI semiconductors are among the fastest-growing segments in Asia Pacific, driven by enterprise adoption and data center expansion. High-bandwidth memory (HBM), largely controlled by Samsung Electronics and SK Hynix, is seeing strong demand due to rapid growth in AI workloads and cloud infrastructure investments.
Emerging Country Opportunities
India, Indonesia, Vietnam, and the Philippines are emerging as high-growth AI markets in Asia Pacific, supported by digital transformation, government-led AI initiatives, and expanding fintech and outsourcing sectors. These countries are creating new demand hubs, complementing more mature markets such as China, Japan, and South Korea.
Venture and Strategic Investment Trends
Asia Pacific continues to attract strong AI investment, led by China and India, with active venture funding and large funding rounds for emerging startups. Strategic investments from major technology companies such as Alibaba, Tencent, SoftBank, and Naver are accelerating the development of foundation models and expanding the regional AI innovation ecosystem.
Future Market Outlook (2026-2034)
The Asia Pacific Artificial Intelligence market is projected to grow from USD 40.5 Billion in 2025 to USD 210.7 Billion by 2034 at a CAGR of 20.1% - an absolute increase of over USD 170 Billion across the forecast period. Growth will be powered by enterprise generative AI scale-up, sovereign AI investments, and AI semiconductor demand.
Three transformational shifts will reshape the market through 2034. First, agentic AI systems will move from pilots to production across BFSI, IT services, and customer service. Second, sovereign foundation models will entrench regional autonomy and data localization. Third, edge AI in automotive, electronics, and industrial automation will unlock new on-device markets.
Asia Pacific is expected to become one of the largest and fastest-growing artificial intelligence markets by 2034, driven by strong adoption in China, India, and Southeast Asia. Companies investing in proprietary models, full-stack platforms, and vertical AI solutions are likely to gain competitive advantage across enterprise, consumer, and public-sector applications.
Research Methodology
Primary Research
Primary research was conducted through structured interviews and surveys with regional AI stakeholders during 2024-2025, including senior executives at hyperscalers, CIOs and CTOs at Asia Pacific enterprises across BFSI, healthcare, and manufacturing, AI startup founders, and policy advisors at national AI agencies.
Secondary Research
Secondary sources include company annual reports (Baidu, Inc., Alibaba Cloud, Tencent, Huawei Cloud Computing Technologies Co., Ltd., SAMSUNG, NAVER Cloud Corp., and NEC Corporation), government strategy documents (China NGAI Plan, Japan AI Strategy 2022, IndiaAI Mission, Singapore National AI Strategy), industry associations (NASSCOM, JEITA, KAIA), and trade media.
Forecasting Models
Market estimations combine top-down and bottom-up modeling, incorporating cloud capex trajectories, AI software penetration rates, country-level GDP and IT spending, semiconductor capacity additions, and scenario analysis under base, optimistic, and conservative macroeconomic and regulatory assumptions.
Asia Pacific Artificial Intelligence Market Report Coverage:
| Report Features | Details |
|---|---|
| Base Year of the Analysis | 2025 |
| Historical Period | 2020-2025 |
| Forecast Period | 2026-2034 |
| Units | Billion USD |
| Scope of the Report |
Exploration of Historical Trends and Market Outlook, Industry Catalysts and Challenges, Segment-Wise Historical and Future Market Assessment:
|
| Types Covered | Narrow/Weak Artificial Intelligence, General/Strong Artificial Intelligence |
| Offerings Covered | Hardware, Software, Services |
| Technologies Covered | Machine Learning, Natural Language Processing, Context-Aware Computing, Computer Vision, Others |
| Systems Covered | Intelligence Systems, Decision Support Processing, Hybrid Systems, Fuzzy Systems |
| End-Use Industries Covered | Healthcare, Manufacturing, Automotive, Agriculture, Retail, Security, Human Resources, Marketing, Financial Services, Transportation and Logistics, Others |
| Countries Covered | China, Japan, India, South Korea, Australia, Indonesia, Others |
| Companies Covered | Baidu, Inc., Alibaba Cloud, Tencent, Huawei Cloud Computing Technologies Co., Ltd., SAMSUNG, NAVER Cloud Corp., NEC Corporation, etc. |
| Customization Scope | 10% Free Customization |
| Post-Sale Analyst Support | 10-12 Weeks |
| Delivery Format | PDF and Excel through Email (We can also provide the editable version of the report in PPT/Word format on special request) |
Frequently Asked Questions About the Asia Pacific Artificial Intelligence Market Report
The Asia Pacific Artificial Intelligence market was valued at USD 40.5 Billion in 2025, supported by enterprise digitalization, generative AI adoption, and large-scale government AI investment programs across major regional economies.
The market is projected to reach USD 210.7 Billion by 2034, growing at a 20.1% CAGR during 2026-2034, driven by sovereign foundation models, AI cloud expansion, and industrial AI deployments.
Narrow/Weak AI leads with a 91.6% share in 2025, anchored by mature task-specific deployments such as fraud detection, recommendation engines, computer vision, and predictive maintenance use-cases.
Software dominates with a 46.8% share in 2025, covering AI platforms, ML libraries, and packaged applications, followed by Services at 32.5% and Hardware at 20.7% of regional revenue.
China leads with a 36.4% share in 2025, powered by Baidu, Alibaba, Tencent, Huawei, and SenseTime alongside major government AI funding and a deep semiconductor and cloud infrastructure base.
Key drivers include government AI funding programs, hyperscaler cloud capex, generative AI enterprise adoption, industrial AI in manufacturing, and rising AI semiconductor demand across the region.
India is the fastest-growing country, supported by the USD 1.25 Billion IndiaAI Mission, large IT services AI exports, and rapid generative AI deployment across BFSI, retail, and public-sector clients.
Leading companies include Baidu, Inc., Alibaba Cloud, Tencent, Huawei Cloud Computing Technologies Co., Ltd., SAMSUNG, NAVER Cloud Corp., and NEC Corporation, which together drive most regional AI investment.
General/Strong AI holds 8.4% share in 2025 but is the fastest-growing type segment, expanding above 24% CAGR through 2034 as foundation models and agentic AI scale across enterprises.
Generative AI is driving software and cloud demand, with regional models like Baidu ERNIE, Alibaba Qwen, and Naver HyperCLOVA X powering enterprise copilots, content tools, and customer service automation.
Asia Pacific is the global hub for AI semiconductors, with Samsung, SK Hynix, TSMC, and Huawei supplying HBM memory, GPUs, and AI accelerators that power regional and global AI training and inference.
Key challenges include AI talent shortages, regulatory fragmentation across countries, data localization requirements, GPU export restrictions, and unclear monetization paths for early-stage generative AI pilots.
Need more help?
- Speak to our experienced analysts for insights on the current market scenarios.
- Include additional segments and countries to customize the report as per your requirement.
- Gain an unparalleled competitive advantage in your domain by understanding how to utilize the report and positively impacting your operations and revenue.
- For further assistance, please connect with our analysts.
 Request Customization
 Speak to an Analyst
 Request Brochure
 Inquire Before Buying
Benefits of Customization
- Personalize this research
- Triangulate with your data
- Get data as per your format and definition
- Gain a deeper dive into a specific application, geography, customer, or competitor
- Any level of personalization
Get in Touch With Us
UNITED STATES
Phone: +1-201-971-6302
INDIA
Phone: +91-120-433-0800
UNITED KINGDOM
Phone: +44-753-714-6104
Email: [email protected]
Client Testimonials


.webp)


