Market Overview:
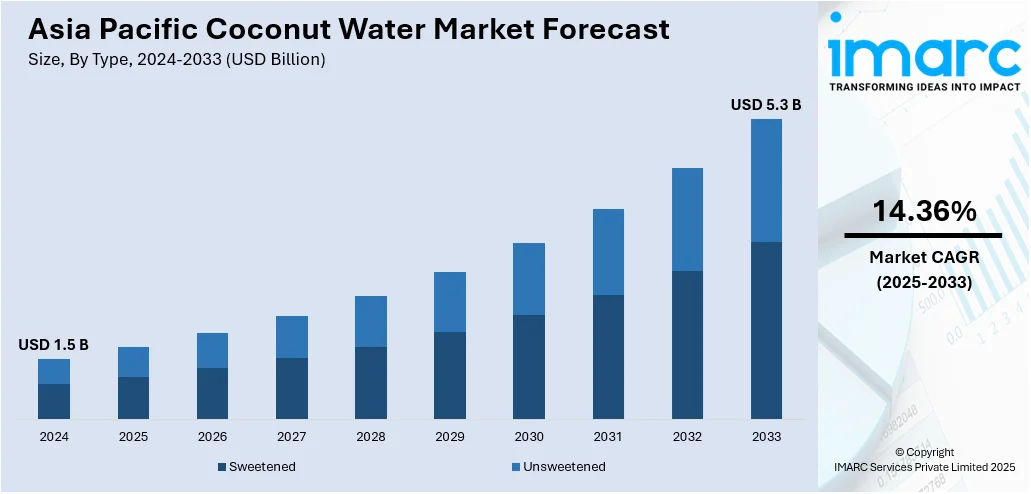
The Asia Pacific coconut water market exhibited robust growth during 2015-2020. Looking forward, IMARC Group expects the market to continue its robust growth during 2021-2026. Keeping in mind the uncertainties of COVID-19, we are continuously tracking and evaluating the direct as well as the indirect influence of the pandemic. These insights are included in the report as a major market contributor.
Coconut water is a clear liquid that is found in the center cavity of tender green coconuts. It is a rich source of potassium, sodium, magnesium, manganese and calcium with low fat, calories and carbohydrates. The high concentration of natural electrolytes in coconut water replenishes the body and prevents dehydration post workouts. In the Asia Pacific region, coconut water is used in various culinary dishes and drinks as a flavoring agent and base for cocktails. It is also consumed as a refreshing and natural energy drink.
Asia Pacific Coconut Water Market Trends:
The Asia Pacific coconut water market is primarily driven by the growing preference for ready-to-drink (RTD) beverages, especially among health-conscious consumers. They incorporate coconut water in their diet as it is rich in antiaging, anticarcinogenic and antithrombic properties. Additionally, as coconut water is available in fresh, canned, and bottled forms with a shelf life of more than nine months, it is increasingly being preferred by individuals across the region. Moreover, the growing number of coconut plantations and the rising adoption of a vegan diet and non-dairy products are also significantly impacting the market growth.
Key Market Segmentation:
IMARC Group provides an analysis of the key trends in each sub-segment of the Asia Pacific coconut water market, along with forecasts at the regional and country level from 2021-2026. Our report has categorized the market based on type, flavor, form, packaging and distribution channel.
Breakup by Type:
Breakup by Flavor:
Breakup by Form:
- Coconut Water
- Coconut Water Powder
Breakup by Packaging:
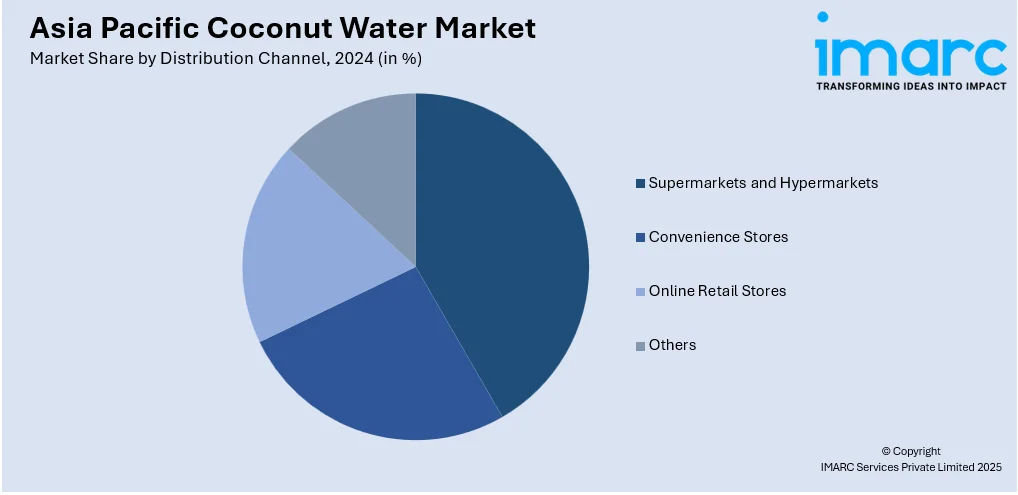
Breakup by Distribution Channel:
- Supermarkets and Hypermarkets
- Convenience Stores
- Online Retail Stores
- Others
Breakup by Country:
- China
- Japan
- India
- South Korea
- Australia
- Indonesia
- Others
Competitive Landscape:
The competitive landscape of the industry has also been examined along with the profiles of the key players.
Report Coverage:
Report Features |
Details |
---|
Base Year of the Analysis |
2020 |
Historical Period |
2015-2020 |
Forecast Period |
2021-2026 |
Units |
US$ Billion |
Segment Coverage |
Type, Flavor, Form, Packaging, Distribution Channel, Country |
Countries Covered |
China, Japan, India, South Korea, Australia, Indonesia, Others |
Customization Scope |
10% Free Customization |
Report Price and Purchase Option |
Single User License: US$ 2499
Five User License: US$ 3499
Corporate License: US$ 4499 |
Post-Sale Analyst Support |
10-12 Weeks |
Delivery Format |
PDF and Excel through Email (We can also provide the editable version of the report in PPT/Word format on special request) |
Key Questions Answered in This Report:
- How has the Asia Pacific coconut water market performed so far and how will it perform in the coming years?
- What has been the impact of COVID-19 on the Asia Pacific coconut water market?
- What are the key regional markets?
- What is the breakup of the market based on the type?
- What is the breakup of the market based on the flavor?
- What is the breakup of the market based on the form?
- What is the breakup of the market based on the packaging?
- What is the breakup of the market based on the distribution channel?
- What are the various stages in the value chain of the industry?
- What are the key driving factors and challenges in the industry?
- What is the structure of the Asia Pacific coconut water market and who are the key players?
- What is the degree of competition in the industry?
1 Preface
2 Scope and Methodology
2.1 Objectives of the Study
2.2 Stakeholders
2.3 Data Sources
2.3.1 Primary Sources
2.3.2 Secondary Sources
2.4 Market Estimation
2.4.1 Bottom-Up Approach
2.4.2 Top-Down Approach
2.5 Forecasting Methodology
3 Executive Summary
4 Introduction
4.1 Overview
4.2 Key Industry Trends
5 Asia Pacific Coconut Water Market
5.1 Market Overview
5.2 Market Performance
5.3 Impact of COVID-19
5.4 Market Forecast
6 Market Breakup by Type
6.1 Sweetened
6.1.1 Market Trends
6.1.2 Market Forecast
6.2 Unsweetened
6.2.1 Market Trends
6.2.2 Market Forecast
7 Market Breakup by Flavor
7.1 Plain
7.1.1 Market Trends
7.1.2 Market Forecast
7.2 Flavoured
7.2.1 Market Trends
7.2.2 Market Forecast
8 Market Breakup by Form
8.1 Coconut Water
8.1.1 Market Trends
8.1.2 Market Forecast
8.2 Coconut Water Powder
8.2.1 Market Trends
8.2.2 Market Forecast
9 Market Breakup by Packaging
9.1 Carton
9.1.1 Market Trends
9.1.2 Market Forecast
9.2 Bottles
9.2.1 Market Trends
9.2.2 Market Forecast
9.3 Others
9.3.1 Market Trends
9.3.2 Market Forecast
10 Market Breakup by Distribution Channel
10.1 Supermarkets and Hypermarkets
10.1.1 Market Trends
10.1.2 Market Forecast
10.2 Convenience Stores
10.2.1 Market Trends
10.2.2 Market Forecast
10.3 Online Retail Stores
10.3.1 Market Trends
10.3.2 Market Forecast
10.4 Others
10.4.1 Market Trends
10.4.2 Market Forecast
11 Market Breakup by Country
11.1 China
11.1.1 Market Trends
11.1.2 Market Breakup by Type
11.1.3 Market Breakup by Flavor
11.1.4 Market Breakup by Form
11.1.5 Market Breakup by Packaging
11.1.6 Market Breakup by Distribution Channel
11.1.7 Market Forecast
11.2 Japan
11.2.1 Market Trends
11.2.2 Market Breakup by Type
11.2.3 Market Breakup by Flavor
11.2.4 Market Breakup by Form
11.2.5 Market Breakup by Packaging
11.2.6 Market Breakup by Distribution Channel
11.2.7 Market Forecast
11.3 India
11.3.1 Market Trends
11.3.2 Market Breakup by Type
11.3.3 Market Breakup by Flavor
11.3.4 Market Breakup by Form
11.3.5 Market Breakup by Packaging
11.3.6 Market Breakup by Distribution Channel
11.3.7 Market Forecast
11.4 South Korea
11.4.1 Market Trends
11.4.2 Market Breakup by Type
11.4.3 Market Breakup by Flavor
11.4.4 Market Breakup by Form
11.4.5 Market Breakup by Packaging
11.4.6 Market Breakup by Distribution Channel
11.4.7 Market Forecast
11.5 Australia
11.5.1 Market Trends
11.5.2 Market Breakup by Type
11.5.3 Market Breakup by Flavor
11.5.4 Market Breakup by Form
11.5.5 Market Breakup by Packaging
11.5.6 Market Breakup by Distribution Channel
11.5.7 Market Forecast
11.6 Indonesia
11.6.1 Market Trends
11.6.2 Market Breakup by Type
11.6.3 Market Breakup by Flavor
11.6.4 Market Breakup by Form
11.6.5 Market Breakup by Packaging
11.6.6 Market Breakup by Distribution Channel
11.6.7 Market Forecast
11.7 Others
11.7.1 Market Trends
11.7.2 Market Breakup by Type
11.7.3 Market Breakup by Flavor
11.7.4 Market Breakup by Form
11.7.5 Market Breakup by Packaging
11.7.6 Market Breakup by Distribution Channel
11.7.7 Market Forecast
12 SWOT Analysis
12.1 Overview
12.2 Strengths
12.3 Weaknesses
12.4 Opportunities
12.5 Threats
13 Value Chain Analysis
13.1 Overview
13.2 Inbound Logistics
13.3 Operations
13.4 Outbound Logistics
13.5 Marketing and Sales
13.6 Service
14 Porters Five Forces Analysis
14.1 Overview
14.2 Bargaining Power of Buyers
14.3 Bargaining Power of Suppliers
14.4 Degree of Competition
14.5 Threat of New Entrants
14.6 Threat of Substitutes
15 Price Analysis
16 Policy and Regulatory Landscape
17 Competitive Landscape
17.1 Market Structure
17.2 Key Players
17.3 Profiles of Key Players
List of Figures
Figure 1: Asia Pacific: Coconut Water Market: Major Drivers and Challenges
Figure 2: Asia Pacific: Coconut Water Market: Sales Value (in Billion US$), 2015-2020
Figure 3: Asia Pacific: Coconut Water Market Forecast: Sales Value (in Billion US$), 2021-2026
Figure 4: Asia Pacific: Coconut Water Market: Breakup by Type (in %), 2020
Figure 5: Asia Pacific: Coconut Water Market: Breakup by Flavor (in %), 2020
Figure 6: Asia Pacific: Coconut Water Market: Breakup by Form (in %), 2020
Figure 7: Asia Pacific: Coconut Water Market: Breakup by Packaging (in %), 2020
Figure 8: Asia Pacific: Coconut Water Market: Breakup by Distribution Channel (in %), 2020
Figure 9: Asia Pacific: Coconut Water Market: Breakup by Country (in %), 2020
Figure 10: Asia Pacific: Coconut Water (Sweetened) Market: Sales Value (in Million US$), 2015 & 2020
Figure 11: Asia Pacific: Coconut Water (Sweetened) Market Forecast: Sales Value (in Million US$), 2021-2026
Figure 12: Asia Pacific: Coconut Water (Unsweetened) Market: Sales Value (in Million US$), 2015 & 2020
Figure 13: Asia Pacific: Coconut Water (Unsweetened) Market Forecast: Sales Value (in Million US$), 2021-2026
Figure 14: Asia Pacific: Coconut Water (Plain) Market: Sales Value (in Million US$), 2015 & 2020
Figure 15: Asia Pacific: Coconut Water (Plain) Market Forecast: Sales Value (in Million US$), 2021-2026
Figure 16: Asia Pacific: Coconut Water (Flavoured) Market: Sales Value (in Million US$), 2015 & 2020
Figure 17: Asia Pacific: Coconut Water (Flavoured) Market Forecast: Sales Value (in Million US$), 2021-2026
Figure 18: Asia Pacific: Coconut Water (Coconut Water) Market: Sales Value (in Million US$), 2015 & 2020
Figure 19: Asia Pacific: Coconut Water (Coconut Water) Market Forecast: Sales Value (in Million US$), 2021-2026
Figure 20: Asia Pacific: Coconut Water (Coconut Water Powder) Market: Sales Value (in Million US$), 2015 & 2020
Figure 21: Asia Pacific: Coconut Water (Coconut Water Powder) Market Forecast: Sales Value (in Million US$), 2021-2026
Figure 22: Asia Pacific: Coconut Water (Carton) Market: Sales Value (in Million US$), 2015 & 2020
Figure 23: Asia Pacific: Coconut Water (Carton) Market Forecast: Sales Value (in Million US$), 2021-2026
Figure 24: Asia Pacific: Coconut Water (Bottles) Market: Sales Value (in Million US$), 2015 & 2020
Figure 25: Asia Pacific: Coconut Water (Bottles) Market Forecast: Sales Value (in Million US$), 2021-2026
Figure 26: Asia Pacific: Coconut Water (Other Packagings) Market: Sales Value (in Million US$), 2015 & 2020
Figure 27: Asia Pacific: Coconut Water (Other Packagings) Market Forecast: Sales Value (in Million US$), 2021-2026
Figure 28: Asia Pacific: Coconut Water (Supermarkets and Hypermarkets) Market: Sales Value (in Million US$), 2015 & 2020
Figure 29: Asia Pacific: Coconut Water (Supermarkets and Hypermarkets) Market Forecast: Sales Value (in Million US$), 2021-2026
Figure 30: Asia Pacific: Coconut Water (Convenience Stores) Market: Sales Value (in Million US$), 2015 & 2020
Figure 31: Asia Pacific: Coconut Water (Convenience Stores) Market Forecast: Sales Value (in Million US$), 2021-2026
Figure 32: Asia Pacific: Coconut Water (Online Retail Stores) Market: Sales Value (in Million US$), 2015 & 2020
Figure 33: Asia Pacific: Coconut Water (Online Retail Stores) Market Forecast: Sales Value (in Million US$), 2021-2026
Figure 34: Asia Pacific: Coconut Water (Other Distribution Channels) Market: Sales Value (in Million US$), 2015 & 2020
Figure 35: Asia Pacific: Coconut Water (Other Distribution Channels) Market Forecast: Sales Value (in Million US$), 2021-2026
Figure 36: China: Coconut Water Market: Sales Value (in Million US$), 2015 & 2020
Figure 37: China: Coconut Water Market: Breakup by Type (in %), 2020
Figure 38: China: Coconut Water Market: Breakup by Flavor (in %), 2020
Figure 39: China: Coconut Water Market: Breakup by Form (in %), 2020
Figure 40: China: Coconut Water Market: Breakup by Packaging (in %), 2020
Figure 41: China: Coconut Water Market: Breakup by Distribution Channel (in %), 2020
Figure 42: China: Coconut Water Market Forecast: Sales Value (in Million US$), 2021-2026
Figure 43: Japan: Coconut Water Market: Sales Value (in Million US$), 2015 & 2020
Figure 44: Japan: Coconut Water Market: Breakup by Type (in %), 2020
Figure 45: Japan: Coconut Water Market: Breakup by Flavor (in %), 2020
Figure 46: Japan: Coconut Water Market: Breakup by Form (in %), 2020
Figure 47: Japan: Coconut Water Market: Breakup by Packaging (in %), 2020
Figure 48: Japan: Coconut Water Market: Breakup by Distribution Channel (in %), 2020
Figure 49: Japan: Coconut Water Market Forecast: Sales Value (in Million US$), 2021-2026
Figure 50: India: Coconut Water Market: Sales Value (in Million US$), 2015 & 2020
Figure 51: India: Coconut Water Market: Breakup by Type (in %), 2020
Figure 52: India: Coconut Water Market: Breakup by Flavor (in %), 2020
Figure 53: India: Coconut Water Market: Breakup by Form (in %), 2020
Figure 54: India: Coconut Water Market: Breakup by Packaging (in %), 2020
Figure 55: India: Coconut Water Market: Breakup by Distribution Channel (in %), 2020
Figure 56: India: Coconut Water Market Forecast: Sales Value (in Million US$), 2021-2026
Figure 57: South Korea: Coconut Water Market: Sales Value (in Million US$), 2015 & 2020
Figure 58: South Korea: Coconut Water Market: Breakup by Type (in %), 2020
Figure 59: South Korea: Coconut Water Market: Breakup by Flavor (in %), 2020
Figure 60: South Korea: Coconut Water Market: Breakup by Form (in %), 2020
Figure 61: South Korea: Coconut Water Market: Breakup by Packaging (in %), 2020
Figure 62: South Korea: Coconut Water Market: Breakup by Distribution Channel (in %), 2020
Figure 63: South Korea: Coconut Water Market Forecast: Sales Value (in Million US$), 2021-2026
Figure 64: Australia: Coconut Water Market: Sales Value (in Million US$), 2015 & 2020
Figure 65: Australia: Coconut Water Market: Breakup by Type (in %), 2020
Figure 66: Australia: Coconut Water Market: Breakup by Flavor (in %), 2020
Figure 67: Australia: Coconut Water Market: Breakup by Form (in %), 2020
Figure 68: Australia: Coconut Water Market: Breakup by Packaging (in %), 2020
Figure 69: Australia: Coconut Water Market: Breakup by Distribution Channel (in %), 2020
Figure 70: Australia: Coconut Water Market Forecast: Sales Value (in Million US$), 2021-2026
Figure 71: Indonesia: Coconut Water Market: Sales Value (in Million US$), 2015 & 2020
Figure 72: Indonesia: Coconut Water Market: Breakup by Type (in %), 2020
Figure 73: Indonesia: Coconut Water Market: Breakup by Flavor (in %), 2020
Figure 74: Indonesia: Coconut Water Market: Breakup by Form (in %), 2020
Figure 75: Indonesia: Coconut Water Market: Breakup by Packaging (in %), 2020
Figure 76: Indonesia: Coconut Water Market: Breakup by Distribution Channel (in %), 2020
Figure 77: Indonesia: Coconut Water Market Forecast: Sales Value (in Million US$), 2021-2026
Figure 78: Others: Coconut Water Market: Sales Value (in Million US$), 2015 & 2020
Figure 79: Others: Coconut Water Market Forecast: Sales Value (in Million US$), 2021-2026
Figure 80: Asia Pacific: Coconut Water Industry: SWOT Analysis
Figure 81: Asia Pacific: Coconut Water Industry: Value Chain Analysis
Figure 82: Asia Pacific: Coconut Water Industry: Porter’s Five Forces Analysis
List of Tables
Table 1: Asia Pacific: Coconut Water Market: Key Industry Highlights, 2020 and 2026
Table 2: Asia Pacific: Coconut Water Market Forecast: Breakup by Type (in Million US$), 2021-2026
Table 3: Asia Pacific: Coconut Water Market Forecast: Breakup by Flavor (in Million US$), 2021-2026
Table 4: Asia Pacific: Coconut Water Market Forecast: Breakup by Form (in Million US$), 2021-2026
Table 5: Asia Pacific: Coconut Water Market Forecast: Breakup by Packaging (in Million US$), 2021-2026
Table 6: Asia Pacific: Coconut Water Market Forecast: Breakup by Distribution Channel (in Million US$), 2021-2026
Table 7: Asia Pacific: Coconut Water Market Forecast: Breakup by Country (in Million US$), 2021-2026
Table 8: Asia Pacific: Coconut Water Market: Competitive Structure
Table 9: Asia Pacific: Coconut Water Market: Key Players