
Asia Pacific Digital OOH Advertising Market Size, Share, Trends and Forecast by Format Type, Application, End Use Industry, and Country, 2026-2034
Market Overview:
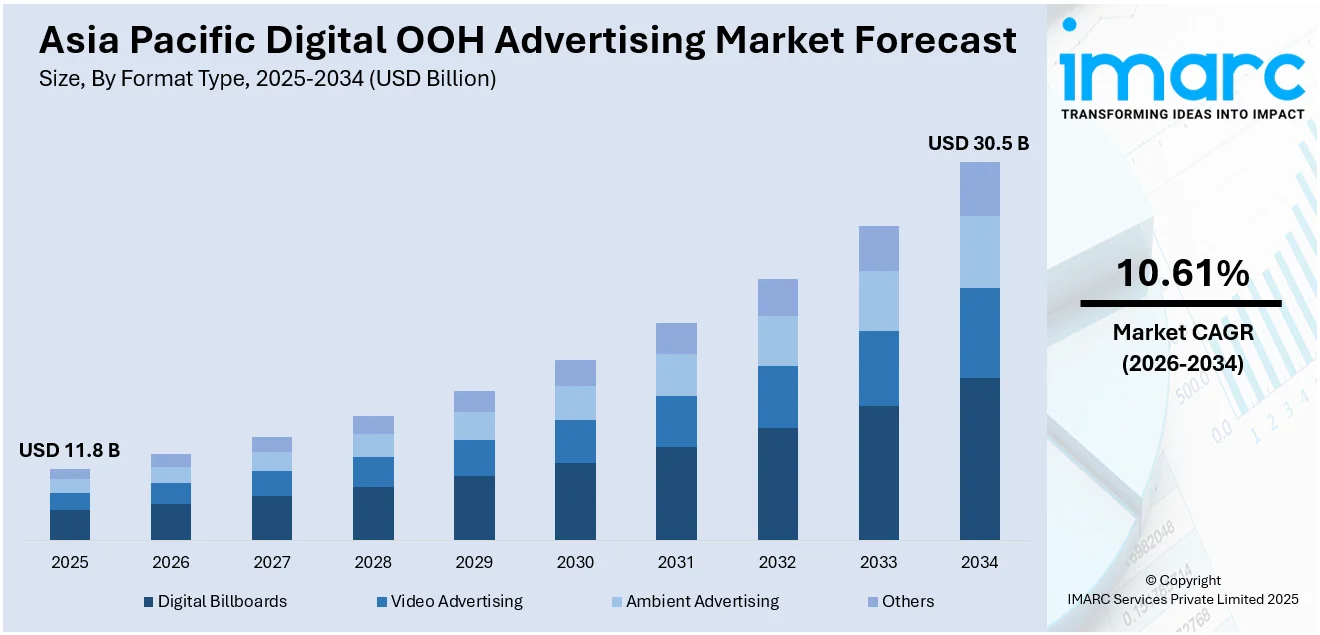
The Asia Pacific digital OOH advertising market size reached USD 11.8 Billion in 2025. Looking forward, IMARC Group expects the market to reach USD 30.5 Billion by 2034, exhibiting a growth rate (CAGR) of 10.61% during 2026-2034.
|
Report Attribute
|
Key Statistics
|
|---|---|
|
Base Year
|
2025
|
|
Forecast Years
|
2026-2034
|
|
Historical Years
|
2020-2025
|
|
Market Size in 2025
|
USD 11.8 Billion |
|
Market Forecast in 2034
|
USD 30.5 Billion |
| Market Growth Rate 2026-2034 | 10.61% |
Digital OOH (out-of-home) advertising is used as a dynamic communication medium to advertise products or communicate information to the public. It is generally installed in public places, such as airports, railway stations, bus shelters, shopping malls and roadways. It is also used in indoor spaces, such as medical waiting rooms, retail stores and movie theatres. At present, digital OOH advertising is gaining traction in the Asia Pacific region on account of rapid urbanization and the rising penetration of advanced technologies.
To get more information on this market Request Sample
The increasing number of commercial spaces, along with the rising number of individuals spending their time outdoors, represents one of the key factors impelling the market growth in the Asia Pacific region. Apart from this, with the increasing internet penetration, digital and internet-based advertising platforms are emerging, which is positively impacting the market growth in the region. Furthermore, the growing popularity of digital billboards is also bolstering the market growth. Moreover, advertisers are using virtual screens, projectors, motion graphics and video content to target specific demographics. They are also focusing on developing screens that deliver contextually relevant, intelligent and real-time content, which is anticipated to influence the market positively in the coming years.
Key Market Segmentation:
IMARC Group provides an analysis of the key trends in each sub-segment of the Asia Pacific digital OOH advertising market report, along with forecasts at the regional and country level from 2026-2034. Our report has categorized the market based on format type, application and end use industry.
Breakup by Format Type:
- Digital Billboards
- Video Advertising
- Ambient Advertising
- Others
Breakup by Application:
Access the comprehensive market breakdown Request Sample
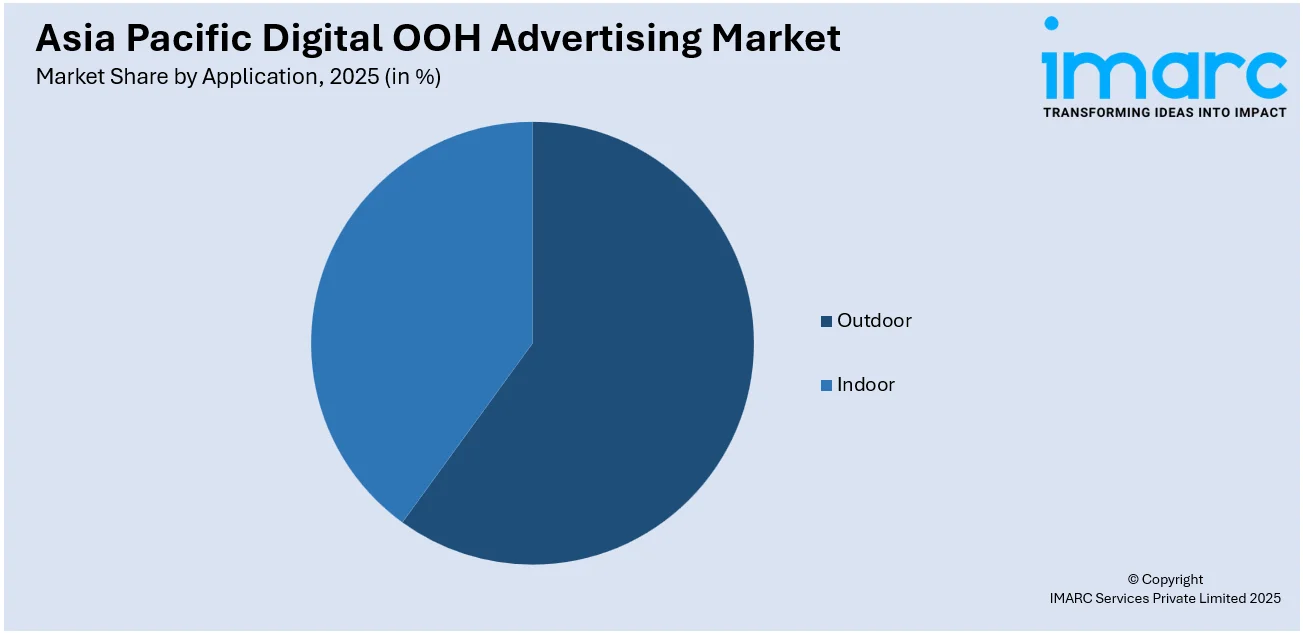
- Outdoor
- Indoor
Breakup by End Use Industry:
- Retail
- Recreation
- Banking
- Transportation
- Education
- Others
Breakup by Country:
- China
- Japan
- India
- South Korea
- Australia
- Indonesia
- Others
Competitive Landscape:
The competitive landscape of the industry has also been examined along with the profiles of the key players.
Report Coverage:
| Report Features | Details |
|---|---|
| Base Year of the Analysis | 2025 |
| Historical Period | 2020-2025 |
| Forecast Period | 2026-2034 |
| Units | Billion USD |
| Segment Coverage | Format Type, Application, End Use Industry, Country |
| Countries Covered | China, Japan, India, South Korea, Australia, Indonesia, Others |
| Customization Scope | 10% Free Customization |
| Post-Sale Analyst Support | 10-12 Weeks |
| Delivery Format | PDF and Excel through Email (We can also provide the editable version of the report in PPT/Word format on special request) |
Frequently Asked Questions About the Asia Pacific Digital OOH Advertising Market Research Report and Industry Forecast Report
The Asia Pacific digital OOH advertising market was valued at USD 11.8 Billion in 2025.
We expect the Asia Pacific digital OOH advertising market to exhibit a CAGR of 10.61% during 2026-2034.
The rising penetration of numerous advanced technologies, such as Near Field Communication (NFC) and artificial intelligence to generate real-time viewership analytics, is primarily driving the Asia Pacific digital OOH advertising market.
The sudden outbreak of the COVID-19 pandemic has led to the increasing utilization of digital and internet-based advertising platforms by several industrial verticals using virtual screens, projectors, video content, etc., for remotely targeting specific demographics across the Asia Pacific region.
Based on the format type, the Asia Pacific digital OOH advertising market can be categorized into digital billboards, video advertising, ambient advertising, and others. Among these, digital billboards account for the majority of the total market share.
Based on the application, the Asia Pacific digital OOH advertising market has been segregated into outdoor and indoor, where outdoor holds the largest market share.
Based on the end use industry, the Asia Pacific digital OOH advertising market can be bifurcated into retail, recreation, banking, transportation, education, and others. Currently, the retail sector exhibits a clear dominance in the market.
On a regional level, the market has been classified into China, Japan, India, South Korea, Australia, Indonesia, and others, where China currently dominates the Asia Pacific digital OOH advertising market.
Need more help?
- Speak to our experienced analysts for insights on the current market scenarios.
- Include additional segments and countries to customize the report as per your requirement.
- Gain an unparalleled competitive advantage in your domain by understanding how to utilize the report and positively impacting your operations and revenue.
- For further assistance, please connect with our analysts.
 Request Customization
 Speak to an Analyst
 Request Brochure
 Inquire Before Buying
Benefits of Customization
- Personalize this research
- Triangulate with your data
- Get data as per your format and definition
- Gain a deeper dive into a specific application, geography, customer, or competitor
- Any level of personalization
Get in Touch With Us
UNITED STATES
Phone: +1-201-971-6302
INDIA
Phone: +91-120-433-0800
UNITED KINGDOM
Phone: +44-753-714-6104
Email: [email protected]
Client Testimonials


.webp)


