
Asia Pacific Footwear Market Size, Share, Trends and Forecast by Product, Material, Distribution Channel, Pricing, End User, and Country, 2026-2034
Asia Pacific Footwear Market Summary:
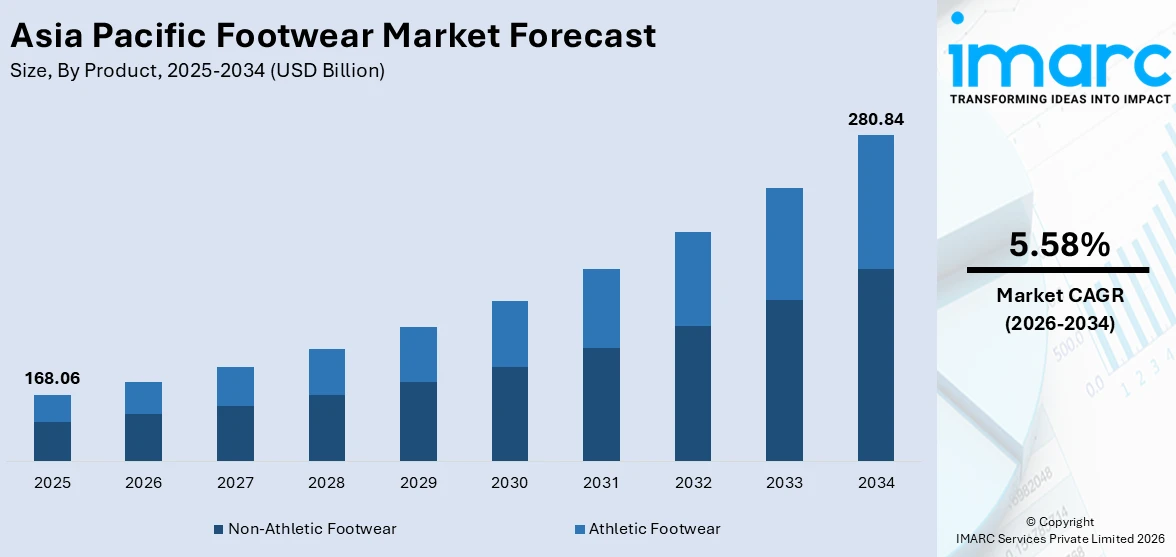
The Asia Pacific footwear market size was valued at USD 168.06 Billion in 2025 and is projected to reach USD 280.84 Billion by 2034, growing at a compound annual growth rate of 5.58% from 2026-2034.
The market is driven by rising disposable incomes, rapid urbanization, and increasing consumer preference for fashionable and functional footwear across the region. Growing health and fitness awareness is boosting demand for athletic and athleisure products, while expanding e-commerce platforms are broadening consumer access. Additionally, the influence of social media on fashion trends and rising demand for sustainable and eco-friendly footwear options are reshaping purchasing behaviour, further strengthening the Asia Pacific footwear market share.
Key Takeaways and Insights:
- By Product: Non-athletic footwear dominates the market with a share of 55% in 2025, driven by the increasing adoption of casual and formal footwear styles across workplaces, social settings, and everyday consumer wardrobes.
- By Material: Rubber leads the market with a share of 30% in 2025, owing to its widespread use in both athletic and non-athletic footwear due to superior durability, flexibility, and cost-effectiveness in manufacturing.
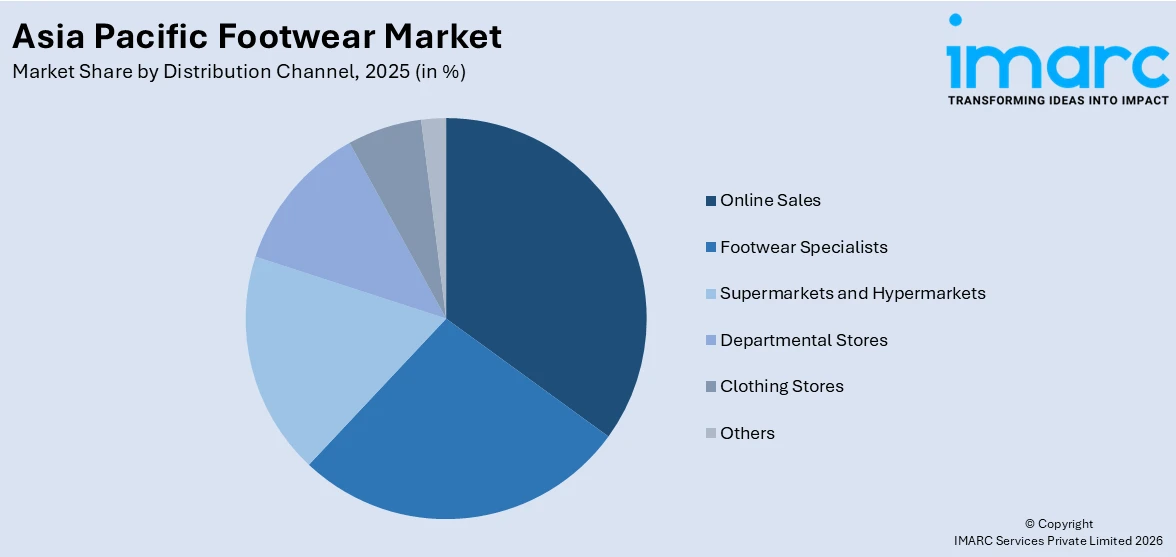
- By Distribution Channel: Online sales represent the largest segment with a market share of 33% in 2025, driven by the rapid expansion of e-commerce platforms, increased smartphone penetration, and growing consumer preference for digital shopping experiences.
- By Pricing: Mass dominates the market with a share of 64% in 2025, owing to the region’s large price-sensitive consumer base that prioritizes affordable and value-oriented footwear products for daily use.
- By End User: Women represent the market segment with a share of 42% in 2025, driven by the growing female workforce, evolving fashion consciousness, and an expanding range of stylish and comfortable footwear options.
- Key Players: The Asia Pacific footwear market features a highly competitive landscape, with global manufacturers and regional brands intensifying product innovation, expanding distribution networks, investing in sustainable materials, and forming strategic partnerships to strengthen market positioning and capture growing consumer demand.
To get more information on this market Request Sample
The Asia Pacific footwear market is experiencing significant momentum as evolving consumer lifestyles, expanding middle-class populations, and increased emphasis on wellness and fitness drive product demand across diverse categories. As per sources, in 2025, Japanese sportswear brand ASICS announced plans to boost local footwear manufacturing in India from 30% to 40% to comply with new quality regulations and expand retail presence, underscoring how regulatory shifts are shaping manufacturing strategies and supply chains in the region. The region's footwear industry benefits from a robust manufacturing ecosystem, with several countries collectively serving as global production hubs due to abundant labor availability and cost-effective raw material sourcing. Growing integration of advanced technologies in product design, coupled with increasing consumer interest in personalized and performance-oriented footwear, continues to reshape market dynamics. The expanding penetration of digital retail channels and the influence of social media on purchasing behavior are further accelerating market expansion.
Asia Pacific Footwear Market Trends:
Rising Demand for Sustainable and Eco-Friendly Footwear
Environmental awareness is gaining significant traction among Asia Pacific consumers, particularly younger demographics, driving demand for footwear made from recycled, organic, and biodegradable materials. In February 2025, Metro Brands Limited launched a sustainability campaign in India to highlight footwear recycling and champion responsible consumption, addressing waste and promoting eco‑friendly practices across its retail network. Manufacturers across the region are increasingly adopting sustainable production methods, including the use of recycled plastics, plant-based fibers, and low-emission manufacturing processes. Brands are investing in circular design principles that enable disassembly and recycling of footwear components at end of life.
Expansion of Direct-to-Consumer and Digital Commerce Channels
The proliferation of online retail platforms, social commerce, and mobile-first shopping experiences is transforming footwear distribution across Asia Pacific. Consumers are increasingly purchasing through digital channels that offer convenience, wide product selection, and personalized recommendations driven by artificial intelligence. Brands are strengthening their direct-to-consumer strategies and partnering with quick-commerce platforms to offer faster delivery options. Augmented reality virtual try-on tools and size recommendation engines are enhancing the online shopping experience, reducing return rates and improving customer satisfaction across diverse regional markets.
Growth of Performance and Athleisure Footwear Categories
Increasing participation in fitness activities, recreational running, and outdoor sports is propelling demand for performance-oriented and athleisure footwear across the Asia Pacific region. Consumers are seeking versatile products that blend athletic functionality with lifestyle fashion, suitable for both exercise and everyday wear. In November 2025, more than 13,000 runners participated in the Garmin Run Asia Series 2025 across multiple Asia Pacific countries, underscoring the rising engagement in organized fitness events and running culture. This trend is particularly prominent in urban markets where active living and casual dressing have become deeply embedded in consumer culture. The growing popularity of grassroots sporting events, community fitness programs, and organized wellness initiatives is further reinforcing consumer interest in performance footwear across diverse demographic groups.
Market Outlook 2026-2034:
Asia Pacific footwear market revenue is expected to continue its growth trajectory in the near future, driven by positive demographics, growing urbanization, and improving consumer spending on lifestyle and wellness-related products. The penetration of digital retail channels, along with improving manufacturers focus on product innovations and sustainable manufacturing, is likely to generate significant revenue growth opportunities in the Asia Pacific footwear market. Moreover, improving government support for domestic manufacturing, growing middle-class consumers in emerging markets, and the overall popularity of athleisure footwear are likely to improve market revenue in the Asia Pacific region. The market generated a revenue of USD 168.06 Billion in 2025 and is projected to reach a revenue of USD 280.84 Billion by 2034, growing at a compound annual growth rate of 5.58% from 2026-2034.
Asia Pacific Footwear Market Report Segmentation:
| Segment Category | Leading Segment | Market Share |
|---|---|---|
|
Product |
Non-Athletic Footwear |
55% |
|
Material |
Rubber |
30% |
|
Distribution Channel |
Online Sales |
33% |
|
Pricing |
Mass |
64% |
|
End User |
Women |
42% |
Product Insights:
- Non-Athletic Footwear
- Athletic Footwear
Non-athletic footwear dominates with a market share of 55% of the total Asia Pacific footwear market in 2025.
The non-athletic footwear encompasses a broad range of products including casual shoes, sandals, boots, loafers, and formal footwear that cater to everyday consumer requirements. The growing acceptance of casual dress codes in professional environments across the region has significantly propelled demand for versatile non-athletic footwear. In July 2025, after a global controversy over design credit, Indian footwear artisans and local brands reported a surge in sales of traditional and ethnic sandals, tapping into rising domestic and regional fashion pride, boosting interest in culturally rooted non‑athletic styles across Asia Pacific markets. Additionally, evolving fashion trends influenced by social media and digital marketing campaigns are encouraging consumers to invest in stylish footwear for social and professional settings.
This segment is further boosted by the presence of a large working-age population and growing middle-class demographics in the region, thereby providing a market for a range of formal and semi-formal non-athletic footwear products. The growing affluence in emerging markets is helping consumers move from basic to branded non-athletic footwear products. The rise of e-commerce has further expanded the market for premium non-athletic footwear, enabling consumers in lower-tier cities and rural markets to benefit from premium product offerings that were traditionally restricted to metropolitan cities.
Material Insights:
- Rubber
- Leather
- Plastic
- Fabric
- Others
Rubber leads with a share of 30% of the total Asia Pacific footwear market in 2025.
Rubber remains the preferred material for footwear manufacturing across Asia Pacific due to its exceptional durability, weather resistance, and flexibility, making it suitable for both athletic and everyday footwear applications. The material's cost-effectiveness in large-scale production further supports its widespread adoption among manufacturers targeting the mass-market segment. Natural rubber production is well-established across several Southeast Asian countries, providing a reliable and affordable supply chain for regional manufacturers. Ongoing advancements in rubber compounding technologies are enabling the development of lighter and more responsive outsole formulations, enhancing product performance across multiple footwear categories.
The segment is further complemented by advancements in the processing of rubber materials that allow for the creation of environmentally sustainable forms of rubber using recycled and bio-based materials. Recycled rubber is gaining traction as a material in response to consumer demand for sustainable products and regulatory demands for reducing waste in manufacturing processes. The use of rubber in both outsoles and midsoles continues to reinforce its importance in all forms of shoe types, from budget-friendly sandals to athletic shoes. The increased focus on sustainable manufacturing practices is also driving recycling efforts for rubber in regional supply chains.
Distribution Channel Insights:
Access the comprehensive market breakdown Request Sample
- Footwear Specialists
- Online Sales
- Supermarkets and Hypermarkets
- Departmental Stores
- Clothing Stores
- Others
Online sales exhibit clear dominance with a 33% share of the total Asia Pacific footwear market in 2025.
The rapid expansion of e-commerce infrastructure, increasing internet penetration, and growing smartphone adoption across Asia Pacific have positioned online sales as the dominant distribution channel for footwear products. Digital platforms offer consumers the convenience of browsing extensive product catalogs, comparing prices, and accessing exclusive online discounts, which has accelerated the shift from traditional brick-and-mortar purchasing patterns. As per sources, a DHL 2025 E‑Commerce Trends Report found that 81% of Asia Pacific shoppers now expect AI‑powered shopping tools such as virtual try‑ons and smart assistants as standard parts of their digital retail experience, highlighting how online engagement and personalized tech are reshaping shopping behaviours. Social commerce and live-streaming sales events have further enhanced online engagement, particularly across East Asian and Southeast Asian consumer markets.
Brands are also investing in augmented reality virtual try-on tools, size recommendation tools, and omnichannel experiences to reduce return rates and increase customer satisfaction for the online channel. The launch of quick commerce delivery options, which provide footwear delivery within hours, is also generating further traction for online sales within key metropolitan cities. The expansion of digital payment options, including buy-now, pay-later options, is also helping remove barriers for consumers, increasing average order values, and supporting the online channel.
Pricing Insights:
- Premium
- Mass
Mass leads with a market share of 64% of the total Asia Pacific footwear market in 2025.
The mass benefits from Asia Pacific's large population base and predominantly price-sensitive consumer demographic, particularly in emerging economies where affordable footwear remains a daily necessity. Manufacturers and retailers operating in this segment leverage high-volume production capabilities and cost-efficient supply chains to deliver competitively priced products that meet everyday functional and fashion requirements. Several countries across the region serve as both major production and consumption centers for mass-market footwear. The expansion of organized retail and franchise-driven store networks into smaller cities and towns has further strengthened the accessibility and reach of mass-priced footwear.
The mass market segment is also experiencing the benefits of the growing availability of affordable branded footwear, facilitated by organized retail and digital channels, thereby providing consumers with wider access to branded footwear, rather than just the traditional unorganized markets. Regional manufacturers and domestic brands have been able to leverage their understanding of the market and consumers to sustain strong competitive positions in the market. Moreover, the government initiatives in promoting domestic footwear manufacturing and reducing dependency on imports are further helping the overall ecosystem for mass market consumers. The rise in digital penetration in lower-tier markets is helping mass market brands reach underserved consumer segments.
End User Insights:
- Men
- Women
- Kids
Women dominate with a market share of 42% of the total Asia Pacific footwear market in 2025.
Women have emerged as the leading end-user category, driven by the growing female workforce, rising disposable incomes among women, and an increasing emphasis on fashion and personal grooming across the region. Women consumers demonstrate higher engagement with fashion trends influenced by social media platforms and digital marketing campaigns, which drives frequent purchases across diverse footwear styles ranging from sneakers and sandals to formal heels and boots. The growing participation of women in fitness and outdoor activities is also expanding the range of footwear categories that appeal to female consumers.
The segment is also propelled by the increasing availability of women-specific footwear designs that address comfort, style, and performance needs simultaneously. The expansion of athleisure options for women, combined with growing awareness of foot health and ergonomic design, has broadened the product range within this segment. Manufacturers are also responding to demand for inclusive sizing and sustainable materials, further strengthening the appeal of women's footwear across premium and mass-market categories. The influence of fashion influencers and brand collaborations targeting female consumers continues to accelerate purchasing frequency and brand loyalty within the segment.
Country Insights:
- China
- Japan
- India
- South Korea
- Australia
- Indonesia
- Others
China represents the largest national market within the Asia Pacific footwear industry, supported by its massive consumer base, robust manufacturing infrastructure, and rapidly expanding digital commerce ecosystem. The country's sportswear and casual footwear segments continue to grow, with domestic brands strengthening their competitive positions against international players through innovation, cultural branding, and aggressive retail expansion strategies. Rising consumer preference for athleisure and performance footwear is further reinforcing demand.
Japan maintains its position as a mature and quality-focused footwear market, driven by high consumer expectations for product craftsmanship, comfort technology, and trend-conscious design. The growing emphasis on work-life balance and casual workplace dressing has boosted demand for versatile non-athletic footwear. Additionally, increasing interest in outdoor recreational activities and wellness-oriented lifestyles is generating sustained demand for performance and walking footwear categories across diverse demographics.
India represents one of the fastest-growing footwear markets in the Asia Pacific region, supported by favorable demographics, increasing urbanization, and strong government backing for domestic manufacturing. The expanding middle class and rising disposable incomes are enabling consumers to shift from unbranded to organized and premium footwear options. The rapid growth of e-commerce and franchise-led retail expansion into smaller cities is further broadening market accessibility.
South Korea is emerging as a key innovation and design hub within the Asia Pacific footwear landscape, driven by a fashion-forward consumer base and advanced manufacturing technologies. The country's strong digital infrastructure supports thriving online and social commerce channels for footwear sales. Consumer demand for premium sneakers, designer collaborations, and technologically advanced performance footwear continues to shape the competitive dynamics of the market.
Australia represents a mature and brand-conscious footwear market characterized by strong consumer preference for premium, comfortable, and sustainably produced footwear products. The growing emphasis on outdoor activities, fitness culture, and active lifestyles is driving demand for athletic and performance footwear categories. Additionally, increasing awareness of environmental sustainability is encouraging consumers to favor eco-friendly footwear brands that align with responsible consumption values across the market.
Indonesia is witnessing rapidly growing footwear demand, driven by its large and youthful population, increasing urbanization, and rising disposable incomes across emerging urban centers. The country also serves as a significant global footwear manufacturing hub, attracting foreign investments in production facilities. Expanding digital commerce penetration and growing consumer awareness of branded footwear options are further accelerating market growth across both athletic and non-athletic product segments.
Others include several emerging and developing economies across the Asia Pacific region that are experiencing growing footwear demand driven by rising incomes, expanding urban populations, and increasing exposure to global fashion trends. Countries across Southeast Asia and the broader Pacific are witnessing improved retail infrastructure and digital commerce adoption, creating new growth opportunities. Government support for local manufacturing and trade facilitation initiatives is further strengthening footwear market development across these markets.
Market Dynamics:
Growth Drivers:
Why is the Asia Pacific Footwear Market Growing?
Rapid Urbanization and Rising Disposable Incomes Across Emerging Economies
The Asia Pacific region is witnessing unprecedented urbanization, with vast numbers of consumers migrating to urban centers and experiencing improved living standards. This demographic transformation is fundamentally reshaping footwear consumption patterns, as urban consumers demonstrate higher spending capacity and greater brand awareness compared to their rural counterparts. In November 2025, a NielsenIQ and Bain & Company report highlighted that consumer spending in Southeast Asia is projected to grow by about 8% annually over the next decade, driven by rising affluence and urbanization, fueling demand for quality and premium products across categories. Rising disposable incomes across major emerging markets are enabling consumers to transition from basic, unbranded footwear to premium and branded products that offer enhanced comfort, durability, and style.
Favorable Government Policies and Growing Domestic Manufacturing Support
Governments across the Asia Pacific region are implementing supportive policies to strengthen domestic footwear manufacturing capabilities, attract foreign direct investment, and reduce reliance on imported products. Initiatives promoting local production, trade facilitation measures, and infrastructure development programs are creating a favorable business environment for footwear manufacturers. Regulatory frameworks encouraging quality standardization and intellectual property protection are further enhancing industry credibility. These policy-driven efforts are enabling both established and emerging manufacturers to scale operations, improve production efficiency, and expand their reach across domestic and international markets, contributing to sustained industry growth.
Expanding Retail Infrastructure and Penetration into Lower-Tier Markets
The continued expansion of organized retail networks, shopping malls, and branded exclusive outlets across Asia Pacific is significantly improving consumer access to diverse footwear products. Franchise-driven retail models are enabling brands to penetrate smaller cities and semi-urban areas that were previously underserved by organized footwear retail. In October 2025, Bata India announced it is poised to cross the 2,000 mark by December 2025, becoming the first major footwear retailer in the country to reach this milestone, reflecting strong physical retail expansion in Asia Pacific markets. The development of modern trade channels, combined with improving logistics and distribution infrastructure, is bridging the gap between metropolitan and rural consumer markets.
Market Restraints:
What Challenges the Asia Pacific Footwear Market is Facing?
Counterfeit Products and Intellectual Property Infringement
The widespread proliferation of counterfeit footwear products across Asia Pacific markets poses a significant challenge to legitimate manufacturers and brands. Counterfeit products undermine brand value, erode consumer trust, and reduce revenue potential for established players. The ease of distributing fake products through online marketplaces and informal retail channels makes enforcement particularly difficult across the region.
Volatile Raw Material Prices and Supply Chain Disruptions
Fluctuations in the prices of key raw materials including rubber, leather, synthetic polymers, and petroleum-based derivatives create cost pressures for footwear manufacturers. These price variations can compress profit margins and force price adjustments that impact consumer affordability. Supply chain vulnerabilities related to logistics disruptions, trade policy uncertainties, and geopolitical tensions further add complexity to manufacturing and distribution operations.
Intensifying Competition and Market Saturation in Mature Segments
The Asia Pacific footwear market is characterized by intense competition among a large number of global and regional players, which can lead to price wars, margin compression, and oversaturation in certain product categories. Established brands face growing pressure from agile domestic competitors and emerging direct-to-consumer brands that leverage cost advantages and digital marketing capabilities effectively.
Competitive Landscape:
The Asia Pacific footwear market is characterized by a dynamic and highly competitive environment, where global corporations compete alongside well-established regional brands and emerging domestic players. Manufacturers are focusing on diversifying product portfolios, investing in research and development, and leveraging digital transformation to enhance consumer engagement. Strategic partnerships, celebrity endorsements, and investments in sustainable manufacturing practices are increasingly shaping competitive strategies. The expansion of direct-to-consumer channels and investments in supply chain optimization are enabling brands to improve operational efficiency, respond rapidly to evolving consumer preferences, and strengthen their competitive positioning across both premium and mass-market segments. Additionally, domestic brands are gaining momentum by leveraging cultural relevance, localized marketing strategies, and competitive pricing to challenge established international players across the region.
Recent Developments:
- In March 2024, Perfitt, a Seoul-based Fit Tech startup, launched its AI-powered size recommendation tool, PerfittSize, on ABC Mart’s DTC website. By partnering with Korea’s largest footwear retailer, it personalizes online shoe shopping, reduces returns, and supports services like Prospect’s OneSpec, targeting enhanced eCommerce and APAC market growth by 2025.
Asia Pacific Footwear Market Report Scope:
| Report Features | Details |
|---|---|
| Base Year of the Analysis | 2025 |
| Historical Period | 2020-2025 |
| Forecast Period | 2026-2034 |
| Units | Billion USD |
| Scope of the Report |
Exploration of Historical Trends and Market Outlook, Industry Catalysts and Challenges, Segment-Wise Historical and Future Market Assessment:
|
| Products Covered | Non-Athletic Footwear, Athletic Footwear |
| Materials Covered | Rubber, Leather, Plastic, Fabric, Others |
| Distribution Channels Covered | Footwear Specialists, Online Sales, Supermarkets and Hypermarkets, Departmental Stores, Clothing Stores, Others |
| Pricings Covered | Premium, Mass |
| End Users Covered | Men, Women, Kids |
| Countries Covered | China, Japan, India, South Korea, Australia, Indonesia, Others |
| Customization Scope | 10% Free Customization |
| Post-Sale Analyst Support | 10-12 Weeks |
| Delivery Format | PDF and Excel through Email (We can also provide the editable version of the report in PPT/Word format on special request) |
Frequently Asked Questions About the Asia Pacific Footwear Market Report
The Asia Pacific footwear market size was valued at USD 168.06 Billion in 2025.
The Asia Pacific footwear market is expected to grow at a compound annual growth rate of 5.58% from 2026-2034 to reach USD 280.84 Billion by 2034.
Non-athletic footwear held the largest Asia Pacific footwear market share, driven by widespread adoption of casual and formal styles across diverse professional and social settings, evolving workplace dress codes favoring comfort, and growing consumer preference for versatile everyday footwear options.
Key factors driving the Asia Pacific footwear market include rapid urbanization, rising disposable incomes, expanding e-commerce platforms, growing health and fitness consciousness, increasing demand for sustainable footwear, and favorable government support for domestic manufacturing.
Major challenges include widespread counterfeit products undermining brand value, volatile raw material prices impacting manufacturing costs, intense market competition causing margin compression, supply chain vulnerabilities, and inconsistent regulatory frameworks across different countries.
Need more help?
- Speak to our experienced analysts for insights on the current market scenarios.
- Include additional segments and countries to customize the report as per your requirement.
- Gain an unparalleled competitive advantage in your domain by understanding how to utilize the report and positively impacting your operations and revenue.
- For further assistance, please connect with our analysts.
 Request Customization
 Speak to an Analyst
 Request Brochure
 Inquire Before Buying
Benefits of Customization
- Personalize this research
- Triangulate with your data
- Get data as per your format and definition
- Gain a deeper dive into a specific application, geography, customer, or competitor
- Any level of personalization
Get in Touch With Us
UNITED STATES
Phone: +1-201-971-6302
INDIA
Phone: +91-120-433-0800
UNITED KINGDOM
Phone: +44-753-714-6104
Email: [email protected]
Client Testimonials


.webp)


