
Asia Pacific Neoprene Market Size, Share, Trends and Forecast by Manufacturing Route, Grade, Application, End User, and Country, 2026-2034
Market Overview:
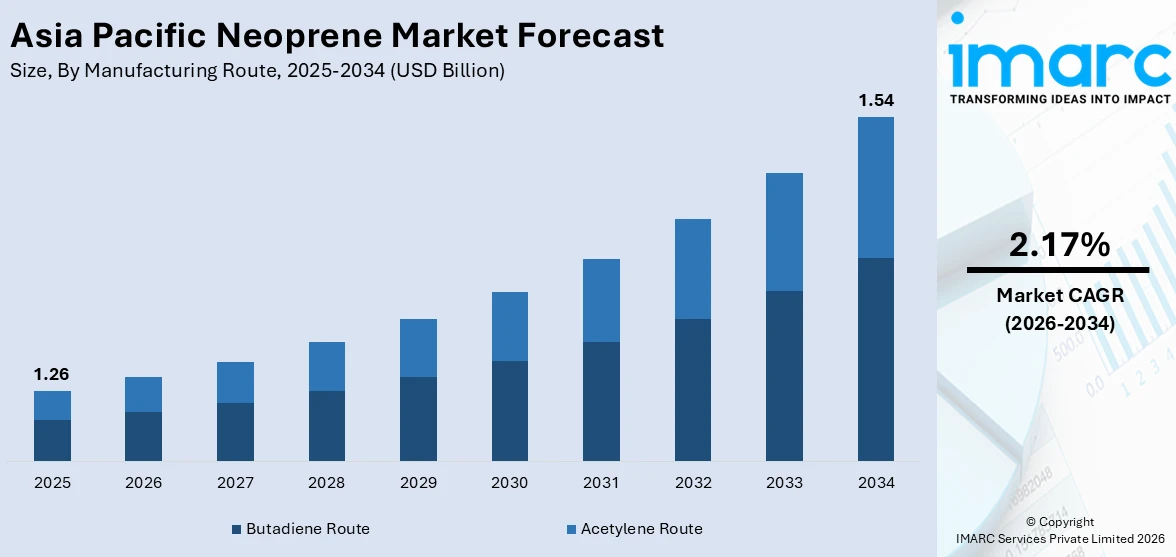
The Asia Pacific neoprene market size reached USD 1.26 Billion in 2025. Looking forward, IMARC Group expects the market to reach USD 1.54 Billion by 2034, exhibiting a growth rate (CAGR) of 2.17% during 2026-2034.
|
Report Attribute
|
Key Statistics
|
|---|---|
|
Base Year
|
2025
|
|
Forecast Years
|
2026-2034
|
|
Historical Years
|
2020-2025
|
|
Market Size in 2025
|
USD 1.26 Billion |
|
Market Forecast in 2034
|
USD 1.54 Billion |
| Market Growth Rate 2026-2034 | 2.17% |
Neoprene is a synthetic rubber widely utilized as a substitute for natural latex rubber. It provides protection against oxidizing agents, such as alcohol, oil and acids. Moreover, as it offers resistance from acetonic solvents, it finds application in the automotive and construction industries. At present, rapid industrialization is positively influencing the demand for neoprene in the Asia Pacific region.
To get more information on this market Request Sample
The increasing number of tire manufacturing plants, along with the flourishing automotive sector, represents one of the significant factors propelling the growth of the neoprene market in the Asia Pacific region. Neoprene is utilized in the automotive industry to manufacture tires, oil seals, braking and steering system components, hose covers and power transmission belts. Moreover, economic growth and rising construction activities, especially in the residential and commercial sectors, are driving the market further. However, the market is experiencing a decline on account of the rapid increase in the coronavirus disease (COVID-19) cases and lockdowns imposed in different parts of the region to prevent the spread of the pandemic. The market will experience growth when lockdown restrictions are uplifted in the region.
Key Market Segmentation:
IMARC Group provides an analysis of the key trends in each segment of the Asia Pacific neoprene market report, along with forecasts at the regional and country levels from 2026-2034. Our report has categorized the market based on manufacturing route, grade, application and end user.
Breakup by Manufacturing Route:
- Butadiene Route
- Acetylene Route
Breakup by Grade:
- General-Purpose Grade Neoprene
- Pre-Crosslinked Grade Neoprene
- Sulfer-Modified Grade Neoprene
- Slow Crystallizing Grade Neoprene
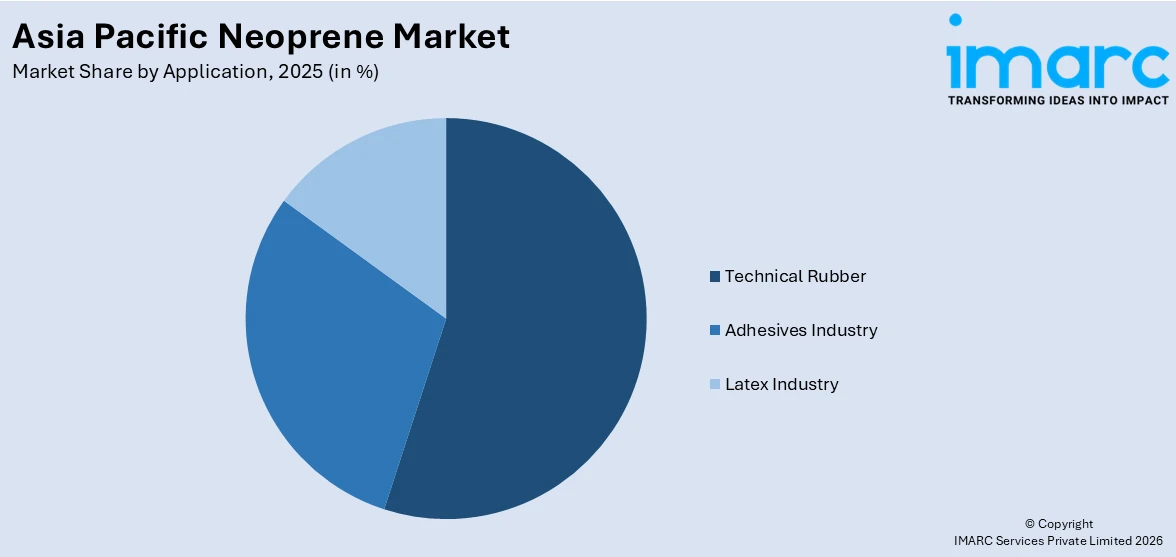
Breakup by Application:
Access the comprehensive market breakdown Request Sample
- Technical Rubber
- Adhesives Industry
- Latex Industry
Breakup by End User:
- Automotive
- Manufacturing
- Consumer goods
- Medical
Breakup by Country:
- China
- Japan
- India
- South Korea
- Australia
- Indonesia
- Others
Competitive Landscape:
The competitive landscape of the industry has also been examined along with the profiles of the key players.
Report Coverage:
| Report Features | Details |
|---|---|
| Base Year of the Analysis | 2025 |
| Historical Period | 2020-2025 |
| Forecast Period | 2026-2034 |
| Units | Billion USD |
|
Scope of the Report
|
Exploration of Historical and Forecast Trends, Industry Catalysts and Challenges, Segment-Wise Historical and Predictive Market Assessment:
|
| Manufacturing Routes Covered | Butadiene Route, Acetylene Route |
| Grades Covered | General-Purpose Grade Neoprene, Pre-Crosslinked Grade Neoprene, Sulfer-Modified Grade Neoprene, Slow Crystallizing Grade Neoprene |
| Applications Covered | Technical Rubber, Adhesives Industry, Latex Industry |
| End Users Covered | Automotive, Manufacturing, Consumer goods, Medical |
| Countries Covered | China, Japan, India, South Korea, Australia, Indonesia, Others |
| Customization Scope | 10% Free Customization |
| Post-Sale Analyst Support | 10-12 Weeks |
| Delivery Format | PDF and Excel through Email (We can also provide the editable version of the report in PPT/Word format on special request) |
Key Questions Answered in This Report:
- How has the Asia Pacific neoprene market performed so far and how will it perform in the coming years?
- What has been the impact of COVID-19 on the Asia Pacific neoprene market?
- What are the key regional markets?
- What is the breakup of the market based on the manufacturing route?
- What is the breakup of the market based on the grade?
- What is the breakup of the market based on the application?
- What is the breakup of the market based on the end user?
- What are the various stages in the value chain of the industry?
- What are the key driving factors and challenges in the industry?
- What is the structure of the Asia Pacific neoprene market and who are the key players?
- What is the degree of competition in the industry?
Need more help?
- Speak to our experienced analysts for insights on the current market scenarios.
- Include additional segments and countries to customize the report as per your requirement.
- Gain an unparalleled competitive advantage in your domain by understanding how to utilize the report and positively impacting your operations and revenue.
- For further assistance, please connect with our analysts.
 Request Customization
 Speak to an Analyst
 Request Brochure
 Inquire Before Buying
Benefits of Customization
- Personalize this research
- Triangulate with your data
- Get data as per your format and definition
- Gain a deeper dive into a specific application, geography, customer, or competitor
- Any level of personalization
Get in Touch With Us
UNITED STATES
Phone: +1-201-971-6302
INDIA
Phone: +91-120-433-0800
UNITED KINGDOM
Phone: +44-753-714-6104
Email: [email protected]
Client Testimonials


.webp)


