Market Overview:
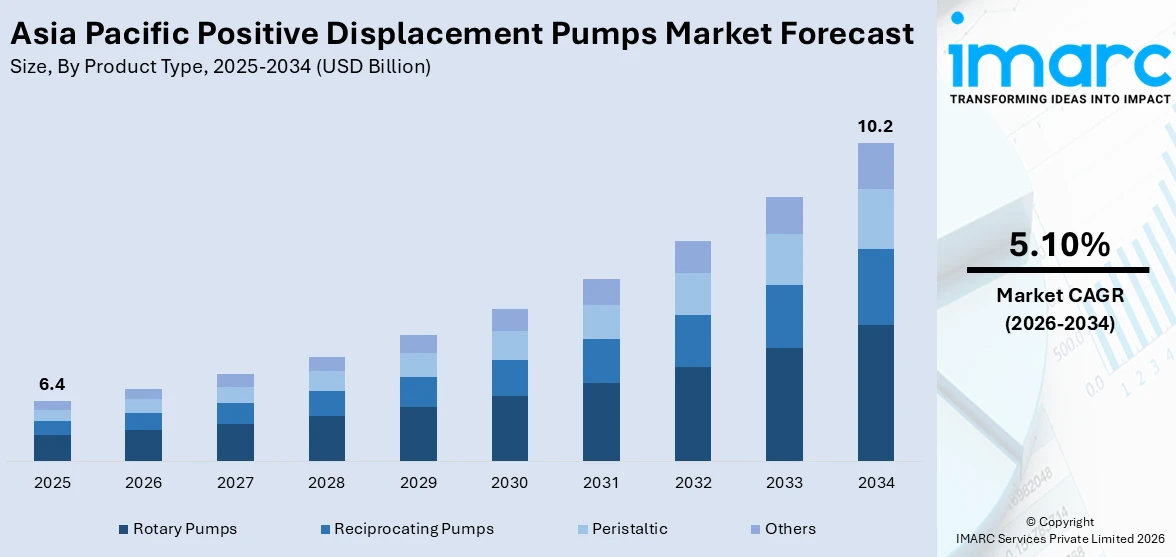
The Asia Pacific positive displacement pumps market is currently witnessing moderate growth. Positive displacement pumps (PDP), also known as constant flow machines, are used to transfer fluids, in either liquid, gas, or slurry form, through mechanical action. In this type of pump, the moving liquid is first captured in a cavity and then discharged, carried by a plunger or a piston. PDPs are equipped with a mounting cavity at the suction side and a shrinking cavity on the discharge side.
Asia Pacific represents one of the leading markets for positive displacement pumps. The primary factor driving the growth of the market is the extensive use of PDPs in water and wastewater treatment facilities. These pumps are compact in size, offer high viscosity performance and manage high differential pressure. Besides this, the upgradation and the renovation of oil and gas exploration facilities in the region are also expected to create a positive outlook for the market. Moreover, the rising concerns for limited water resources have prompted governments of several countries in the region, including China and India, to promote wastewater treatment and recycling. Furthermore, PDPs offer simpler installation with enhanced and effective outcomes while significantly reducing the carbon footprints, which, in turn, is further bolstering the market growth. On account of these factors, IMARC Group expects the market to continue its moderate growth during the forecast period (2020-2025).
Key Market Segmentation:
IMARC Group provides an analysis of the key trends in each sub-segment of the Asia Pacific positive displacement pumps market report, along with forecasts for growth at the region level from 2020-2025. Our report has categorized the market based on region, product type, capacity, pump characteristics, raw material and end use industry.
Breakup by Product Type:
- Rotary Pumps
- Vane
- Screw
- Lobe
- Gear
- Progressing Cavity (PC)
- Others
- Reciprocating Pumps
- Piston
- Diaphragm
- Plunger
- Others
- Peristaltic
- Others
Breakup by Capacity:
- Low Capacity Pumps
- Medium Capacity Pumps
- High Capacity Pumps
Breakup by Pump Characteristics:
- Standard Pumps
- Engineered Pumps
- Special Purpose Pumps
Breakup by Raw Material:
- Bronze
- Cast Iron
- Polycarbonate
- Stainless Steel
- Others
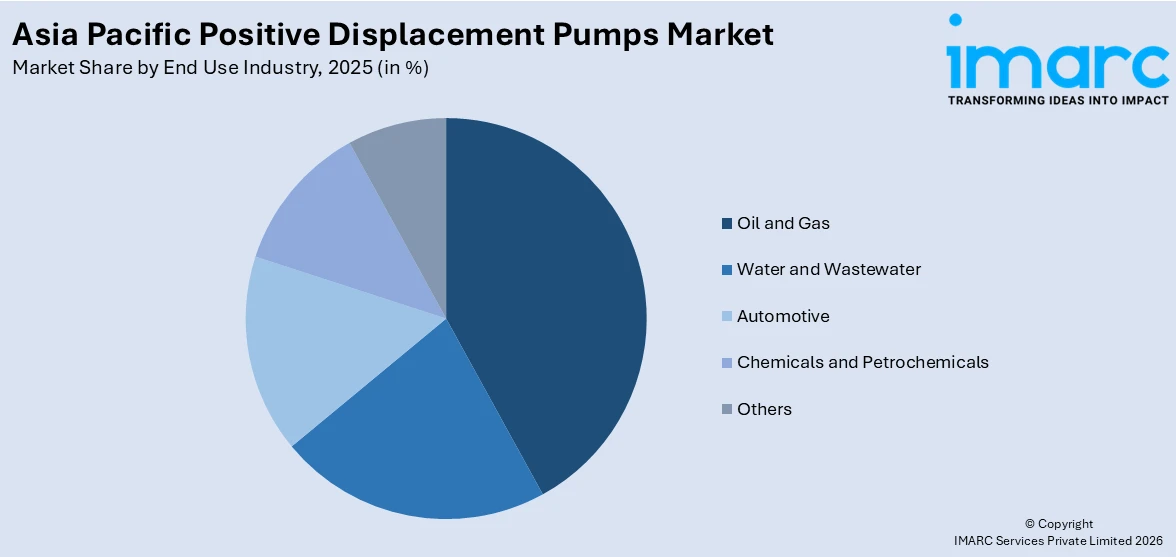
Breakup by End Use Industry:
- Oil and Gas
- Water and Wastewater
- Automotive
- Chemicals and Petrochemicals
- Others
Breakup by Country:
- China
- Japan
- India
- South Korea
- Australia
- Indonesia
- Others
Competitive Landscape:
The competitive landscape of the industry has also been examined along with the profiles of the key players.
Key Questions Answered in This Report:
- How has the Asia Pacific positive displacement pumps market performed so far and how will it perform in the coming years?
- What has been the impact of COVID-19 on the Asia Pacific positive displacement pumps market?
- What are the key regional markets?
- What is the breakup of the market based on the product type?
- What is the breakup of the market based on the capacity?
- What is the breakup of the market based on the pump characteristics?
- What is the breakup of the market based on the raw material?
- What is the breakup of the market based on the end use industry?
- What are the various stages in the value chain of the industry?
- What are the key driving factors and challenges in the industry?
- What is the structure of the Asia Pacific positive displacement pumps market and who are the key players?
- What is the degree of competition in the industry?
1 Preface
2 Scope and Methodology
2.1 Objectives of the Study
2.2 Stakeholders
2.3 Data Sources
2.3.1 Primary Sources
2.3.2 Secondary Sources
2.4 Market Estimation
2.4.1 Bottom-Up Approach
2.4.2 Top-Down Approach
2.5 Forecasting Methodology
3 Executive Summary
4 Introduction
4.1 Overview
4.2 Key Industry Trends
5 Asia Pacific Positive Displacement Pumps Market
5.1 Market Overview
5.2 Market Performance
5.3 Impact of COVID-19
5.4 Market Forecast
6 Market Breakup by Product Type
6.1 Rotary Pumps
6.1.1 Market Trends
6.1.2 Market Breakup by Type
6.1.2.1 Vane
6.1.2.2 Screw
6.1.2.3 Lobe
6.1.2.4 Gear
6.1.2.5 Progressing Cavity (PC)
6.1.2.6 Others
6.1.3 Market Forecast
6.2 Reciprocating Pumps
6.2.1 Market Trends
6.2.2 Market Breakup by Type
6.2.2.1 Piston
6.2.2.2 Diaphragm
6.2.2.3 Plunger
6.2.2.4 Others
6.2.3 Market Forecast
6.3 Peristaltic
6.3.1 Market Trends
6.3.2 Market Forecast
6.4 Others
6.4.1 Market Trends
6.4.2 Market Forecast
7 Market Breakup by Capacity
7.1 Low Capacity Pumps
7.1.1 Market Trends
7.1.2 Market Forecast
7.2 Medium Capacity Pumps
7.2.1 Market Trends
7.2.2 Market Forecast
7.3 High Capacity Pumps
7.3.1 Market Trends
7.3.2 Market Forecast
8 Market Breakup by Pump Characteristics
8.1 Standard Pumps
8.1.1 Market Trends
8.1.2 Market Forecast
8.2 Engineered Pumps
8.2.1 Market Trends
8.2.2 Market Forecast
8.3 Special Purpose Pumps
8.3.1 Market Trends
8.3.2 Market Forecast
9 Market Breakup by Raw Material
9.1 Bronze
9.1.1 Market Trends
9.1.2 Market Forecast
9.2 Cast Iron
9.2.1 Market Trends
9.2.2 Market Forecast
9.3 Polycarbonate
9.3.1 Market Trends
9.3.2 Market Forecast
9.4 Stainless Steel
9.4.1 Market Trends
9.4.2 Market Forecast
9.5 Others
9.5.1 Market Trends
9.5.2 Market Forecast
10 Market Breakup by End Use Industry
10.1 Oil and Gas
10.1.1 Market Trends
10.1.2 Market Forecast
10.2 Water and Wastewater
10.2.1 Market Trends
10.2.2 Market Forecast
10.3 Automotive
10.3.1 Market Trends
10.3.2 Market Forecast
10.4 Chemicals and Petrochemicals
10.4.1 Market Trends
10.4.2 Market Forecast
10.5 Others
10.5.1 Market Trends
10.5.2 Market Forecast
11 Market Breakup by Country
11.1 China
11.1.1 Market Trends
11.1.2 Market Breakup by Product Type
11.1.3 Market Breakup by Capacity
11.1.4 Market Breakup by Pump Characteristics
11.1.5 Market Breakup by Raw Material
11.1.6 Market Breakup by End Use Industry
11.1.7 Market Forecast
11.2 Japan
11.2.1 Market Trends
11.2.2 Market Breakup by Product Type
11.2.3 Market Breakup by Capacity
11.2.4 Market Breakup by Pump Characteristics
11.2.5 Market Breakup by Raw Material
11.2.6 Market Breakup by End Use Industry
11.2.7 Market Forecast
11.3 India
11.3.1 Market Trends
11.3.2 Market Breakup by Product Type
11.3.3 Market Breakup by Capacity
11.3.4 Market Breakup by Pump Characteristics
11.3.5 Market Breakup by Raw Material
11.3.6 Market Breakup by End Use Industry
11.3.7 Market Forecast
11.4 South Korea
11.4.1 Market Trends
11.4.2 Market Breakup by Product Type
11.4.3 Market Breakup by Capacity
11.4.4 Market Breakup by Pump Characteristics
11.4.5 Market Breakup by Raw Material
11.4.6 Market Breakup by End Use Industry
11.4.7 Market Forecast
11.5 Australia
11.5.1 Market Trends
11.5.2 Market Breakup by Product Type
11.5.3 Market Breakup by Capacity
11.5.4 Market Breakup by Pump Characteristics
11.5.5 Market Breakup by Raw Material
11.5.6 Market Breakup by End Use Industry
11.5.7 Market Forecast
11.6 Indonesia
11.6.1 Market Trends
11.6.2 Market Breakup by Product Type
11.6.3 Market Breakup by Capacity
11.6.4 Market Breakup by Pump Characteristics
11.6.5 Market Breakup by Raw Material
11.6.6 Market Breakup by End Use Industry
11.6.7 Market Forecast
11.7 Others
11.7.1 Market Trends
11.7.2 Market Breakup by Product Type
11.7.3 Market Breakup by Capacity
11.7.4 Market Breakup by Pump Characteristics
11.7.5 Market Breakup by Raw Material
11.7.6 Market Breakup by End Use Industry
11.7.7 Market Forecast
12 SWOT Analysis
12.1 Overview
12.2 Strengths
12.3 Weaknesses
12.4 Opportunities
12.5 Threats
13 Value Chain Analysis
14 Porters Five Forces Analysis
14.1 Overview
14.2 Bargaining Power of Buyers
14.3 Bargaining Power of Suppliers
14.4 Degree of Competition
14.5 Threat of New Entrants
14.6 Threat of Substitutes
15 Price Analysis
16 Policy and Regulatory Landscape
17 Competitive Landscape
17.1 Market Structure
17.2 Key Players
17.3 Profiles of Key Players
List of Figures
Figure 1: Asia Pacific: Positive Displacement Pumps Market: Major Drivers and Challenges
Figure 2: Asia Pacific: Positive Displacement Pumps Market: Sales Value (in Million US$), 2014 - 2019
Figure 3: Asia Pacific: Positive Displacement Pumps Market Forecast: Sales Value (in Million US$), 2020-2025
Figure 4: Asia Pacific: Positive Displacement Pumps Market: Breakup by Product Type (in %), 2019
Figure 5: Asia Pacific: Positive Displacement Pumps Market: Breakup by Capacity (in %), 2019
Figure 6: Asia Pacific: Positive Displacement Pumps Market: Breakup by Pump Characteristics (in %), 2019
Figure 7: Asia Pacific: Positive Displacement Pumps Market: Breakup by Raw Material (in %), 2019
Figure 8: Asia Pacific: Positive Displacement Pumps Market: Breakup by End Use Industry (in %), 2019
Figure 9: Asia Pacific: Positive Displacement Pumps Market: Breakup by Country (in %), 2019
Figure 10: Asia Pacific: Positive Displacement Pumps (Rotary Pumps) Market: Sales Value (in Million US$), 2014 & 2019
Figure 11: Asia Pacific: Positive Displacement Pumps (Rotary Pumps) Market Forecast: Sales Value (in Million US$), 2020-2025
Figure 12: Asia Pacific: Positive Displacement Pumps (Reciprocating Pumps) Market: Sales Value (in Million US$), 2014 & 2019
Figure 13: Asia Pacific: Positive Displacement Pumps (Reciprocating Pumps) Market Forecast: Sales Value (in Million US$), 2020-2025
Figure 14: Asia Pacific: Positive Displacement Pumps (Peristaltic) Market: Sales Value (in Million US$), 2014 & 2019
Figure 15: Asia Pacific: Positive Displacement Pumps (Peristaltic) Market Forecast: Sales Value (in Million US$), 2020-2025
Figure 16: Asia Pacific: Positive Displacement Pumps (Other Product Types) Market: Sales Value (in Million US$), 2014 & 2019
Figure 17: Asia Pacific: Positive Displacement Pumps (Other Product Types) Market Forecast: Sales Value (in Million US$), 2020-2025
Figure 18: Asia Pacific: Positive Displacement Pumps (Low Capacity Pumps) Market: Sales Value (in Million US$), 2014 & 2019
Figure 19: Asia Pacific: Positive Displacement Pumps (Low Capacity Pumps) Market Forecast: Sales Value (in Million US$), 2020-2025
Figure 20: Asia Pacific: Positive Displacement Pumps (Medium Capacity Pumps) Market: Sales Value (in Million US$), 2014 & 2019
Figure 21: Asia Pacific: Positive Displacement Pumps (Medium Capacity Pumps) Market Forecast: Sales Value (in Million US$), 2020-2025
Figure 22: Asia Pacific: Positive Displacement Pumps (High Capacity Pumps) Market: Sales Value (in Million US$), 2014 & 2019
Figure 23: Asia Pacific: Positive Displacement Pumps (High Capacity Pumps) Market Forecast: Sales Value (in Million US$), 2020-2025
Figure 24: Asia Pacific: Positive Displacement Pumps (Standard Pumps) Market: Sales Value (in Million US$), 2014 & 2019
Figure 25: Asia Pacific: Positive Displacement Pumps (Standard Pumps) Market Forecast: Sales Value (in Million US$), 2020-2025
Figure 26: Asia Pacific: Positive Displacement Pumps (Engineered Pumps) Market: Sales Value (in Million US$), 2014 & 2019
Figure 27: Asia Pacific: Positive Displacement Pumps (Engineered Pumps) Market Forecast: Sales Value (in Million US$), 2020-2025
Figure 28: Asia Pacific: Positive Displacement Pumps (Special Purpose Pumps) Market: Sales Value (in Million US$), 2014 & 2019
Figure 29: Asia Pacific: Positive Displacement Pumps (Special Purpose Pumps) Market Forecast: Sales Value (in Million US$), 2020-2025
Figure 30: Asia Pacific: Positive Displacement Pumps (Bronze) Market: Sales Value (in Million US$), 2014 & 2019
Figure 31: Asia Pacific: Positive Displacement Pumps (Bronze) Market Forecast: Sales Value (in Million US$), 2020-2025
Figure 32: Asia Pacific: Positive Displacement Pumps (Cast Iron) Market: Sales Value (in Million US$), 2014 & 2019
Figure 33: Asia Pacific: Positive Displacement Pumps (Cast Iron) Market Forecast: Sales Value (in Million US$), 2020-2025
Figure 34: Asia Pacific: Positive Displacement Pumps (Polycarbonate) Market: Sales Value (in Million US$), 2014 & 2019
Figure 35: Asia Pacific: Positive Displacement Pumps (Polycarbonate) Market Forecast: Sales Value (in Million US$), 2020-2025
Figure 36: Asia Pacific: Positive Displacement Pumps (Stainless Steel) Market: Sales Value (in Million US$), 2014 & 2019
Figure 37: Asia Pacific: Positive Displacement Pumps (Stainless Steel) Market Forecast: Sales Value (in Million US$), 2020-2025
Figure 38: Asia Pacific: Positive Displacement Pumps (Other Raw Materials) Market: Sales Value (in Million US$), 2014 & 2019
Figure 39: Asia Pacific: Positive Displacement Pumps (Other Raw Materials) Market Forecast: Sales Value (in Million US$), 2020-2025
Figure 40: Asia Pacific: Positive Displacement Pumps (Oil and Gas) Market: Sales Value (in Million US$), 2014 & 2019
Figure 41: Asia Pacific: Positive Displacement Pumps (Oil and Gas) Market Forecast: Sales Value (in Million US$), 2020-2025
Figure 42: Asia Pacific: Positive Displacement Pumps (Water and Wastewater) Market: Sales Value (in Million US$), 2014 & 2019
Figure 43: Asia Pacific: Positive Displacement Pumps (Water and Wastewater) Market Forecast: Sales Value (in Million US$), 2020-2025
Figure 44: Asia Pacific: Positive Displacement Pumps (Automotive) Market: Sales Value (in Million US$), 2014 & 2019
Figure 45: Asia Pacific: Positive Displacement Pumps (Automotive) Market Forecast: Sales Value (in Million US$), 2020-2025
Figure 46: Asia Pacific: Positive Displacement Pumps (Chemicals and Petrochemicals) Market: Sales Value (in Million US$), 2014 & 2019
Figure 47: Asia Pacific: Positive Displacement Pumps (Chemicals and Petrochemicals) Market Forecast: Sales Value (in Million US$), 2020-2025
Figure 48: Asia Pacific: Positive Displacement Pumps (Other End Use Industries) Market: Sales Value (in Million US$), 2014 & 2019
Figure 49: Asia Pacific: Positive Displacement Pumps (Other End Use Industries) Market Forecast: Sales Value (in Million US$), 2020-2025
Figure 50: China: Positive Displacement Pumps Market: Sales Value (in Million US$), 2014 & 2019
Figure 51: China: Positive Displacement Pumps Market: Breakup by Product Type (in %), 2019
Figure 52: China: Positive Displacement Pumps Market: Breakup by Capacity (in %), 2019
Figure 53: China: Positive Displacement Pumps Market: Breakup by Pump Characteristics (in %), 2019
Figure 54: China: Positive Displacement Pumps Market: Breakup by Raw Material (in %), 2019
Figure 55: China: Positive Displacement Pumps Market: Breakup by End Use Industry (in %), 2019
Figure 56: China: Positive Displacement Pumps Market Forecast: Sales Value (in Million US$), 2020-2025
Figure 57: Japan: Positive Displacement Pumps Market: Sales Value (in Million US$), 2014 & 2019
Figure 58: Japan: Positive Displacement Pumps Market: Breakup by Product Type (in %), 2019
Figure 59: Japan: Positive Displacement Pumps Market: Breakup by Capacity (in %), 2019
Figure 60: Japan: Positive Displacement Pumps Market: Breakup by Pump Characteristics (in %), 2019
Figure 61: Japan: Positive Displacement Pumps Market: Breakup by Raw Material (in %), 2019
Figure 62: Japan: Positive Displacement Pumps Market: Breakup by End Use Industry (in %), 2019
Figure 63: Japan: Positive Displacement Pumps Market Forecast: Sales Value (in Million US$), 2020-2025
Figure 64: India: Positive Displacement Pumps Market: Sales Value (in Million US$), 2014 & 2019
Figure 65: India: Positive Displacement Pumps Market: Breakup by Product Type (in %), 2019
Figure 66: India: Positive Displacement Pumps Market: Breakup by Capacity (in %), 2019
Figure 67: India: Positive Displacement Pumps Market: Breakup by Pump Characteristics (in %), 2019
Figure 68: India: Positive Displacement Pumps Market: Breakup by Raw Material (in %), 2019
Figure 69: India: Positive Displacement Pumps Market: Breakup by End Use Industry (in %), 2019
Figure 70: India: Positive Displacement Pumps Market Forecast: Sales Value (in Million US$), 2020-2025
Figure 71: South Korea: Positive Displacement Pumps Market: Sales Value (in Million US$), 2014 & 2019
Figure 72: South Korea: Positive Displacement Pumps Market: Breakup by Product Type (in %), 2019
Figure 73: South Korea: Positive Displacement Pumps Market: Breakup by Capacity (in %), 2019
Figure 74: South Korea: Positive Displacement Pumps Market: Breakup by Pump Characteristics (in %), 2019
Figure 75: South Korea: Positive Displacement Pumps Market: Breakup by Raw Material (in %), 2019
Figure 76: South Korea: Positive Displacement Pumps Market: Breakup by End Use Industry (in %), 2019
Figure 77: South Korea: Positive Displacement Pumps Market Forecast: Sales Value (in Million US$), 2020-2025
Figure 78: Australia: Positive Displacement Pumps Market: Sales Value (in Million US$), 2014 & 2019
Figure 79: Australia: Positive Displacement Pumps Market: Breakup by Product Type (in %), 2019
Figure 80: Australia: Positive Displacement Pumps Market: Breakup by Capacity (in %), 2019
Figure 81: Australia: Positive Displacement Pumps Market: Breakup by Pump Characteristics (in %), 2019
Figure 82: Australia: Positive Displacement Pumps Market: Breakup by Raw Material (in %), 2019
Figure 83: Australia: Positive Displacement Pumps Market: Breakup by End Use Industry (in %), 2019
Figure 84: Australia: Positive Displacement Pumps Market Forecast: Sales Value (in Million US$), 2020-2025
Figure 85: Indonesia: Positive Displacement Pumps Market: Sales Value (in Million US$), 2014 & 2019
Figure 86: Indonesia: Positive Displacement Pumps Market: Breakup by Product Type (in %), 2019
Figure 87: Indonesia: Positive Displacement Pumps Market: Breakup by Capacity (in %), 2019
Figure 88: Indonesia: Positive Displacement Pumps Market: Breakup by Pump Characteristics (in %), 2019
Figure 89: Indonesia: Positive Displacement Pumps Market: Breakup by Raw Material (in %), 2019
Figure 90: Indonesia: Positive Displacement Pumps Market: Breakup by End Use Industry (in %), 2019
Figure 91: Indonesia: Positive Displacement Pumps Market Forecast: Sales Value (in Million US$), 2020-2025
Figure 92: Others: Positive Displacement Pumps Market: Sales Value (in Million US$), 2014 & 2019
Figure 93: Others: Positive Displacement Pumps Market Forecast: Sales Value (in Million US$), 2020-2025
Figure 94: Asia Pacific: Positive Displacement Pumps Industry: SWOT Analysis
Figure 95: Asia Pacific: Positive Displacement Pumps Industry: Value Chain Analysis
Figure 96: Asia Pacific: Positive Displacement Pumps Industry: Porter’s Five Forces Analysis
List of Tables
Table 1: Asia Pacific: Positive Displacement Pumps Market: Key Industry Highlights, 2019 and 2025
Table 2: Asia Pacific: Positive Displacement Pumps Market Forecast: Breakup by Product Type (in Million US$), 2020-2025
Table 3: Asia Pacific: Positive Displacement Pumps Market Forecast: Breakup by Capacity (in Million US$), 2020-2025
Table 4: Asia Pacific: Positive Displacement Pumps Market Forecast: Breakup by Pump Characteristics (in Million US$), 2020-2025
Table 5: Asia Pacific: Positive Displacement Pumps Market Forecast: Breakup by Raw Material (in Million US$), 2020-2025
Table 6: Asia Pacific: Positive Displacement Pumps Market Forecast: Breakup by End Use Industry (in Million US$), 2020-2025
Table 7: Asia Pacific: Positive Displacement Pumps Market Forecast: Breakup by Country (in Million US$), 2020-2025
Table 8: Asia Pacific: Positive Displacement Pumps Market: Competitive Structure
Table 9: Asia Pacific: Positive Displacement Pumps Market: Key Players