
Australia Cargo Containers Market Size, Share, Trends and Forecast by Type, Size, End User, and Region, 2026-2034
Australia Cargo Containers Market Overview:
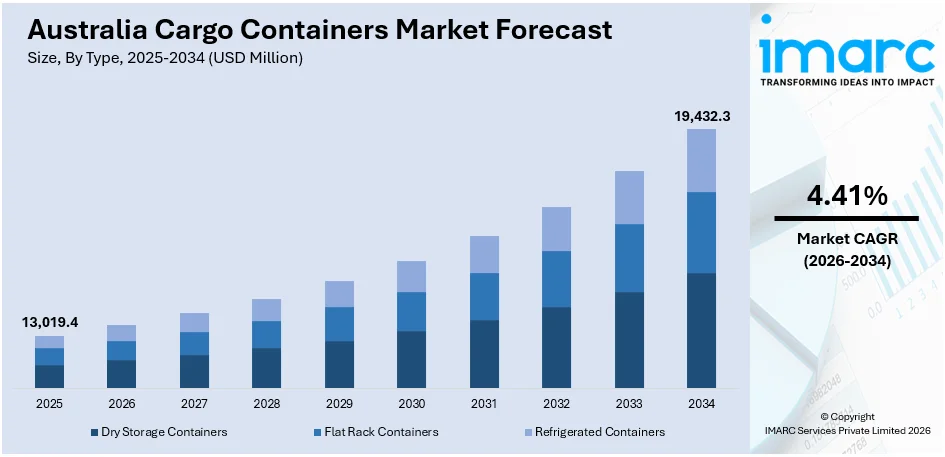
The Australia cargo containers market size reached USD 13,019.4 Million in 2025. Looking forward, IMARC Group expects the market to reach USD 19,432.3 Million by 2034, exhibiting a growth rate (CAGR) of 4.41% during 2026-2034. The market is fueled by mounting sustainability initiatives, including advancements such as electric transfer vehicles and increased rail usage for freight transport. These trends improve efficiency, minimize emissions, and benefit long-term growth, as a result, Australia cargo containers market share is expected to grow significantly.
|
Report Attribute
|
Key Statistics
|
|---|---|
|
Base Year
|
2025 |
|
Forecast Years
|
2026-2034
|
|
Historical Years
|
2020-2025
|
| Market Size in 2025 | USD 13,019.4 Million |
| Market Forecast in 2034 | USD 19,432.3 Million |
| Market Growth Rate 2026-2034 | 4.41% |
Australia Cargo Containers Market Trends:
Sustainability Push in Australia’s Cargo Container Market
One of the emerging trends in the Australian cargo containers industry is the move towards sustainability using new technologies and practices. With environmental regulations tightening across the world, the requirement to lower carbon footprints in logistics has become a major driving force. Firms are increasingly using green technologies to reduce emissions and enhance efficiency in operations. A significant example of this is DP World’s introduction of the first fully electric internal transfer vehicle (ITV) at the Port of Brisbane in December 2024. The electric ITV, capable of carrying 88-tonne containers, is expected to reduce diesel consumption by over 120,000 liters annually. The move is in alignment with the decarbonization aspirations of Australia, assuring a cleaner future for the cargo containers industry. Such environmentally friendly investments play a critical role in guiding the supply chain towards green alternatives, increasing energy efficiency, and mitigating environmental footprints in ports and logistics. With electric or hybrid-powered vehicles increasingly being used by more operators, this trend is likely to further decrease the carbon footprint of freight transportation, thereby supporting global causes against climate change. Further, such projects have the long-term prospect of saving costs, as decreased fuel usage means lower operational costs. Overall, the incorporation of green technologies in the cargo container market is not merely a reaction to regulatory forces but also a differentiator in competition for logistic businesses.
To get more information on this market Request Sample
Increased Rail Utilization for Freight Movement
The growing reliance on rail for freight movement, driven by infrastructure investments and efforts to reduce road congestion is driving the Australia cargo containers market growth. Rail offers a more efficient and environmentally friendly alternative to road transport, especially for heavy container loads. The opening of the Kenwick Intermodal Terminal (IMT) in March 2025 is a prime example of this development. The USD 25 Million terminal facilitates the movement of 200,000 containers annually by rail, which will help reduce truck journeys by 135,000 per year. This rail shift is improving freight efficiency, alleviating congestion, and enhancing long-term development of Australia's logistics network. Such investment in rail infrastructure supports the state's vision to expand rail freight, thereby increasing supply chain resilience. The terminal also provides a seamless interface between road and rail networks, allowing easier transfer of goods and overall logistics improvement. The increasing use of rail is a reaction to the demand for more sustainable and lower-cost transport options. Rail provides lower fuel usage, less road wear and tear, and improved fuel efficiency. As this movement grows, it is anticipated to contribute to both economic development and sustainability by improving the resilience and efficiency of Australia's freight networks, thus benefiting importers, exporters, and logistics operators.
Australia Cargo Containers Market Segmentation:
IMARC Group provides an analysis of the key trends in each segment of the market, along with forecasts at the country and regional level for 2026-2034. Our report has categorized the market based on type, size, and end user.
Type Insights:
- Dry Storage Containers
- Flat Rack Containers
- Refrigerated Containers
The report has provided a detailed breakup and analysis of the market based on the type. This includes dry storage containers, flat rack containers, and refrigerated containers.
Size Insights:
- Small Containers (20 ft)
- Medium Containers (40 ft)
- Large Containers (Above 40 ft)
The report has provided a detailed breakup and analysis of the market based on the size. This includes small containers (20 ft), medium containers (40 ft), and large containers (above 40 ft).
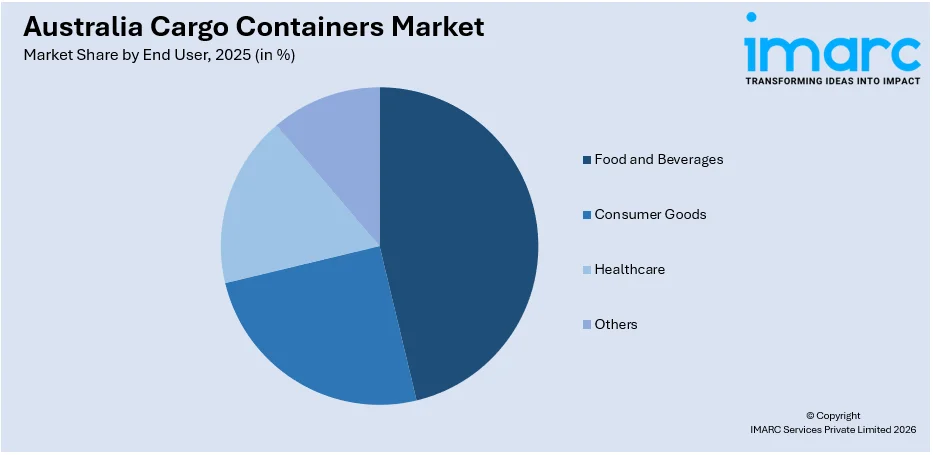
End User Insights:
Access the comprehensive market breakdown Request Sample
- Food and Beverages
- Consumer Goods
- Healthcare
- Others
A detailed breakup and analysis of the market based on the end user have also been provided in the report. This includes food and beverages, consumer goods, healthcare, and others.
Regional Insights:
- Australia Capital Territory and New South Wales
- Victoria and Tasmania
- Queensland
- Northern Territory and Southern Australia
- Western Australia
The report has also provided a comprehensive analysis of all the major regional markets, which include Australia Capital Territory and New South Wales, Victoria and Tasmania, Queensland, Northern Territory and Southern Australia, and Western Australia.
Competitive Landscape:
The market research report has also provided a comprehensive analysis of the competitive landscape. Competitive analysis such as market structure, key player positioning, top winning strategies, competitive dashboard, and company evaluation quadrant has been covered in the report. Also, detailed profiles of all major companies have been provided.
Australia Cargo Containers Market News:
- March 2025: DP World Australia’s proposed acquisition of Silk Logistics raised competition concerns in the Australian cargo containers sector. The ACCC feared reduced competition in container transport, potentially leading to higher prices and diminished service quality for importers and exporters. This move could impact market dynamics and pricing strategies.
- March 2025: The CMA CGM Baalbeck, an 8,048 TEU LNG-powered container ship, debuted at Patrick Terminals in Melbourne. This marks Australia's first LNG-powered container ship, signaling a shift towards sustainable shipping and potentially reducing emissions in the Australian cargo containers industry.
Australia Cargo Containers Market Report Coverage:
| Report Features | Details |
|---|---|
| Base Year of the Analysis | 2025 |
| Historical Period | 2020-2025 |
| Forecast Period | 2026-2034 |
| Units | Million USD |
| Scope of the Report |
Exploration of Historical Trends and Market Outlook, Industry Catalysts and Challenges, Segment-Wise Historical and Future Market Assessment:
|
| Types Covered | Dry Storage Containers, Flat Rack Containers, Refrigerated Containers |
| Sizes Covered | Small Containers (20 ft), Medium Containers (40 ft), Large Containers (Above 40 ft) |
| End Users Covered | Food and Beverages, Consumer Goods, Healthcare, Others |
| Regions Covered | Australia Capital Territory & New South Wales, Victoria & Tasmania, Queensland, Northern Territory & Southern Australia, Western Australia |
| Customization Scope | 10% Free Customization |
| Post-Sale Analyst Support | 10-12 Weeks |
| Delivery Format | PDF and Excel through Email (We can also provide the editable version of the report in PPT/Word format on special request) |
Key Questions Answered in This Report:
- How has the Australia cargo containers market performed so far and how will it perform in the coming years?
- What is the breakup of the Australia cargo containers market on the basis of type?
- What is the breakup of the Australia cargo containers market on the basis of size?
- What is the breakup of the Australia cargo containers market on the basis of end user?
- What is the breakup of the Australia cargo containers market on the basis of region?
- What are the various stages in the value chain of the Australia cargo containers market?
- What are the key driving factors and challenges in the Australia cargo containers market?
- What is the structure of the Australia cargo containers market and who are the key players?
- What is the degree of competition in the Australia cargo containers market?
Key Benefits for Stakeholders:
- IMARC’s industry report offers a comprehensive quantitative analysis of various market segments, historical and current market trends, market forecasts, and dynamics of the Australia cargo containers market from 2020-2034.
- The research report provides the latest information on the market drivers, challenges, and opportunities in the Australia cargo containers market.
- Porter's five forces analysis assist stakeholders in assessing the impact of new entrants, competitive rivalry, supplier power, buyer power, and the threat of substitution. It helps stakeholders to analyze the level of competition within the Australia cargo containers industry and its attractiveness.
- Competitive landscape allows stakeholders to understand their competitive environment and provides an insight into the current positions of key players in the market.
Need more help?
- Speak to our experienced analysts for insights on the current market scenarios.
- Include additional segments and countries to customize the report as per your requirement.
- Gain an unparalleled competitive advantage in your domain by understanding how to utilize the report and positively impacting your operations and revenue.
- For further assistance, please connect with our analysts.
 Request Customization
 Speak to an Analyst
 Request Brochure
 Inquire Before Buying
Benefits of Customization
- Personalize this research
- Triangulate with your data
- Get data as per your format and definition
- Gain a deeper dive into a specific application, geography, customer, or competitor
- Any level of personalization
Get in Touch With Us
UNITED STATES
Phone: +1-201-971-6302
INDIA
Phone: +91-120-433-0800
UNITED KINGDOM
Phone: +44-753-714-6104
Email: [email protected]
Client Testimonials


.webp)


