
Australia Children’s Entertainment Centers Market Size, Share, Trends and Forecast by Visitor Demographics, Facility Size, Revenue Source, Activity Area, and Region, 2026-2034
Australia Children’s Entertainment Centers Market Overview:
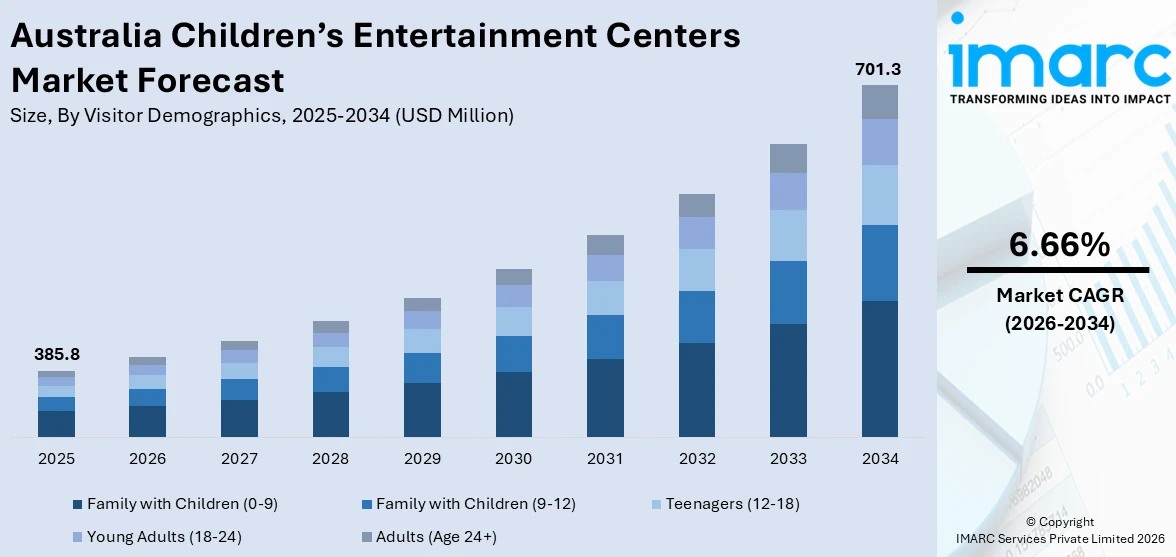
The Australia children’s entertainment centers market size reached USD 385.8 Million in 2025. Looking forward, IMARC Group expects the market to reach USD 701.3 Million by 2034, exhibiting a growth rate (CAGR) of 6.66% during 2026-2034. Increasing dual-income households, rising demand for indoor recreational activities, expanding urban populations, and themed attractions are some of the factors contributing to Australia children’s entertainment centers market share. Technological innovations, safety-focused environments, and birthday party services also boost visitation, along with shopping mall integration and growing parental spending.
|
Report Attribute
|
Key Statistics
|
|---|---|
|
Base Year
|
2025
|
|
Forecast Years
|
2026-2034
|
|
Historical Years
|
2020-2025
|
| Market Size in 2025 | USD 385.8 Million |
| Market Forecast in 2034 | USD 701.3 Million |
| Market Growth Rate 2026-2034 | 6.66% |
Australia Children’s Entertainment Centers Market Trends:
Tech-Integrated Play Experiences
Australian children’s entertainment centers are rapidly adopting digital technology to stay competitive. Virtual reality zones, motion-activated games, and interactive floor projections are now common features. These additions extend playtime and increase repeat visits, as kids stay more engaged. Parents often view these high-tech offerings as a better use of time and money, especially when the games include elements of learning or problem-solving. Operators are also adding app-based check-ins, smart wristbands, and digital loyalty programs to improve the customer experience. The goal is to make the visit feel seamless, modern, and personalized. Tech is not just for fun; many centers now include educational games that promote memory, coordination, and teamwork. This direction appeals to both parents and children, who are looking for more than just slides and ball pits. With lower hardware costs and easier software integration, even smaller venues are starting to follow this path. As a result, the line between entertainment, education, and digital play continues to blur, changing how these centers attract and retain young families. These factors are intensifying the Australia children’s entertainment centers market growth.
To get more information on this market Request Sample
Rise of Community-Centric, Nature-Focused Centers
A different shift is taking hold in Australia’s children’s entertainment sector, focused on unplugged, nature-based experiences. Instead of lights and screens, these centers prioritize open-ended play in natural settings. Wood, sand, stone, and water replace plastic and metal. These spaces are often built outdoors or designed to feel like an extension of local parks. Many are linked to bush kinder principles and reflect native landscapes, offering climbing areas, garden paths, water play, and craft zones. Families are choosing these venues for their emphasis on slower, more grounded activities that encourage creativity and cooperation. Some centers partner with local councils or schools to host pop-up events, nature trails, and parent workshops. Birthday parties might include scavenger hunts or planting activities instead of arcade tickets and party rooms. These places are quieter, less structured, and often more inclusive, catering to neurodiverse children and mixed-age groups. Rather than being occasional destinations, they often become weekly habits for families who prefer social, outdoor-style play that feels less commercial and more community-driven.
Australia Children’s Entertainment Centers Market Segmentation:
IMARC Group provides an analysis of the key trends in each segment of the market, along with forecasts at the country and regional levels for 2026-2034. Our report has categorized the market based on visitor demographics, facility size, revenue source, and activity area.
Visitor Demographics Insights:
- Family with Children (0-9)
- Family with Children (9-12)
- Teenagers (12-18)
- Young Adults (18-24)
- Adults (Age 24+)
The report has provided a detailed breakup and analysis of the market based on the visitor demographics. This includes family with children (0-9), family with children (9-12), teenagers (12-18), young adults (18-24), and adults (age 24+).
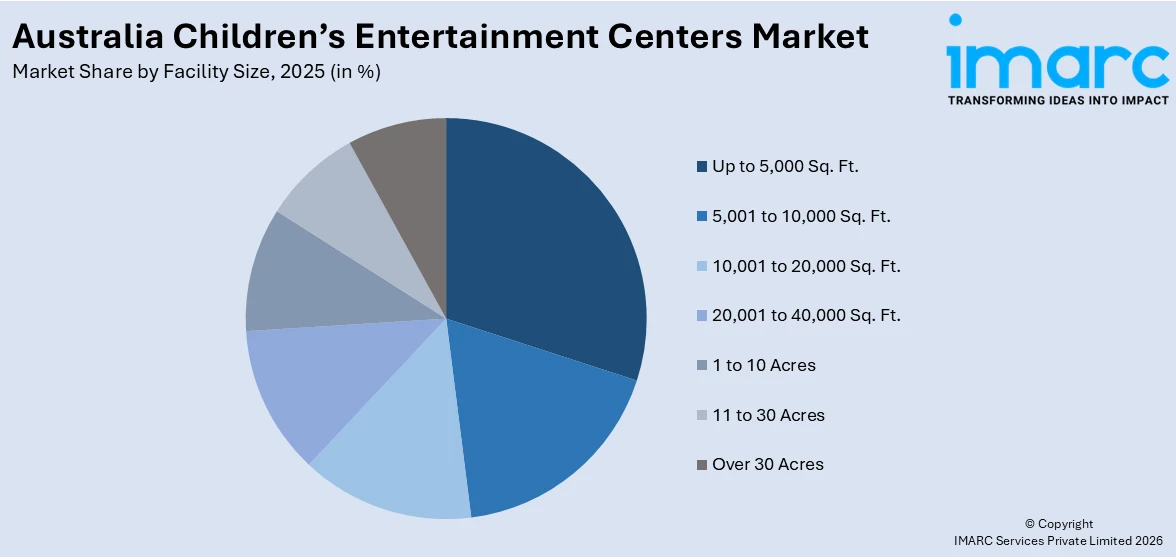
Facility Size Insights:
Access the comprehensive market breakdown Request Sample
- Up to 5,000 Sq. Ft.
- 5,001 to 10,000 Sq. Ft.
- 10,001 to 20,000 Sq. Ft.
- 20,001 to 40,000 Sq. Ft.
- 1 to 10 Acres
- 11 to 30 Acres
- Over 30 Acres
The report has provided a detailed breakup and analysis of the market based on the facility size. This includes up to 5,000 sq. ft., 5,001 to 10,000 sq. ft., 10,001 to 20,000 sq. ft., 20,001 to 40,000 sq. ft., 1 to 10 acres, 11 to 30 acres, and over 30 acres.
Revenue Source Insights:
- Entry Fees and Ticket Sales
- Food and Beverages
- Merchandising
- Advertising
- Others
The report has provided a detailed breakup and analysis of the market based on the revenue source. This includes entry fees and ticket sales, food and beverages, merchandising, advertising, and others.
Activity Area Insights:
- Arcade Studios
- AR and VR Gaming Zone
- Physical Play Activities
- Skill/Competition Games
- Others
A detailed breakup and analysis of the market based on the activity area have also been provided in the report. This includes arcade studios, AR and VR gaming zone, physical play activities, skill/competition games, and others.
Regional Insights:
- Australia Capital Territory & New South Wales
- Victoria & Tasmania
- Queensland
- Northern Territory & Southern Australia
- Western Australia
The report has also provided a comprehensive analysis of all the major regional markets, which include Australia Capital Territory & New South Wales, Victoria & Tasmania, Queensland, Northern Territory & Southern Australia, and Western Australia.
Competitive Landscape:
The market research report has also provided a comprehensive analysis of the competitive landscape. Competitive analysis such as market structure, key player positioning, top winning strategies, competitive dashboard, and company evaluation quadrant has been covered in the report. Also, detailed profiles of all major companies have been provided.
Australia Children’s Entertainment Centers Market Report Coverage:
| Report Features | Details |
|---|---|
| Base Year of the Analysis | 2025 |
| Historical Period | 2020-2025 |
| Forecast Period | 2026-2034 |
| Units | Million USD |
| Scope of the Report |
Exploration of Historical Trends and Market Outlook, Industry Catalysts and Challenges, Segment-Wise Historical and Future Market Assessment:
|
| Visitor Demographics Covered | Family With Children (0-9), Family With Children (9-12), Teenagers (12-18), Young Adults (18-24), Adults (Age 24+) |
| Facility Sizes Covered | Up to 5,000 Sq. Ft., 5,001 to 10,000 Sq. Ft., 10,001 to 20,000 Sq. Ft., 20,001 to 40,000 Sq. Ft., 1 to 10 Acres, 11 to 30 Acres, Over 30 Acres |
| Revenue Sources Covered | Entry Fees and Ticket Sales, Food and Beverages, Merchandising, Advertising, Others |
| Activity Areas Covered | Arcade Studios, AR and VR Gaming Zone, Physical Play Activities, Skill/Competition Games, Others |
| Regions Covered | Australia Capital Territory & New South Wales, Victoria & Tasmania, Queensland, Northern Territory & Southern Australia, Western Australia |
| Customization Scope | 10% Free Customization |
| Post-Sale Analyst Support | 10-12 Weeks |
| Delivery Format | PDF and Excel through Email (We can also provide the editable version of the report in PPT/Word format on special request) |
Key Questions Answered in This Report:
- How has the Australia children’s entertainment centers market performed so far and how will it perform in the coming years?
- What is the breakup of the Australia children’s entertainment centers market on the basis of visitor demographics?
- What is the breakup of the Australia children’s entertainment centers market on the basis of facility size?
- What is the breakup of the Australia children’s entertainment centers market on the basis of revenue source?
- What is the breakup of the Australia children’s entertainment centers market on the basis of activity area?
- What is the breakup of the Australia children’s entertainment centers market on the basis of region?
- What are the various stages in the value chain of the Australia children’s entertainment centers market?
- What are the key driving factors and challenges in the Australia children’s entertainment centers market?
- What is the structure of the Australia children’s entertainment centers market and who are the key players?
- What is the degree of competition in the Australia children’s entertainment centers market?
Key Benefits for Stakeholders:
- IMARC’s industry report offers a comprehensive quantitative analysis of various market segments, historical and current market trends, market forecasts, and dynamics of the Australia children’s entertainment centers market from 2020-2034.
- The research report provides the latest information on the market drivers, challenges, and opportunities in the Australia children’s entertainment centers market.
- Porter's five forces analysis assist stakeholders in assessing the impact of new entrants, competitive rivalry, supplier power, buyer power, and the threat of substitution. It helps stakeholders to analyze the level of competition within the Australia children’s entertainment centers industry and its attractiveness.
- Competitive landscape allows stakeholders to understand their competitive environment and provides an insight into the current positions of key players in the market.
Need more help?
- Speak to our experienced analysts for insights on the current market scenarios.
- Include additional segments and countries to customize the report as per your requirement.
- Gain an unparalleled competitive advantage in your domain by understanding how to utilize the report and positively impacting your operations and revenue.
- For further assistance, please connect with our analysts.
 Request Customization
 Speak to an Analyst
 Request Brochure
 Inquire Before Buying
Benefits of Customization
- Personalize this research
- Triangulate with your data
- Get data as per your format and definition
- Gain a deeper dive into a specific application, geography, customer, or competitor
- Any level of personalization
Get in Touch With Us
UNITED STATES
Phone: +1-201-971-6302
INDIA
Phone: +91-120-433-0800
UNITED KINGDOM
Phone: +44-753-714-6104
Email: sales@imarcgroup.com
Client Testimonials


.webp)


