
Australia Computer Vision Market Size, Share, Trends and Forecast by Component, Product Type, Application, Vertical, and Region, 2026-2034
Australia Computer Vision Market Overview:
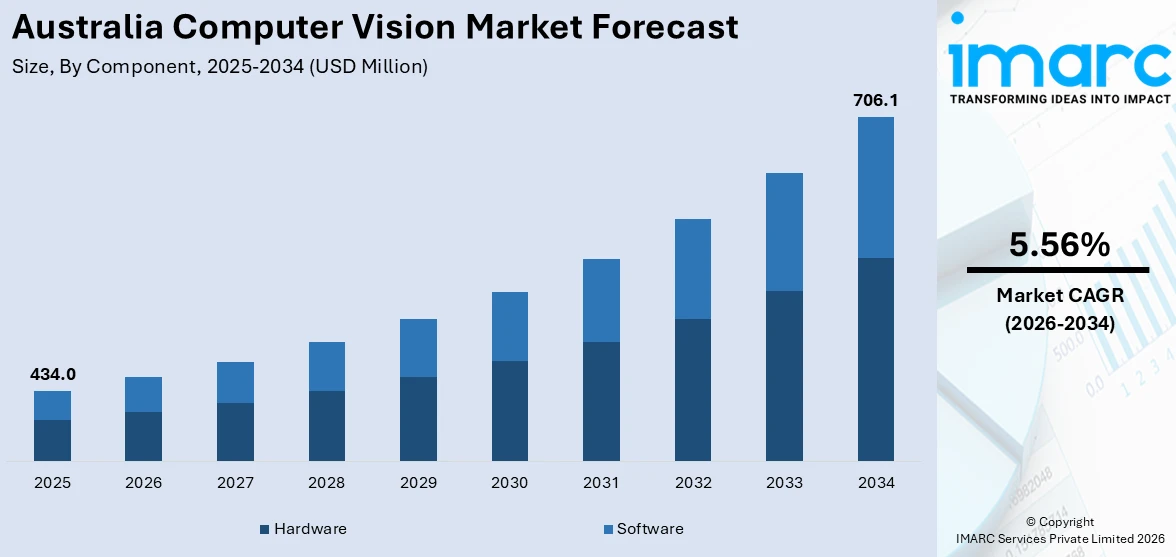
The Australia computer vision market size reached USD 434.0 Million in 2025. The market is projected to reach USD 706.1 Million by 2034, exhibiting a growth rate (CAGR) of 5.56% during 2026-2034. Government-supported programs aimed at digitalization and smart city growth are creating the need for artificial intelligence (AI)-integrated systems for surveillance, monitoring, and infrastructure management that guarantee improved safety and efficiency. Besides this, the broadening of e-commerce portals is contributing to the expansion of the Australia computer vision market share.
|
Report Attribute
|
Key Statistics
|
|---|---|
|
Base Year
|
2025
|
|
Forecast Years
|
2026-2034
|
|
Historical Years
|
2020-2025
|
| Market Size in 2025 | USD 434.0 Million |
| Market Forecast in 2034 | USD 706.1 Million |
| Market Growth Rate 2026-2034 | 5.56% |
Australia Computer Vision Market Trends:
Growing adoption of AI
Rising deployment of AI is playing a transformative role in fueling the growth of the market in Australia. As per the IMARC Group, the Australia AI market was valued at USD 2,072.7 Million in 2024. Industries across the country are implementing AI-based computer vision solutions to boost accuracy, speed, and automation in key operational areas. In healthcare, AI-oriented imaging systems are enhancing diagnostic efficiency and enabling more precise treatment planning, while in manufacturing, AI-driven vision applications assist in predictive maintenance, fault detection, and optimization of production lines, ultimately lowering operational costs and improving quality standards. Government-backed initiatives focused on digitalization and smart city development are further driving the demand for AI-integrated surveillance, monitoring, and infrastructure management systems that ensure enhanced safety and efficiency. In addition, agriculture is adopting computer vision tools for automated crop analysis, pest detection, and yield forecasting, contributing to smarter and more sustainable farming practices. Supported by increasing investments in startups and AI innovation hubs, Australia is rapidly employing next-generation vision technologies across diverse industries.
To get more information on this market Request Sample
Expansion of e-commerce portals
The broadening of e-commerce platforms is impelling the Australia computer vision market growth. Computer vision technologies are streamlining e-commerce operations by enabling automated product recognition, inventory monitoring, and real-time quality checks, which minimize errors and accelerate warehouse and order fulfillment processes. With the rising trend of online shopping, retailers are integrating image-based search tools powered by vision systems, allowing customers to locate products more intuitively and conveniently. Moreover, computer vision contributes to enhanced security in e-commerce transactions by supporting fraud prevention, facial recognition, and identity verification solutions. Logistics operations and last-mile delivery are also becoming more efficient through vision-enabled package tracking, load management, and route optimization, ensuring faster and more reliable deliveries. In addition, the growing adoption of personalized shopping experiences, such as augmented reality (AR)-oriented virtual try-ons and recommendation systems, is strengthening the role of vision-based technologies. As online shopping is gaining traction, Australian businesses are investing heavily in computer vision solutions to enhance customer engagement, remain cost-efficient, and gain a competitive edge in the digital marketplace. As per industry reports, in 2024, 17.08 Million Australians engaged in online shopping each month, representing a 45% rise from 2020 (11.78%).
Australia Computer Vision Market Segmentation:
IMARC Group provides an analysis of the key trends in each segment of the market, along with forecasts at the country and regional levels for 2026-2034. Our report has categorized the market based on component, product type, application, and vertical.
Component Insights:
- Hardware
- Software
The report has provided a detailed breakup and analysis of the market based on the component. This includes hardware and software.
Product Type Insights:
- Smart Camera-Based
- PC-Based
A detailed breakup and analysis of the market based on the product type have also been provided in the report. This includes smart camera-based and PC-based.
Application Insights:
Access the comprehensive market breakdown Request Sample
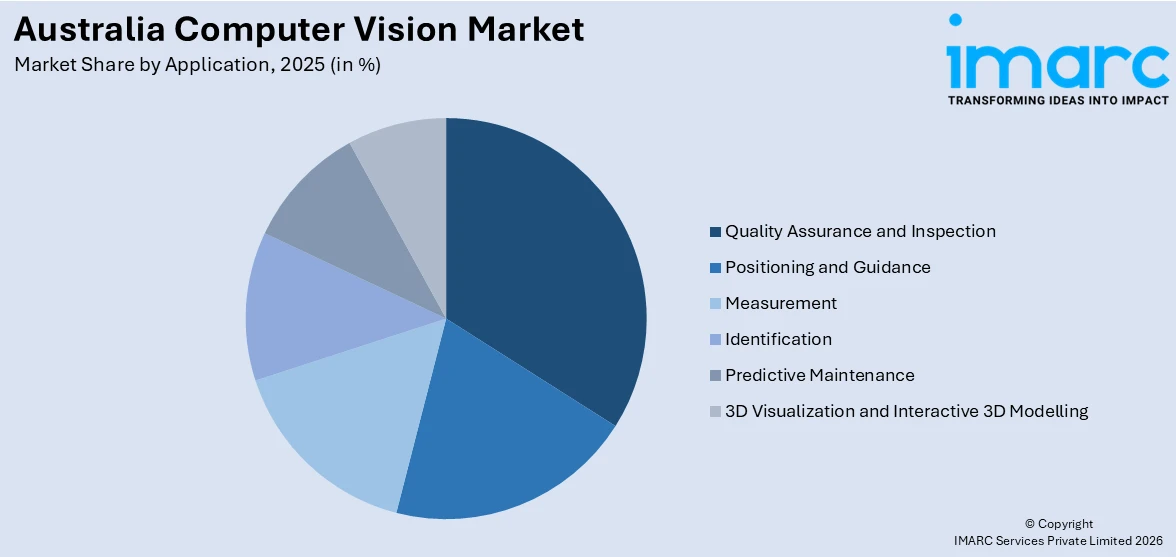
- Quality Assurance and Inspection
- Positioning and Guidance
- Measurement
- Identification
- Predictive Maintenance
- 3D Visualization and Interactive 3D Modelling
The report has provided a detailed breakup and analysis of the market based on the application. This includes quality assurance and inspection, positioning and guidance, measurement, identification, predictive maintenance, and 3D visualization and interactive 3D modelling.
Vertical Insights:
- Industrial
- Non-Industrial
A detailed breakup and analysis of the market based on the vertical have also been provided in the report. This includes industrial and non-industrial.
Regional Insights:
- Australia Capital Territory & New South Wales
- Victoria & Tasmania
- Queensland
- Northern Territory & Southern Australia
- Western Australia
The report has also provided a comprehensive analysis of all the major regional markets, which include Australia Capital Territory & New South Wales, Victoria & Tasmania, Queensland, Northern Territory & Southern Australia, and Western Australia.
Competitive Landscape:
The market research report has also provided a comprehensive analysis of the competitive landscape. Competitive analysis such as market structure, key player positioning, top winning strategies, competitive dashboard, and company evaluation quadrant has been covered in the report. Also, detailed profiles of all major companies have been provided.
Australia Computer Vision Market News:
- In May 2025, CSIRO, Australia's national science agency, invited small to medium-sized enterprises (SMEs) focused on creating solutions in digital technologies to submit applications for its newest ‘Innovate to Grow’ program. The project welcomed SMEs involved in subsectors like AI, which encompassed computer vision, digital manufacturing, and quantum computing.
- In November 2024, Coles Group (Coles), an Australian retail company, and Microsoft revealed a new five-year strategic alliance. The firms would partner and innovate together on various digital projects to assist Coles in boosting its sales and ecommerce functions and enhancing customer experiences in Australia. Coles’ ‘Intelligent Edge Backbone (IEB)’ facilitated results in computer vision and machine learning (ML). Coles and Microsoft would investigate how the IEB could link and oversee IoT devices throughout Coles' supply chain and stores to further Coles' sustainability objectives and increase team member productivity and safety.
Australia Computer Vision Market Report Coverage:
| Report Features | Details |
|---|---|
| Base Year of the Analysis | 2025 |
| Historical Period | 2020-2025 |
| Forecast Period | 2026-2034 |
| Units | Million USD |
| Scope of the Report |
Exploration of Historical Trends and Market Outlook, Industry Catalysts and Challenges, Segment-Wise Historical and Future Market Assessment:
|
| Components Covered | Hardware, Software |
| Product Types Covered | Smart Camera-Based, PC-Based |
| Applications Covered | Quality Assurance and Inspection, Positioning and Guidance, Measurement, Identification, Predictive Maintenance, 3D Visualization and Interactive 3D Modelling |
| Verticals Covered | Industrial, Non-Industrial |
| Regions Covered | Australia Capital Territory & New South Wales, Victoria & Tasmania, Queensland, Northern Territory & Southern Australia, Western Australia |
| Customization Scope | 10% Free Customization |
| Post-Sale Analyst Support | 10-12 Weeks |
| Delivery Format | PDF and Excel through Email (We can also provide the editable version of the report in PPT/Word format on special request) |
Key Questions Answered in This Report:
- How has the Australia computer vision market performed so far and how will it perform in the coming years?
- What is the breakup of the Australia computer vision market on the basis of component?
- What is the breakup of the Australia computer vision market on the basis of product type?
- What is the breakup of the Australia computer vision market on the basis of application?
- What is the breakup of the Australia computer vision market on the basis of vertical?
- What is the breakup of the Australia computer vision market on the basis of region?
- What are the various stages in the value chain of the Australia computer vision market?
- What are the key driving factors and challenges in the Australia computer vision market?
- What is the structure of the Australia computer vision market and who are the key players?
- What is the degree of competition in the Australia computer vision market?
Key Benefits for Stakeholders:
- IMARC’s industry report offers a comprehensive quantitative analysis of various market segments, historical and current market trends, market forecasts, and dynamics of the Australia computer vision market from 2020-2034.
- The research report provides the latest information on the market drivers, challenges, and opportunities in the Australia computer vision market.
- Porter's five forces analysis assist stakeholders in assessing the impact of new entrants, competitive rivalry, supplier power, buyer power, and the threat of substitution. It helps stakeholders to analyze the level of competition within the Australia computer vision industry and its attractiveness.
- Competitive landscape allows stakeholders to understand their competitive environment and provides an insight into the current positions of key players in the market.
Need more help?
- Speak to our experienced analysts for insights on the current market scenarios.
- Include additional segments and countries to customize the report as per your requirement.
- Gain an unparalleled competitive advantage in your domain by understanding how to utilize the report and positively impacting your operations and revenue.
- For further assistance, please connect with our analysts.
 Request Customization
 Speak to an Analyst
 Request Brochure
 Inquire Before Buying
Benefits of Customization
- Personalize this research
- Triangulate with your data
- Get data as per your format and definition
- Gain a deeper dive into a specific application, geography, customer, or competitor
- Any level of personalization
Get in Touch With Us
UNITED STATES
Phone: +1-201-971-6302
INDIA
Phone: +91-120-433-0800
UNITED KINGDOM
Phone: +44-753-714-6104
Email: [email protected]
Client Testimonials


.webp)


