
Australia Display Market Size, Share, Trends and Forecast by Display Type, Technology, Application, Industry Vertical, and Region, 2026-2034
Australia Display Market Overview:
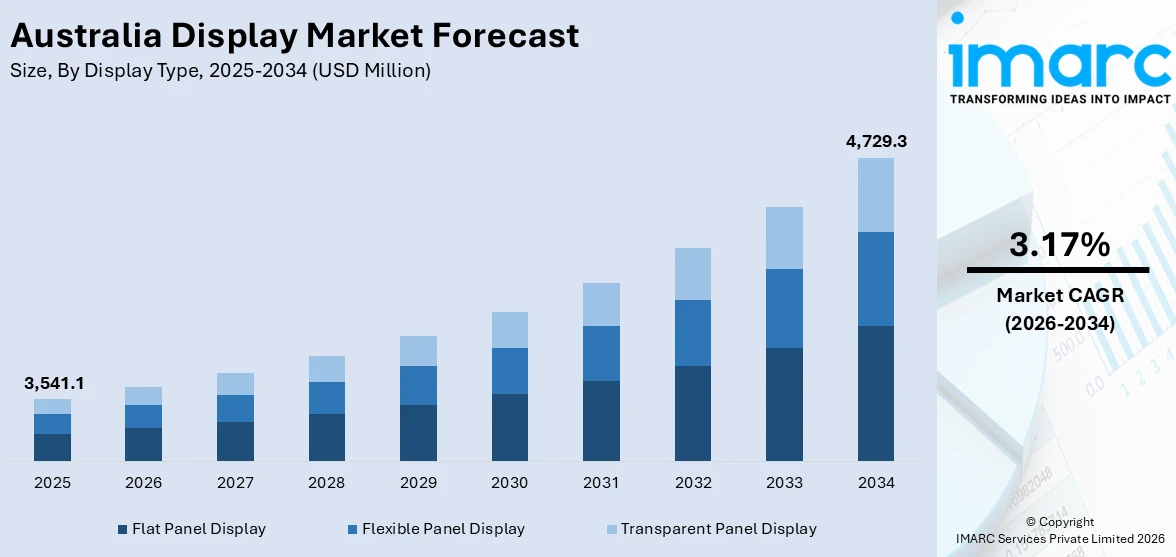
The Australia display market size reached USD 3,541.1 Million in 2025. Looking forward, IMARC Group expects the market to reach USD 4,729.3 Million by 2034, exhibiting a growth rate (CAGR) of 3.17% during 2026-2034. The market is propelled by rising demand for digital displays, continued innovation in organic light emitting diode (OLED) technology, and widespread smart display solution adoption. These drivers are being driven by the necessity for more active, power-conscious, and interactive displays across retail, entertainment, and smart homes sectors to improve customer experience and engagement.
|
Report Attribute
|
Key Statistics
|
|---|---|
|
Base Year
|
2025 |
|
Forecast Years
|
2026-2034
|
|
Historical Years
|
2020-2025
|
| Market Size in 2025 | USD 3,541.1 Million |
| Market Forecast in 2034 | USD 4,729.3 Million |
| Market Growth Rate 2026-2034 | 3.17% |
Australia Display Market Trends:
Integration of Smart Display Solutions
The combination of smart display technologies is having a profound impact on the Australia display market share. With touch-screen interfaces, voice control, and IoT connectivity, these displays are fast gaining popularity in both residential and business environments. Smart displays have a range of applications across smart homes, digital kiosks, and shared office spaces. They offer greater interactivity, providing customized experiences and effortless integration with other networked devices, enhancing convenience and efficiency. With Australian consumers increasingly adopting smart technology for its potential to make everyday tasks easier and increase functionality, demand for these advanced display solutions is likely to surge at a rapid pace. This pattern suggests that both personal and professional environments are becoming more connected and interactive.
To get more information on this market Request Sample
Rising Demand for Digital Signage
Digital signage is rapidly expanding in Australia, driven by its adaptability and effectiveness across sectors like retail, hospitality, and transportation. It allows businesses to deliver dynamic, interactive content that enhances customer engagement and strengthens brand visibility. Studies show digital signage can increase sales by 29.5%, improve ad recall by 52%, and influence 70% of customer purchase decisions. In contrast to conventional signage, it provides up-to-date content, simpler management, and higher cost savings. With the advancements in LED technology and the decrease in hardware costs, digital signage is becoming more accessible to small businesses as well. Its longer screen life and versatility make it a favorite among modern-day communication. These combined advantages are driving its extensive use throughout Australia, playing a major role in Australia display market growth in the changing digital communication environment.
Growth of OLED Display Technology
OLED screens are catching up in Australia owing to their better image quality, power efficiency, and ultra-thin designs. These screens have improved contrast ratios, faster response rates, and deeper blacks compared to regular LCD displays, which make them extremely desirable in consumer electronics. With smartphones, TVs, and wearables coming with OLED technology more and more, demand has grown in Australia, especially among high-end devices and home entertainment. OLED's ability to offer rich, life-like images with lower energy expenditure has determined it as the preferred choice among consumers seeking high-end displays. Its widespread use in various devices is turning OLED into a key growth driver in the Australia display market outlook, boosting its presence further and shaping the future of display technology.
Australia Display Market Segmentation:
IMARC Group provides an analysis of the key trends in each segment of the market, along with forecasts at the region level for 2026-2034. Our report has categorized the market based on display type, technology, application, and industry vertical.
Display Type Insights:
- Flat Panel Display
- Flexible Panel Display
- Transparent Panel Display
A detailed breakup and analysis of the market based on the display type have also been provided in the report. This includes flat panel display, flexible panel display, and transparent panel display.
Technology Insights:
- OLED
- Quantum Dot
- LED
- LCD
- E-Paper
- Others
The report has provided a detailed breakup and analysis of the market based on the technology. This includes OLED, quantum dot, LED, LCD, E-paper, and others.
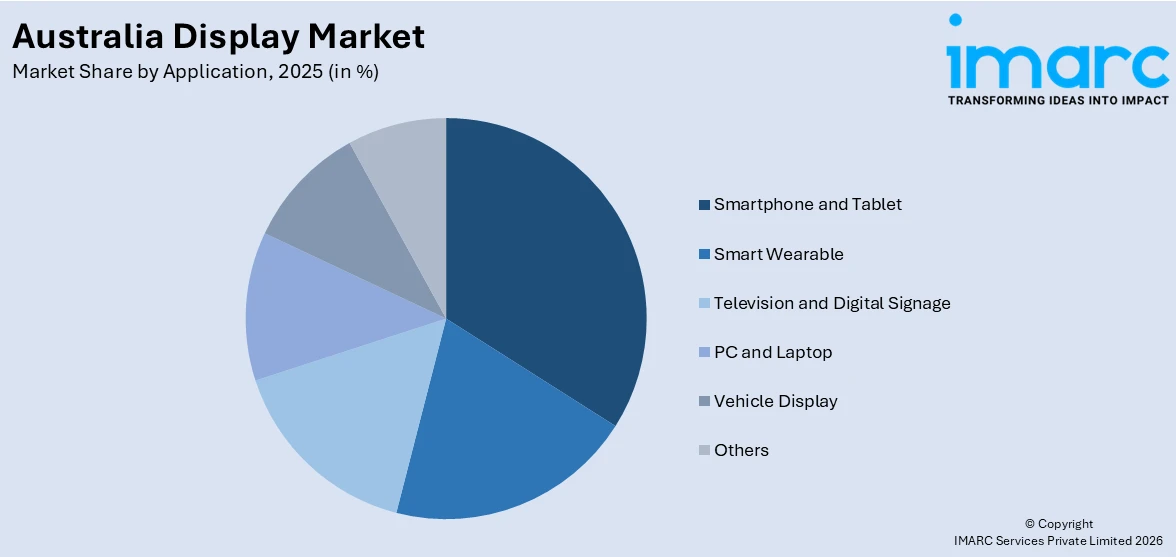
Application Insights:
Access the comprehensive market breakdown Request Sample
- Smartphone and Tablet
- Smart Wearable
- Television and Digital Signage
- PC and Laptop
- Vehicle Display
- Others
A detailed breakup and analysis of the market based on the application have also been provided in the report. This includes smartphone and tablet, smart wearable, television and digital signage, PC and laptop, vehicle display, and others.
Industry Vertical Insights:
- BFSI
- Retail
- Healthcare
- Consumer Electronics
- Military and Defense
- Automotive
- Others
The report has provided a detailed breakup and analysis of the market based on the industry vertical. This includes BFSI, retail, healthcare, consumer electronics, military and defense, automotive, and others.
Regional Insights:
- Australia Capital Territory & New South Wales
- Victoria & Tasmania
- Queensland
- Northern Territory & Southern Australia
- Western Australia
The report has also provided a comprehensive analysis of all the major regional markets, which include Australia Capital Territory & New South Wales, Victoria & Tasmania, Queensland, Northern Territory & Southern Australia, and Western Australia.
Competitive Landscape:
The market research report has also provided a comprehensive analysis of the competitive landscape. Competitive analysis such as market structure, key player positioning, top winning strategies, competitive dashboard, and company evaluation quadrant has been covered in the report. Also, detailed profiles of all major companies have been provided.
Australia Display Market News:
- In April 2025, News Corp completed the sale of Foxtel Group to DAZN Group for A$592 million, following regulatory approvals. News Corp received a 6% minority stake in DAZN and remains committed to supporting Australian sport and entertainment. The sale strengthens News Corp’s balance sheet, enabling a greater focus on core growth areas, while DAZN is expected to drive Foxtel’s next phase of growth in sports and entertainment.
- In March 2025, ESPN will launch on Disney+ in Australia and New Zealand, available to both Disney+ Premium and Standard subscribers. This marks the first English-speaking markets outside North America to offer ESPN content. Subscribers will gain access to over 10,000 hours of live sports, including NBA, WNBA, NHL, and popular shows like "SportsCenter" and "The Pat McAfee Show." ESPN is also celebrating 30 years in Australia in 2025.
Australia Display Market Report Coverage:
| Report Features | Details |
|---|---|
| Base Year of the Analysis | 2025 |
| Historical Period | 2020-2025 |
| Forecast Period | 2026-2034 |
| Units | Million USD |
| Scope of the Report | Exploration of Historical Trends and Market Outlook, Industry Catalysts and Challenges, Segment-Wise Historical and Future Market Assessment:
|
| Display Types Covered | Flat Panel Display, Flexible Panel Display, Transparent Panel Display |
| Technologies Covered | OLED, Quantum Dot, LED, LCD, E-Paper, Others |
| Applications Covered | Smartphone and Tablet, Smart Wearable, Television and Digital Signage, PC and Laptop, Vehicle Display, Others |
| Industry Verticals Covered | BFSI, Retail, Healthcare, Consumer Electronics, Military and Defense, Automotive, Others |
| Regions Covered | Australia Capital Territory & New South Wales, Victoria & Tasmania, Queensland, Northern Territory & Southern Australia, Western Australia |
| Customization Scope | 10% Free Customization |
| Post-Sale Analyst Support | 10-12 Weeks |
| Delivery Format | PDF and Excel through Email (We can also provide the editable version of the report in PPT/Word format on special request) |
Key Questions Answered in This Report:
- How has the Australia display market performed so far and how will it perform in the coming years?
- What is the breakup of the Australia display market on the basis of display type?
- What is the breakup of the Australia display market on the basis of technology?
- What is the breakup of the Australia display market on the basis of application?
- What is the breakup of the Australia display market on the basis of industry vertical?
- What is the breakup of the Australia display market on the basis of region?
- What are the various stages in the value chain of the Australia display market?
- What are the key driving factors and challenges in the Australia display market?
- What is the structure of the Australia display market and who are the key players?
- What is the degree of competition in the Australia display market?
Key Benefits for Stakeholders:
- IMARC’s industry report offers a comprehensive quantitative analysis of various market segments, historical and current market trends, market forecasts, and dynamics of the Australia display market from 2020-2034.
- The research report provides the latest information on the market drivers, challenges, and opportunities in the Australia display market.
- Porter's five forces analysis assist stakeholders in assessing the impact of new entrants, competitive rivalry, supplier power, buyer power, and the threat of substitution. It helps stakeholders to analyze the level of competition within the Australia display industry and its attractiveness.
- Competitive landscape allows stakeholders to understand their competitive environment and provides an insight into the current positions of key players in the market.
Need more help?
- Speak to our experienced analysts for insights on the current market scenarios.
- Include additional segments and countries to customize the report as per your requirement.
- Gain an unparalleled competitive advantage in your domain by understanding how to utilize the report and positively impacting your operations and revenue.
- For further assistance, please connect with our analysts.
 Request Customization
 Speak to an Analyst
 Request Brochure
 Inquire Before Buying
Benefits of Customization
- Personalize this research
- Triangulate with your data
- Get data as per your format and definition
- Gain a deeper dive into a specific application, geography, customer, or competitor
- Any level of personalization
Get in Touch With Us
UNITED STATES
Phone: +1-201-971-6302
INDIA
Phone: +91-120-433-0800
UNITED KINGDOM
Phone: +44-753-714-6104
Email: [email protected]
Client Testimonials


.webp)


