
Australia E-Bike Market Size, Share, Trends and Forecast by Mode, Motor Type, Battery Type, Class, Design, Application, and Region, 2026-2034
Australia E-Bike Market Size, Share, Trends & Forecast (2026-2034)
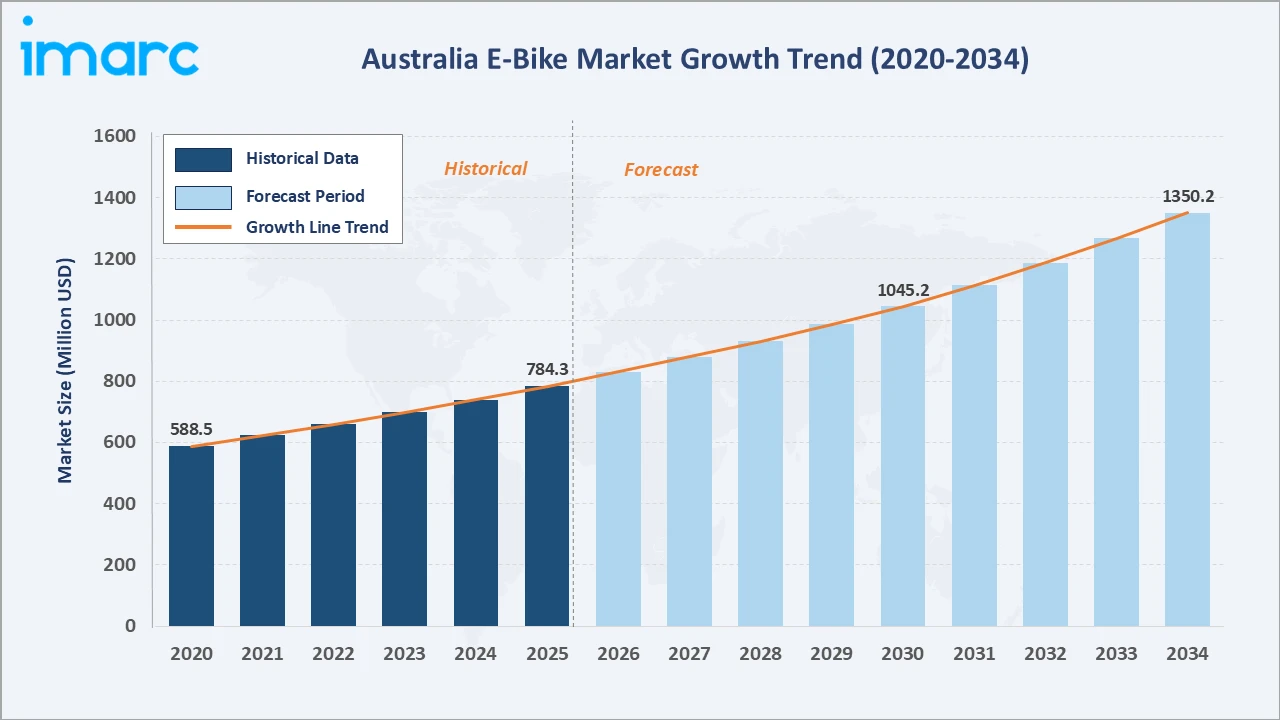
The Australia e-bike market was valued at USD 784.3 Million in 2025 and is projected to reach USD 1,350.2 Million by 2034, exhibiting a CAGR of 5.91% during 2026-2034. The market is supported by rising consumer interest in sustainable mobility, expanding urban cycling infrastructure, and growing adoption of electric two-wheelers for daily commuting.
Pedal assist leads the mode segment at 68.4%, hub motor dominates the motor type segment at 61.7%, and Australia Capital Territory & New South Wales commands 38.6% of regional share.
Market Snapshot
|
Metric |
Value |
|
Market Size (2025) |
USD 784.3 Million |
|
Forecast Market Size (2034) |
USD 1,350.2 Million |
|
CAGR (2026-2034) |
5.91% |
|
Base Year |
2025 |
|
Historical Period |
2020-2025 |
|
Forecast Period |
2026-2034 |
|
Largest Region |
Australia Capital Territory & New South Wales (38.6%, 2025) |
|
Second Largest Region |
Victoria & Tasmania (25.7% share, 2025) |
|
Leading Mode |
Pedal Assist (68.4%, 2025) |
|
Leading Motor Type |
Hub Motor (61.7%, 2025) |
The Australia e-bike market expanded from USD 588.5 Million in 2020 to USD 784.3 Million in 2025, driven by widening urban commuter adoption, growing fleet and delivery use, and steady improvement in battery affordability. Anchored at USD 1045.2 Million in 2030, the forecast to USD 1,350.2 Million by 2034 is supported by accelerating throttle-segment adoption, expanding mid drive penetration, and a maturing state-level safety and compliance framework.
To get more information on this market, Request Sample
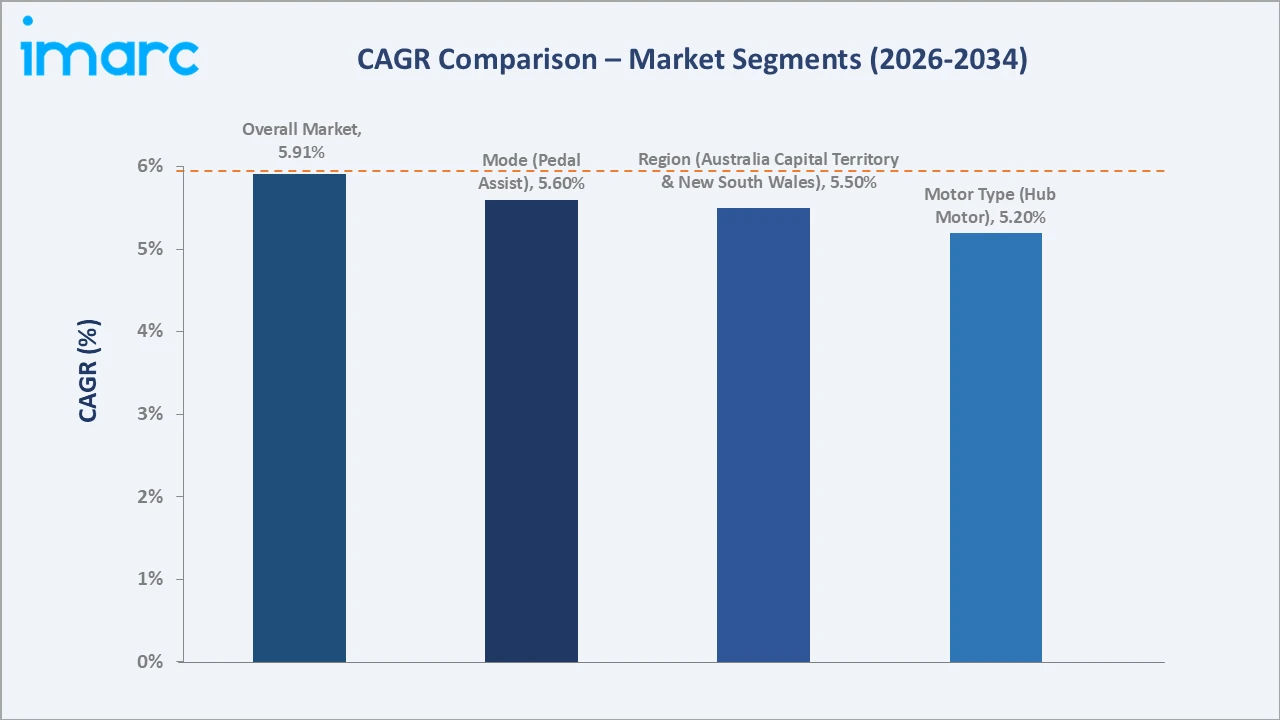
CAGR trajectories across mode, motor type, and regional sub-segments show throttle and mid drive expanding faster than the overall 5.91% market CAGR, driven by growing commercial fleet demand, performance-oriented riders, and rising uptake in regional growth markets, such as Queensland.
Executive Summary
The Australia e-bike market is on a steady growth trajectory, expanding from USD 588.5 Million in 2020 to USD 784.3 Million in 2025 and projected to reach USD 1,350.2 Million by 2034. Growth is anchored in rising urban commuting demand, last-mile delivery adoption, and a broader shift toward sustainable personal mobility across metropolitan and regional Australia.
Pedal assist leads the mode segment at 68.4% in 2025, supported by rider familiarity, lower running costs, and broad model availability, while hub motor dominates the motor type segment at 61.7% owing to simpler maintenance and accessible price points. Australia Capital Territory & New South Wales commands 38.6% of regional share in 2025, aided by dense urban populations and established cycling networks.
Key Market Insights
|
Insight |
Data |
|
Leading Mode |
Pedal Assist - 68.4% share (2025) |
|
Second Largest Mode |
Throttle - 31.6% share (2025) |
|
Leading Motor Type |
Hub Motor - 61.7% share (2025) |
|
Second Largest Motor Type |
Mid Drive - 29.6% share (2025) |
|
Leading Region |
Australia Capital Territory & New South Wales - 38.6% share (2025) |
|
Second Largest Region |
Victoria & Tasmania - 25.7% share (2025) |
|
Top Companies |
Giant Manufacturing Co., Ltd., Trek Bicycle Corporation, Specialized Bicycle Components, Inc., LTP Sports Group Inc. |
Key Analytical Observations Supporting the Above Data:
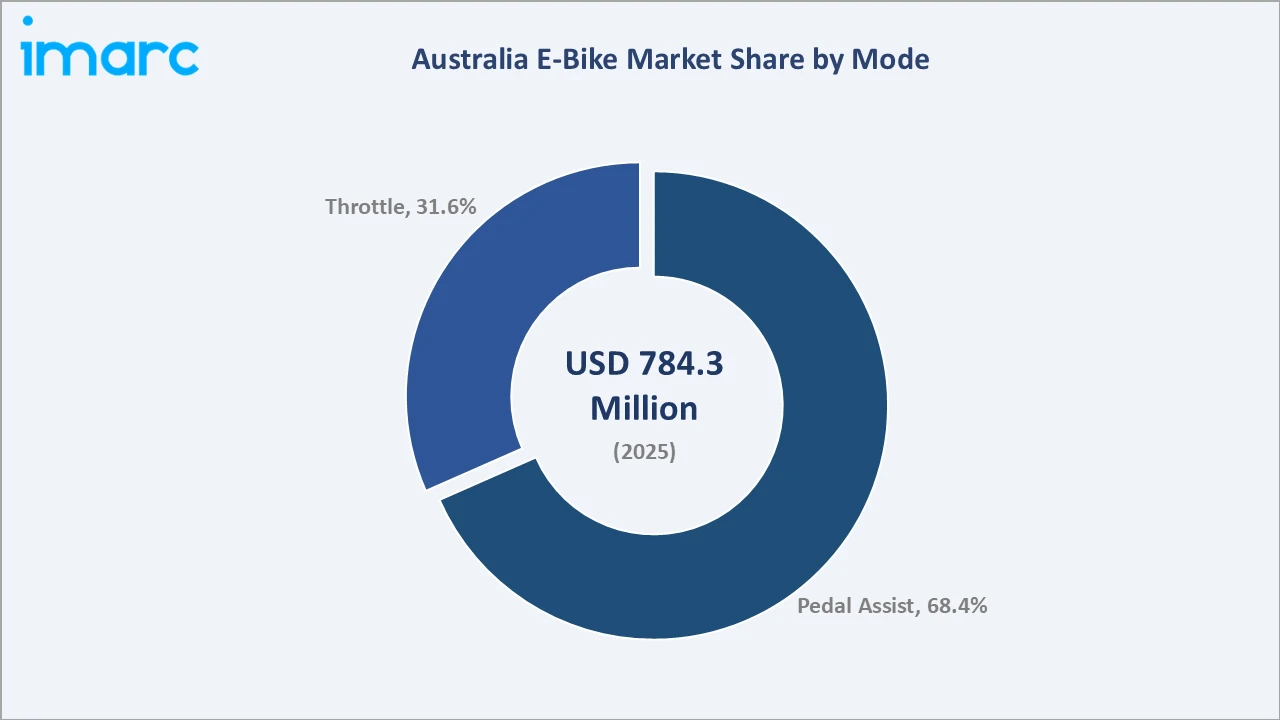
- Pedal assist dominance at 68.4% is supported by strong rider familiarity, lower running costs relative to throttle models, and consistent availability across commuter and recreational bike categories, keeping it the preferred choice for everyday Australian riders.
- Throttle share at 31.6% is expanding as delivery riders and performance-oriented commuters favor instant acceleration and reduced pedaling effort, particularly across dense metropolitan corridors and last-mile logistics operations.
- Hub motor leadership at 61.7% reflects buyer preference for simpler drivetrains, lower upfront cost, and reduced maintenance complexity compared with mid drive systems, especially among first-time e-bike owners.
- Mid drive at 29.6% is the faster-growing motor type as performance riders and hilly-terrain commuters increasingly favor its improved weight balance and torque response over standard hub-based systems.
- Australia Capital Territory & New South Wales at 38.6% dominates regional share, anchored by Sydney and Canberra's dense commuter base, established cycling infrastructure, and high concentration of retail and service networks.
Australia E-Bike Market Overview
An e-bike pairs a battery-powered motor with pedal assist or throttle-based propulsion, offering riders reduced physical effort across commuting, recreational, and delivery use cases. Rising demand for low-cost, sustainable commuting alternatives is broadening the electric bicycle in Australia market across both metropolitan and regional communities, with growing interest spanning first-time commuters, recreational riders, and commercial delivery operators alike.
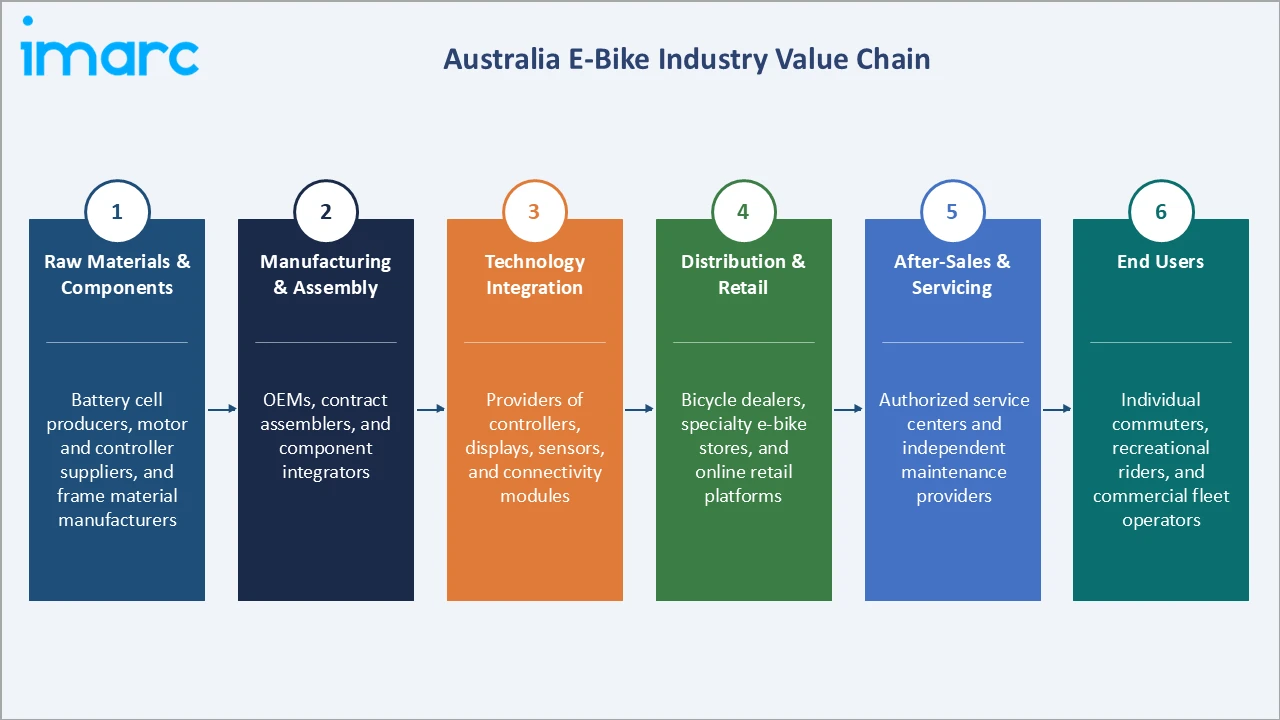
The Australian ecosystem connects battery and motor component suppliers, frame manufacturers and assemblers, retail and online distribution channels, after-sales service networks, and federal and state regulators overseeing import safety and road-use standards. Macroeconomic factors, including fuel prices, urban congestion, and household transport costs, continue to shape purchase decisions across commuter and fleet segments alike.
Market Dynamics
To evaluate market opportunities, Request Sample
Market Drivers
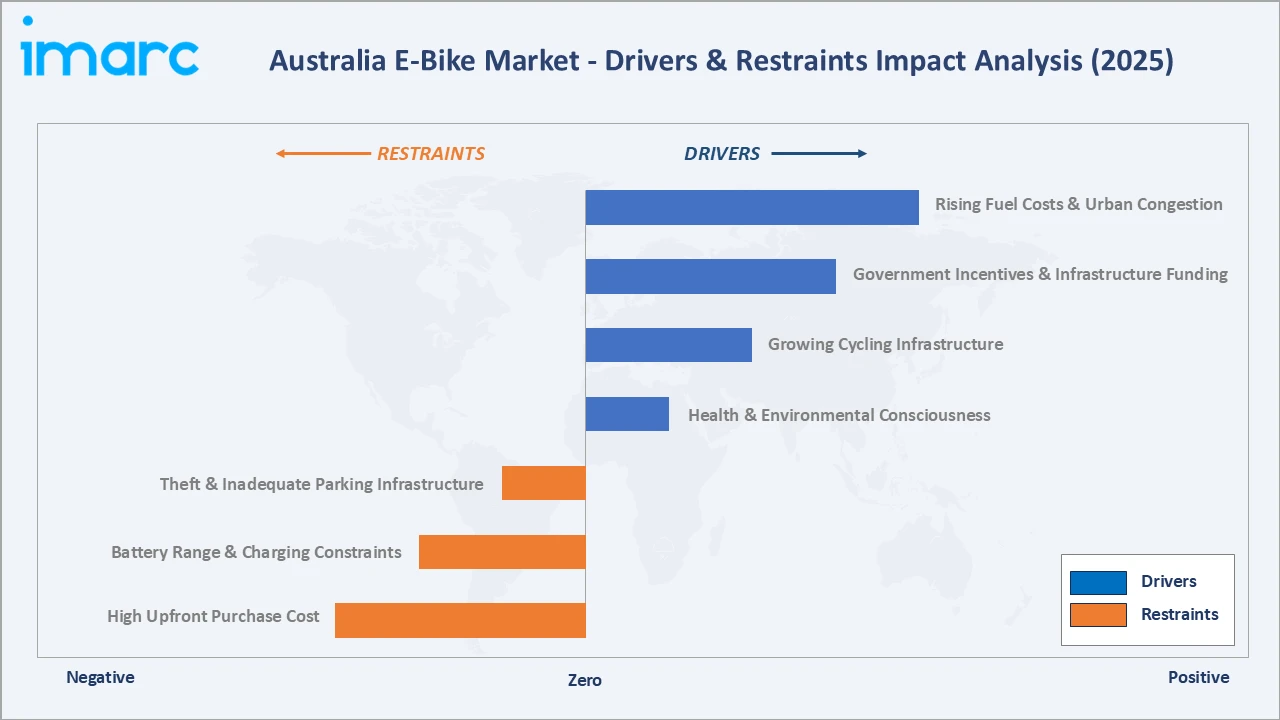
- Rising Fuel Costs & Urban Congestion: Elevated running costs of cars and persistent inner-city traffic congestion are pushing commuters toward e-bikes as a faster, lower-cost alternative for short and medium urban trips. In 2025, Melbourne ranked as the second-most congested city in Australia, with the capital of Victoria noting a congestion level of 52.9%. Melbourne motorists spent an average of 103 hours annually stuck in traffic.
- Government Incentives & Infrastructure Funding: Federal and state-level support for active transport, cycling infrastructure, and low-emission mobility is improving e-bike accessibility and encouraging investment in supporting infrastructure.
- Growing Cycling Infrastructure: Expanding dedicated cycleways and shared paths across state capitals are lowering safety concerns and encouraging first-time e-bike adoption among commuters and recreational riders.
- Health & Environmental Consciousness: Increasing consumer focus on personal fitness and lower-emission transport is broadening the addressable rider base beyond traditional cycling enthusiasts.
Market Restraints
- High Upfront Purchase Cost: E-bikes carry a meaningfully higher purchase price than standard bicycles, which continues to limit adoption among price-sensitive and casual riders.
- Battery Range & Charging Constraints: Limited public charging access and range anxiety on longer commutes remain a barrier for riders considering e-bikes as a primary transport mode.
- Theft & Inadequate Parking Infrastructure: Insufficient secure parking and rising theft incidents in dense urban centers are discouraging some commuters from switching to e-bikes for daily use.
Market Opportunities
- Last-Mile Delivery & Fleet Expansion: Growing reliance on e-bikes for food and parcel delivery is opening a durable commercial demand pool distinct from the consumer recreational segment.
- Regional Tourism & Rental Circuits: Tourism operators in regional destinations are increasingly deploying e-bike rental fleets, creating new revenue channels beyond core retail sales.
Market Challenges
- Inconsistent State-Level Regulations: Differing state-level rules on power output, speed limits, and permitted riding areas create compliance complexity for manufacturers and retailers operating nationally.
- Low-Quality Imports & Compliance Risk: A wave of non-compliant, low-cost imports has prompted safety concerns and enforcement action, complicating the operating environment for compliant brands.
Emerging Market Trends
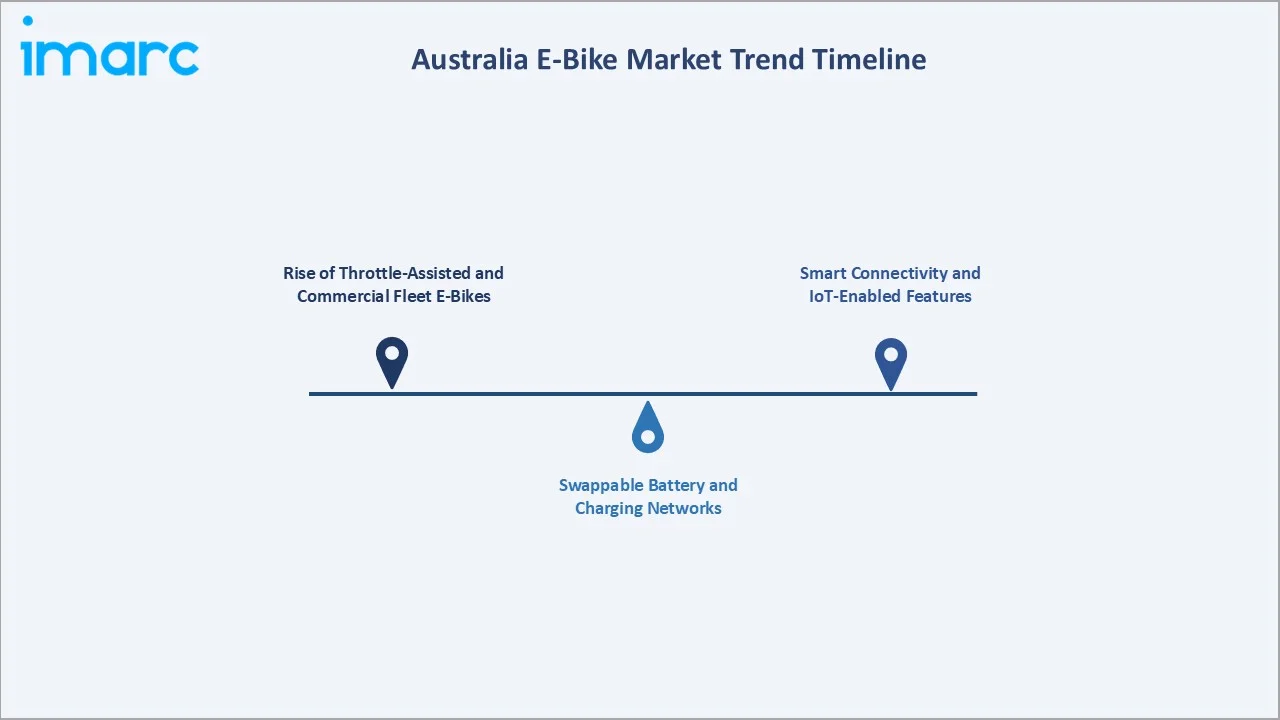
1. Rise of Throttle-Assisted and Commercial Fleet E-Bikes
Delivery and courier operators are increasingly favoring throttle-enabled models for their reduced rider fatigue and faster point-to-point speed, pushing manufacturers to expand throttle-specific product lines alongside traditional pedal assist ranges.
2. Swappable Battery and Charging Networks
Operators and retailers are piloting swappable battery systems and public charging points to address range anxiety, particularly across dense metropolitan delivery corridors where continuous vehicle uptime is commercially important.
3. Smart Connectivity and IoT-Enabled Features
Connected displays, GPS-enabled anti-theft tracking, and app-based ride analytics are becoming standard on premium models, mirroring broader smart-mobility trends and supporting fleet operators' need for real-time vehicle visibility.
Industry Value Chain Analysis
The Australia e-bike value chain spans six stages, from component sourcing through end-user servicing. Battery and motor technology, along with distribution reach, capture the highest value-add, while after-sales servicing and compliance capability increasingly influence sustainable competitive position.
|
Stage |
Key Players / Examples |
|
Raw Materials & Components |
Battery cell producers, motor and controller suppliers, and frame material manufacturers |
|
Manufacturing & Assembly |
OEMs, contract assemblers, and component integrators |
|
Technology Integration |
Providers of controllers, displays, sensors, and connectivity modules |
|
Distribution & Retail |
Bicycle dealers, specialty e-bike stores, and online retail platforms |
|
After-Sales & Servicing |
Authorized service centers and independent maintenance providers |
|
End Users |
Individual commuters, recreational riders, and commercial fleet operators |
As per Australia e-bike industry analysis, manufacturers that control proprietary battery and motor technology, alongside direct distribution relationships, are better positioned to capture value than partners reliant on third-party components and indirect retail channels.
Technology Landscape in the Australia E-Bike Industry
Battery Technology
Lithium-ion battery packs remain the dominant power source, with manufacturers steadily improving energy density and cycle life. Interest in swappable and modular battery formats is rising among fleet operators seeking to minimize downtime.
Materials Innovation
Lightweight aluminum and composite frame construction is becoming standard across premium models, improving ride handling while accommodating the added weight of motor and battery components without compromising durability.
Smart Connectivity
Integrated displays, smartphone app pairing, and GPS-based anti-theft tracking are increasingly featured on mid-range and premium e-bikes, supporting both consumer convenience and commercial fleet management needs.
Automation
Automatic gear-shifting systems and torque-sensing pedal assist are improving ride smoothness, while manufacturers explore predictive maintenance features that flag battery degradation and component wear before failure occurs.
Market Segmentation Analysis
The report covers the following segments:
|
Segment Category |
Leading Segment |
Market Share |
Year |
|
Mode |
Pedal Assist |
68.4% |
2025 |
|
Motor Type |
Hub Motor |
61.7% |
2025 |
|
Battery Type |
🔒 |
🔒 |
2025 |
|
Class |
🔒 |
🔒 |
2025 |
|
Design |
🔒 |
🔒 |
2025 |
|
Application |
🔒 |
🔒 |
2025 |
|
Region |
Australia Capital Territory & New South Wales |
38.6% |
2025 |

By Mode
Pedal assist commands a 68.4% majority share in 2025, driven by rider familiarity, lower running costs, and its suitability across commuting, recreational, and fitness-oriented use cases. The segment benefits from broad model availability across price points and continues to anchor mainstream adoption.
To access detailed market analysis, Request Sample
Throttle at 31.6% in 2025 is gaining ground fastest among delivery riders and performance-focused commuters who value instant acceleration. Its future outlook remains strong as commercial fleet operators increasingly standardize on throttle-enabled models for last-mile logistics.
By Motor Type
Hub motor leads with 61.7% share in 2025, reflecting buyer preference for simpler drivetrains, lower upfront cost, and reduced maintenance complexity. The segment remains the default choice for first-time e-bike owners and value-focused commuter models.
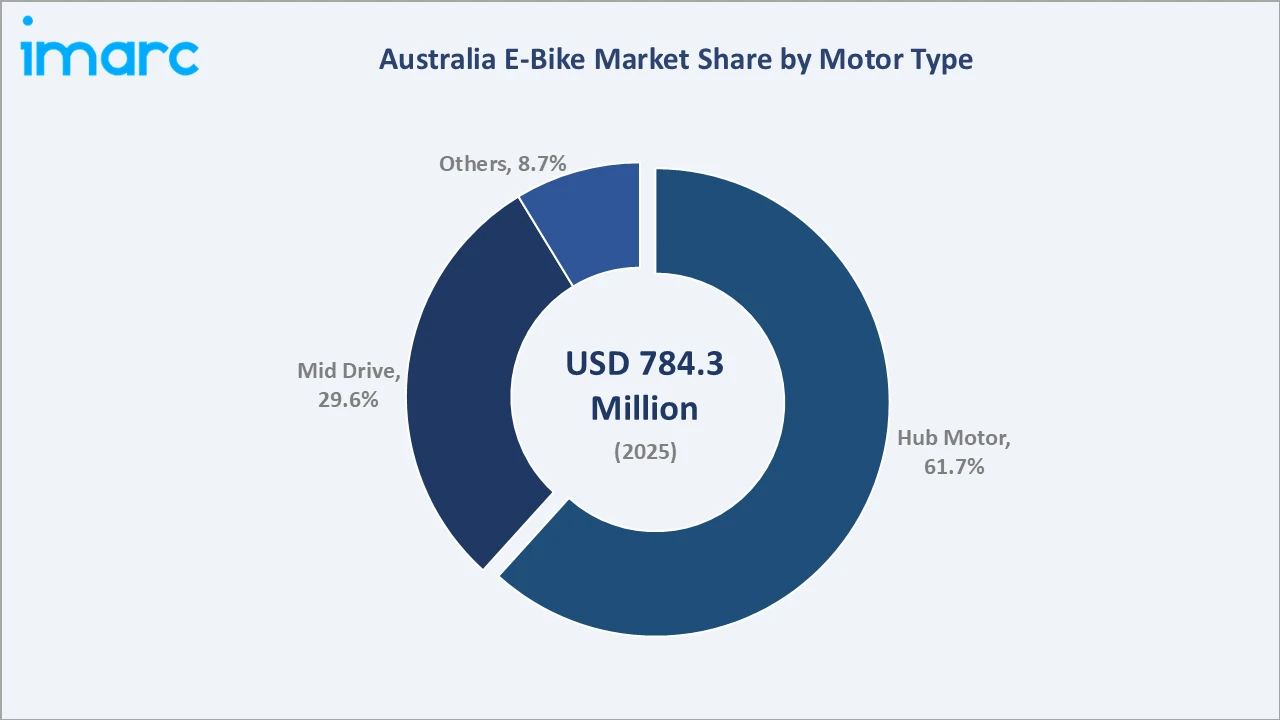
Mid drive at 29.6% is expanding through growing demand from performance and hilly-terrain riders who value improved weight balance and torque response.
Regional Market Insights
|
Region |
Share (2025) |
Key Growth Drivers |
|
Australia Capital Territory & New South Wales |
38.6% |
Large urban population, established cycling infrastructure, high commuter density, and strong retail network presence |
|
Victoria & Tasmania |
25.7% |
Growing active transport investment, expanding urban cycleways, and rising commuter and recreational adoption |
|
Queensland |
16.4% |
Rapid infrastructure expansion, rising tourism-linked rental demand, and growing urban population in key metro corridors |
|
Western Australia |
11.8% |
Increasing government cycling investment, favorable climate for year-round riding, and expanding retail distribution |
|
Northern Territory & Southern Australia |
7.5% |
Emerging infrastructure development, growing awareness of e-bike benefits, and gradual retail network expansion |
Australia Capital Territory & New South Wales at 38.6% in 2025 leads the regional landscape, anchored by Sydney and Canberra's dense commuter populations and mature retail networks. Established cycling infrastructure and strong service-network coverage support sustained leadership across both commuter and recreational use cases.
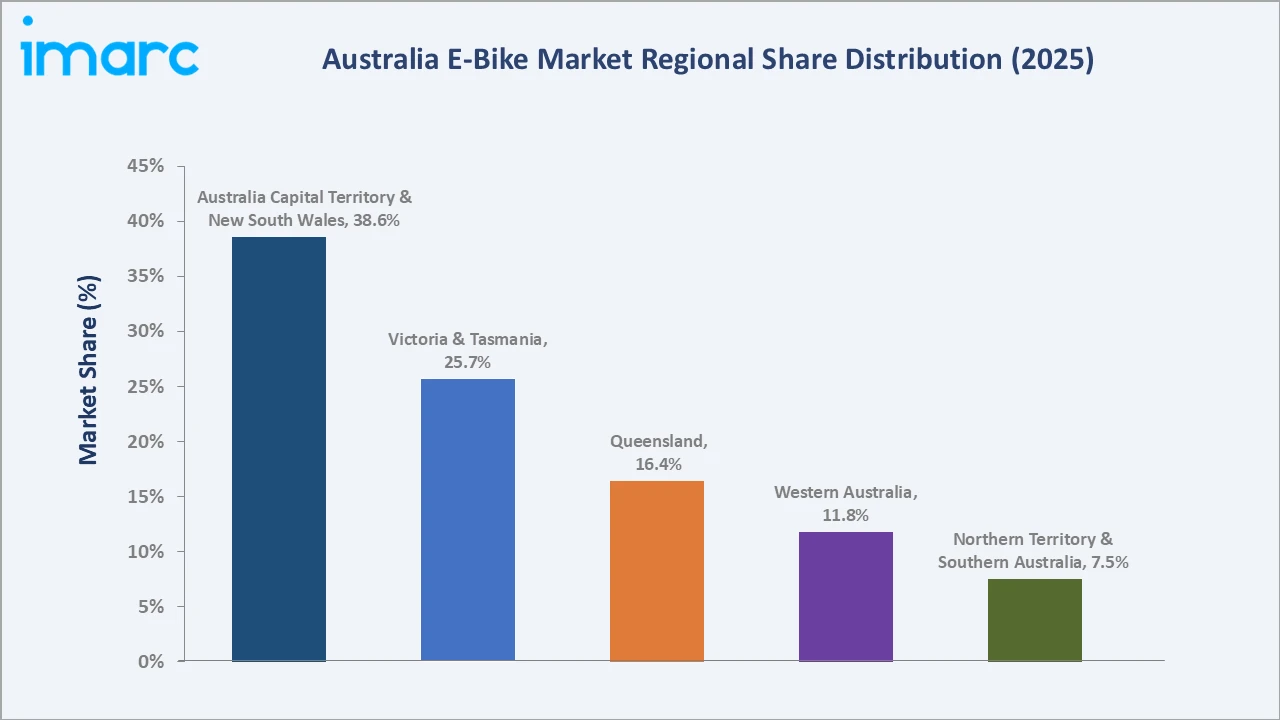
Queensland at 16.4% is emerging as a fast-growing region. Expanding cycling infrastructure investment, rising tourism-linked rental demand, and growing metropolitan populations are accelerating regional expansion through 2034.
Competitive Landscape
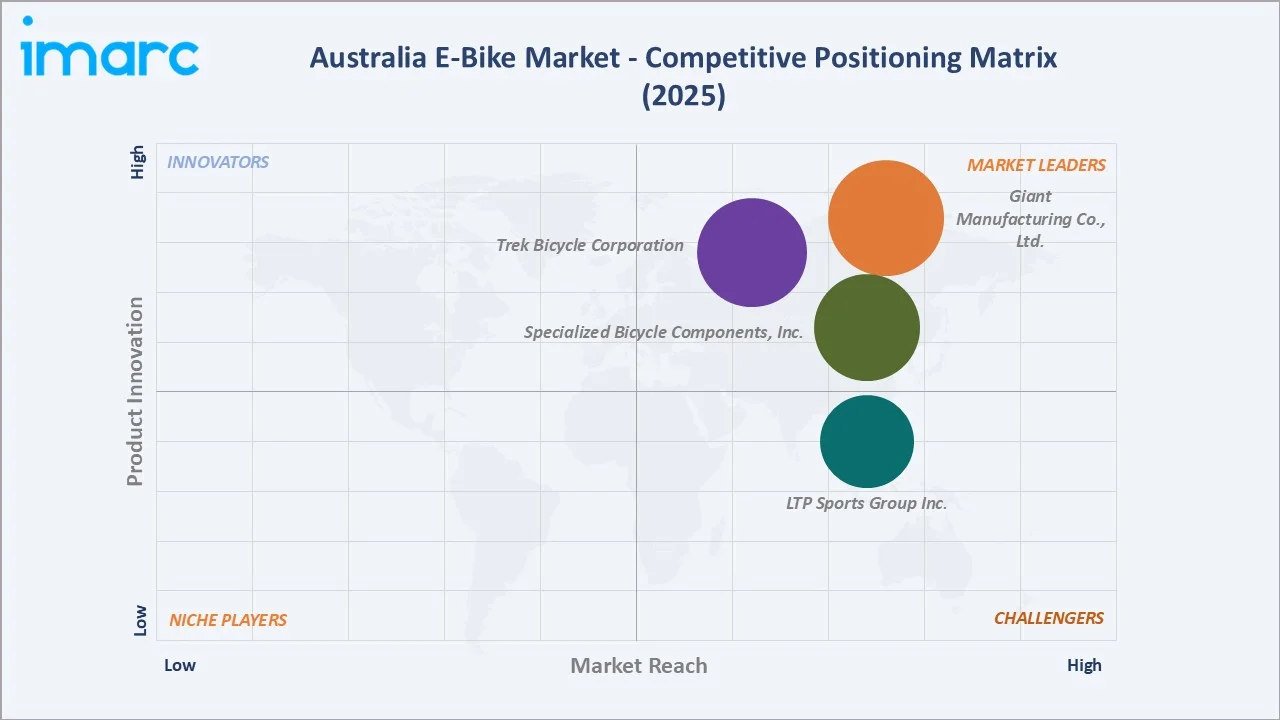
The Australia e-bike market is moderately fragmented, with established global bicycle manufacturers leading brand reach and distribution while regional and direct-to-consumer specialists compete on niche commercial and fleet-oriented formats. Brand strength, distribution network depth, and battery and motor technology form the key competitive moats shaping positioning across the market.
|
Company Name |
Brand / Key Product |
Position |
Strategic Focus |
|
Giant Manufacturing Co., Ltd. |
Giant E-Bikes |
Leader |
Scale-driven global manufacturing with expanding regional distribution |
|
Trek Bicycle Corporation |
Trek E-Bikes |
Leader |
Broad product portfolio supported by established dealer networks |
|
Specialized Bicycle Components, Inc. |
Specialized Turbo Levo |
Leader |
Technology-led product development with premium positioning |
|
LTP Sports Group Inc. |
Norco |
Challenger |
Terrain-focused product design with dealer-led retail presence |
Key players include Giant Manufacturing Co., Ltd., Trek Bicycle Corporation, Specialized Bicycle Components, Inc., and LTP Sports Group Inc., among others.
Key Company Profiles
Giant Manufacturing Co., Ltd.
Giant Manufacturing Co., Ltd. is a global bicycle and e-bike manufacturer with an established retail presence across major cycling markets, including Australia. The company markets its e-bikes under the Giant E-Bikes brand through an extensive dealer network.
- Product Portfolio: A broad range of pedal assist e-bikes marketed under the Giant E-Bikes brand, sold through an extensive dealer network across Australia.
- Recent Developments: The company continues to expand its e-bike offerings and strengthen its distribution network across key regions.
- Strategic Focus: Leveraging global manufacturing scale and distribution reach to expand its e-bike range across established and emerging markets.
Trek Bicycle Corporation
Trek Bicycle Corporation is a global bicycle and e-bike manufacturer with a broad international dealer network, including retail partners across Australia. The company markets its e-bikes under the Trek E-Bikes brand.
- Product Portfolio: A range of pedal assist e-bikes marketed under the Trek E-Bikes brand, spanning commuter, trekking, and performance categories.
- Recent Developments: The company continues to refresh its e-bike lineup and expand dealer partnerships to strengthen its international distribution footprint.
- Strategic Focus: Maintaining product quality and dealer network strength to support long-term brand positioning in the e-bike category.
Specialized Bicycle Components, Inc.
Specialized Bicycle Components, Inc. is a global bicycle and e-bike manufacturer known for its Specialized Turbo Levo e-bike range, available through retail partners in Australia.
- Product Portfolio: E-bikes marketed under the Specialized Turbo Levo nameplate, spanning mountain and performance-oriented categories.
- Recent Developments: The company continues to update its Specialized Turbo Levo range with incremental technology and performance improvements.
- Strategic Focus: Focusing on technology-led product development to maintain a premium market position.
Market Concentration Analysis
The Australia e-bike market is moderately fragmented, with the top players accounting for a meaningful but non-dominant share of overall sales, reflecting the presence of established global manufacturers alongside a growing base of regional and direct-to-consumer specialists.
Barriers to entry include the need for compliant battery and motor certification, established dealer or service network relationships, and the capital intensity of maintaining consistent product supply. These factors favor manufacturers with existing global scale and distribution infrastructure.
Consolidation is gradually increasing as larger manufacturers expand distribution partnerships and smaller regional players seek scale through dealer network alliances. Strategic partnerships between manufacturers, fleet operators, and retail chains are reinforcing competitive positioning across the market.
Investment & Growth Opportunities
Fastest-Growing Segments
Throttle expands fastest among mode categories, driven by commercial delivery adoption and rider preference for reduced pedaling effort. Mid drive is the next-fastest motor type, supported by growing demand from performance-oriented and hilly-terrain riders.
Emerging Markets
Queensland represents a significant opportunity as infrastructure investment and tourism-linked rental demand expand. The market offers meaningful untapped potential for operators able to deliver region-specific retail and servicing networks.
Investment Trends
Investment activity is concentrated in subscription-based fleet platforms, battery and charging infrastructure, and direct-to-consumer retail expansion. Capital is also flowing into servicing and maintenance networks that support the growing installed base of e-bikes across Australian cities.
Future Market Outlook (2026-2034)
The Australia e-bike market is forecast to expand from USD 784.3 Million in 2025 to USD 1,350.2 Million by 2034 at a CAGR of 5.91%, adding roughly USD 565.9 Million in incremental market value over the forecast period.
Four forces will shape Australia e-bike industry growth through 2034: maturing state and federal safety standards; the rise of throttle and mid drive product categories; deeper integration of smart connectivity features; and continued expansion of commercial fleet and delivery-oriented demand.
By 2034, the Australia e-bike market is expected to be defined by broader mainstream commuter adoption, a more consolidated regulatory framework, and growing overlap between consumer and commercial fleet product categories as manufacturers diversify their portfolios.
Research Methodology
Primary Research
Primary research included structured discussions with retail dealers, fleet operators, component suppliers, and industry association representatives, validating market sizing, segment mix, and regional demand patterns.
Secondary Research
Secondary sources included government transport department publications, state parliamentary inquiry reports, industry association data, and company disclosures from listed and private e-bike manufacturers.
Forecasting Models
Market forecasts used top-down and bottom-up models combining historical sales trends, regional infrastructure investment data, and regulatory transition scenarios across mode and motor type categories.
Australia E-Bike Market Report Coverage:
| Report Features | Details |
|---|---|
| Base Year of the Analysis | 2025 |
| Historical Period | 2020-2025 |
| Forecast Period | 2026-2034 |
| Units | Million USD |
| Scope of the Report |
Exploration of Historical Trends and Market Outlook, Industry Catalysts and Challenges, Segment-Wise Historical and Future Market Assessment:
|
| Modes Covered | Throttle, Pedal Assist |
| Motor Types Covered | Hub Motor, Mid Drive, Others |
| Battery Types Covered | Lead Acid, Lithium Ion, Nickel-Metal Hydride (NiMH), Others |
| Classes Covered | Class I, Class II, Class III |
| Designs Covered | Foldable, Non-Foldable |
| Applications Covered | Mountain/Trekking Bikes, City/Urban, Cargo, Others |
| Regions Covered | Australia Capital Territory & New South Wales, Victoria & Tasmania, Queensland, Northern Territory & South Australia, Western Australia |
| Companies Covered | Giant Manufacturing Co., Ltd., Trek Bicycle Corporation, Specialized Bicycle Components, Inc., LTP Sports Group Inc., etc. |
| Customization Scope | 10% Free Customization |
| Post-Sale Analyst Support | 10-12 Weeks |
| Delivery Format | PDF and Excel through Email (We can also provide the editable version of the report in PPT/Word format on special request) |
Key Benefits for Stakeholders:
- IMARC’s industry report offers a comprehensive quantitative analysis of various market segments, historical and current market trends, market forecasts, and dynamics of the Australia e-bike market from 2020-2034.
- The research report provides the latest information on the market drivers, challenges, and opportunities in the Australia e-bike market.
- Porter's five forces analysis assist stakeholders in assessing the impact of new entrants, competitive rivalry, supplier power, buyer power, and the threat of substitution. It helps stakeholders to analyze the level of competition within the Australia e-bike industry and its attractiveness.
- Competitive landscape allows stakeholders to understand their competitive environment and provides an insight into the current positions of key players in the market.
Frequently Asked Questions About the Australia E-Bike Market Report
The Australia e-bike market was valued at USD 784.3 Million in 2025, driven by rising urban commuting demand, government infrastructure funding, and growing last-mile delivery adoption.
The market is projected to grow at a CAGR of 5.91% from 2026-2034, reaching USD 1,350.2 Million, supported by expanding throttle and mid drive adoption.
Pedal assist leads the mode segment at 68.4% in 2025, driven by strong rider familiarity, lower running costs, and broad availability across commuter and recreational e-bike categories.
Hub motor dominates the motor type segment at 61.7% in 2025, reflecting buyer preference for simpler drivetrains, lower upfront cost, and reduced maintenance complexity.
Australia Capital Territory & New South Wales commands 38.6% in 2025, led by dense urban populations and established cycling infrastructure.
Queensland is emerging as the fastest-growing region, supported by expanding infrastructure investment and rising tourism-linked rental demand.
Leading players include Giant Manufacturing Co., Ltd., Trek Bicycle Corporation, Specialized Bicycle Components, Inc., and LTP Sports Group Inc., among others.
Tightening state-level safety enforcement and moves toward a harmonized national standard are reshaping compliance requirements for manufacturers and retailers.
High upfront purchase cost, limited charging infrastructure, and theft-related concerns in dense urban centers remain key adoption barriers.
Smart connectivity, swappable battery systems, and torque-sensing pedal assist are improving rider experience and supporting commercial fleet management needs.
Need more help?
- Speak to our experienced analysts for insights on the current market scenarios.
- Include additional segments and countries to customize the report as per your requirement.
- Gain an unparalleled competitive advantage in your domain by understanding how to utilize the report and positively impacting your operations and revenue.
- For further assistance, please connect with our analysts.
 Request Customization
 Speak to an Analyst
 Request Brochure
 Inquire Before Buying
Benefits of Customization
- Personalize this research
- Triangulate with your data
- Get data as per your format and definition
- Gain a deeper dive into a specific application, geography, customer, or competitor
- Any level of personalization
Get in Touch With Us
UNITED STATES
Phone: +1-201-971-6302
INDIA
Phone: +91-120-433-0800
UNITED KINGDOM
Phone: +44-753-714-6104
Email: [email protected]
Client Testimonials




.webp)




.webp)













Related Reports

Choose your plan
*Please note that the prices mentioned below are starting prices for each bundle type. Kindly contact our team for further details.*
Single User License
- 1 User License, Access on 2 Devices
- PDF Report + Excel Dataset (Password Protected)
- Lifetime Access
- No Printing Rights
- 10% Free Report Customization
- 10–12 Weeks of Analyst Support
Five User License
- Access for 5 Users, 2 Devices per User
- PDF Report + Excel Dataset (Password Protected)
- Lifetime Access
- Dedicated Account Manager
- 12–14 Weeks of Analyst Support
- No Printing Rights
- 15% Free Report Customization
- 25% Discount on Your Next Purchase
Corporate User License
- Unlimited User Access (Within Your Organization)
- PDF Report + Excel Dataset
- Lifetime Access
- Dedicated Account Manager
- 14–20 Weeks of Analyst Support
- No Printing Rights
- 20% Free Report Customization
- 30% Discount on Your Next Purchase
Essential Insights
What's included:
3 reports
- Lifetime Access
- PDF Reports
- Excel Datasets
- 2 Weeks of Free Analyst Support
- 2 User Licenses
- Access on 2 Devices
- Printing Rights
- Complimentary PowerPoint (PPT) Version
- Complimentary License Upgrade
Professional Access
What's included:
5 reports
- Lifetime Access
- PDF Reports
- Excel Datasets
- 8 Weeks of Free Analyst Support
- 2 User Licenses
- Access on 2 Devices
- Printing Rights
- Complimentary PowerPoint (PPT) Version
- Complimentary License Upgrade
Business Advantage
What's included:
8 reports
- Lifetime Access
- PDF Reports
- Excel Datasets
- 14 Weeks of Free Analyst Support
- 2 User Licenses
- Access on 2 Devices
- Printing Rights
- Complimentary PowerPoint (PPT) Version
- Complimentary License Upgrade
Enterprise Intelligence
What's included:
10 reports
- Lifetime Access
- PDF Reports
- Excel Datasets
- 20 Weeks of Free Analyst Support
- 2 User Licenses
- Access on 2 Devices
- Printing Rights
- Complimentary PowerPoint (PPT) Version
- Complimentary License Upgrade