
Australia Green Hydrogen Market Size, Share, Trends and Forecast by Technology, Application, Distribution Channel, and Region, 2026-2034
Australia Green Hydrogen Market Size and Share:
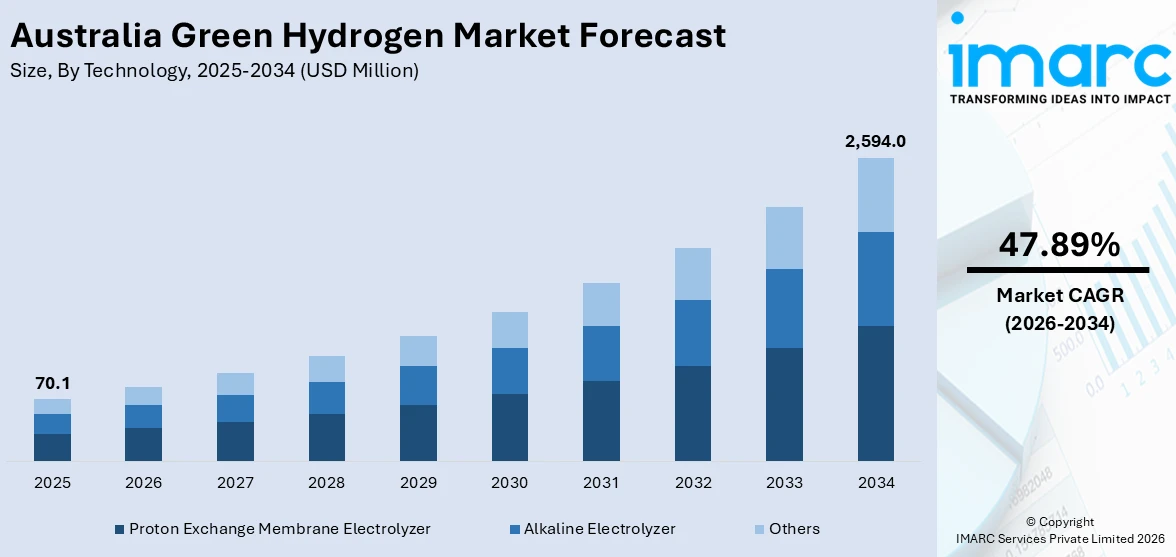
The Australia green hydrogen market size reached USD 70.1 Million in 2025. Looking forward, the market is expected to reach USD 2,594.0 Million by 2034, exhibiting a growth rate (CAGR) of 47.89% during 2026-2034. The market is driven by coordinated government incentives, including the Hydrogen Production Tax Incentive and concessional financing, which reduce early-stage project risk. Strategic international collaborations with partners in Japan, South Korea, and the EU are fueling capital inflow for export-oriented hydrogen ventures. Expanding port-based hydrogen hubs and standardized certification schemes are enhancing commercial viability, further augmenting the Australia green hydrogen market share.
|
Report Attribute
|
Key Statistics
|
|---|---|
|
Base Year
|
2025 |
|
Forecast Years
|
2026-2034
|
|
Historical Years
|
2020-2025
|
| Market Size in 2025 | USD 70.1 Million |
| Market Forecast in 2034 | USD 2,594.0 Million |
| Market Growth Rate 2026-2034 | 47.89% |
Key Trends of Australia Green Hydrogen Market:
Regulatory Enablement and Institutional Support
The market is actively shaped by a structured and coordinated policy environment. Federal and state governments have introduced dedicated hydrogen roadmaps outlining measurable objectives, with an emphasis on early infrastructure rollout, investment attraction, and technology development. Moreover, targeted funding programs are supporting feasibility studies, demonstration projects, and electrolyzer installations, while regulatory bodies work on establishing clear standards for green hydrogen production and transport. Notably, in May 2024, the Australian government unveiled a new Hydrogen Production Tax Incentive (HTPI) that would pay developers AUD 2 (USD 1.32) per kilo of green hydrogen throughout ten years beginning in 2027. Public sector financial institutions are extending concessional finance and credit enhancements to mitigate early-stage risk. In addition to this, state governments are designating renewable energy zones and green hydrogen development precincts to streamline land allocation and permitting. Concurrently, national science and innovation agencies are funding applied research into efficiency improvement and cost reduction in electrolyzer systems. By addressing market entry barriers through a combination of capital incentives, regulatory clarity, and institutional coordination, Australia is positioning itself as a first mover in scaling up green hydrogen supply. These interventions are critical to bridging the current cost differential between green and fossil-derived hydrogen and attracting long-term investment.
To get more information on this market Request Sample
Export-Focused Strategy and International Alignment
The market is structured with a clear orientation toward export markets, leveraging its comparative advantage in renewable energy resources. The country is pursuing long-term trade partnerships and investments from countries such as Japan, South Korea, and the European Union, all of which are adopting hydrogen import strategies as part of their decarbonization frameworks. For instance, in 2024, a global consortium including Iwatani Corporation, Keppel, Stanwell Corporation, and Marubeni Corporation committed AUD 117 Million to the Central Queensland Hydrogen Project (CQ-H2). The investment will fund a FEED study for one of Australia's largest green hydrogen ventures, targeting production of 200 tonnes per day by 2029 and 800 tonnes per day by 2031 using renewable energy. Additionally, the country's export strategy involves the development of port-based hydrogen hubs integrated with dedicated renewable energy generation, electrolyzer facilities, and storage infrastructure. Strategic collaboration with foreign governments and energy companies to co-develop production projects, establish shared technical standards, and ensure future offtake is providing a boost to Australia green hydrogen market growth. The approach draws from Australia's experience as a global LNG exporter, wherein long-term bilateral supply contracts underpinned upstream investments. Also, a continual effort focusing on aligning with hydrogen certification schemes to verify emissions intensity is enhancing the market appeal. These measures are intended to create commercial certainty and facilitate capital mobilization for large-scale export-ready hydrogen projects, which further contributes to the Australia green hydrogen market demand.
Growth Drivers of Australia Green Hydrogen Market:
Abundance of Land and Low Population Density for Large-Scale Projects
According to the Australia green hydrogen market analysis, the region’s widespread land area and sparse population offer a singular benefit for the production of scale-up green hydrogen via massive renewable projects. In contrast to East African nations beset by land shortage or local opposition, Australia has access to vast areas of sparsely populated or arid land—including the Pilbara in Western Australia, Eyre Peninsula in South Australia, and central Queensland—for the building of solar farms, wind farms, and electrolyser plants. These areas have high solar irradiance and stable wind regimes, which are optimal for long-duration renewable energy production. With less land-use conflict and lower costs for large installations, Australia is in a position to accommodate mega-scale hydrogen projects that can supply both domestic and overseas export markets. Furthermore, the potential to co-locate energy production and hydrogen production facilities minimize transmission losses and infrastructure costs. This geographical and demographic position enables faster project development along with long-term competitiveness in the global green hydrogen supply chain.
Existing Energy Infrastructure and Export Facilities Integration
Australia's mature energy infrastructure and established export capacity offer a robust foundation for the growth of its green hydrogen market. Australia has had decades of experience in exporting energy commodities such as liquefied natural gas (LNG), and much of the same port facilities, transport logistics, and regulation structures can be repurposed to facilitate hydrogen exports. Major ports like those in Gladstone, Darwin, and Port Kembla are being upgraded or designed for dual-use so that hydrogen—either pure or in the form of ammonia—can be transported economically to overseas markets. In addition, Australia's high-voltage transmission networks and gas pipeline infrastructure, particularly in industrial areas, can be upgraded or extended in the future to enable hydrogen blending or exclusive hydrogen transport. This flexibility shortens the timeline on projects and minimizes the amount of completely new infrastructure required, decreasing entry costs for investors and making the path to market faster. By building on what it already has, Australia can build its hydrogen vision more quickly and cheaply than a number of its international competitors, which will further escalate the Australia green hydrogen market demand.
Industrial Decarbonization and Domestic Demand Signals
In addition to exports, development in Australia's green hydrogen industry is being driven by local demand from industry and transport sectors looking for decarbonization. Steel production, refining, and chemical processing industries in areas including Gladstone, Kwinana, and Port of Brisbane are considering green hydrogen for process heat, feedstock replacement, and low-carbon fuel opportunities. Transport operators, especially in mining and freight, are testing hydrogen fuel cell trucks, trains, and equipment to cut down emissions with the same operational life expectancy. Similar to renewable hydrogen-powered mining trucks tested in Pilbara iron ore operations, such applications lend credence to the technology in extreme, real-world conditions. In addition, the insertion of hydrogen into power systems via blending trials or hydrogen-fired turbines enhances grid stability and long-duration storage in energy centers like Snowy Mountains and South West Victoria. Such local endeavors create economies of scale and local knowledge, enhancing the export approach with roots in actionable, high-impact uses that increase market resilience and speed transition.
Opportunities of Australia Green Hydrogen Market:
Development of Renewable Energy Hubs for Hydrogen Production
According to the Australia green hydrogen market analysis, the immense geography and pleasant climatic conditions of the region provides a favorable environment to create specialized renewable energy centers for the production of green hydrogen. The Mid-West in Western Australia, Queensland's Renewable Energy Zones, and Spencer Gulf in South Australia are being targeted for solar, wind, and hydrogen integrated projects. These regions are endowed with renewable resources and have access to deep-sea ports, making them suitable for massive production and export. The potential is in the production of vertically integrated supply chains—starting from clean energy production to hydrogen manufacturing and shipping. Investing in multi-gigawatt energy hubs can position Australia to supply both domestic and international demand for hydrogen. These hubs may also serve as testbeds for innovation such as water-efficient electrolysis and hybrid storage systems, which are uniquely beneficial in Australia's arid regions. Building these energy precincts will drive regional economies and jobs and make Australia the leader in the global green hydrogen revolution.
Expansion into Green Hydrogen Export Markets
Australia's strategic geographic location in the Asia-Pacific region offers a potential opportunity to become a top exporter of green hydrogen. Nations like Japan, South Korea, and Singapore are eagerly looking for secure, long-term clean hydrogen supplies to achieve their net-zero goals. Australia's current trade relationships with these countries, underpinned by stable political institutions and a reputation for secure energy exports, offer a sound platform for export market development. There is also the possibility of producing green hydrogen and converting it into ammonia for storage and transportation ease, utilizing existing port infrastructure at Darwin, Port Kembla, and Dampier. This makes it possible for Australia to export hydrogen at a cost while also building experience in associated technologies. In addition, through bilateral cooperation and hydrogen diplomacy, Australia is able to influence international standards for certification and trade frameworks, supporting its position in a future global hydrogen economy. Accessing these markets for exports provides not just economic benefits but the opportunity to stimulate regional decarbonization.
Industrial Transformation and Domestic Market Growth
The potential to decarbonize Australia's heavy industries with green hydrogen is also a significant growth opportunity. Industries like steel, cement, and chemicals are investigating the use of hydrogen to displace fossil fuels in high-temperature and emissions-intensive processes. Industrial clusters in Gladstone, Kwinana, and Whyalla, for instance, are being considered for hydrogen-powered operations through feasibility studies. These developments are facilitated by government programs and industry collaborations to develop low-carbon industrial clusters. In addition, the transport industry—specifically heavy haulage, buses, and even aviation—is starting to look at hydrogen fuel cells as a substitute for diesel. Local uptake will not just create demand but also stimulate technological innovation, skills development, and supply chain localization. As hydrogen is scaled up for production, related services including storage, compression, and distribution will provide investment opportunities. By deploying hydrogen throughout industrial and transport systems, Australia can seize an opportunity to become a leader in creating a decarbonized domestic economy as well as augmenting its international competitiveness in clean technologies.
Government Support of Australia Green Hydrogen Market:
Federal Government Policies and Strategic Roadmaps
The Australian national government has a leading role in supporting the green hydrogen industry by providing inclusive policies and strategic plans to make Australia a global hydrogen leader. The government identified hydrogen's ability to stimulate economic growth and lower carbon emissions and developed national strategies that set firm targets for hydrogen production, export, and use at home. These strategies prioritize industry collaboration, research and development, and establishing certification systems to certify hydrogen's environmental quality. Notably, the government's attention goes beyond Western Australian cities to embrace regional development with initiatives for projects in renewable-proven regions like Western Australia's Pilbara and Queensland's renewable energy corridors. This regional concentration encourages clean energy and facilitates job creation and diversification in regions historically dependent on mining and fossil fuels. By providing financing programs, grants, and incentives, the federal government is actively reducing barriers of entry for new hydrogen projects, indicating long-term support for the industry's development.
State-Level Initiatives and Regional Partnerships
Besides federal initiatives, Australian states play the key role in driving green hydrogen development, adapting initiatives to their specific renewable resources and industrial bases. Western Australia, for instance, has utilized its rich solar and wind resources in combination with deep-water ports to encourage big-scale hydrogen export schemes, frequently partnering with Asian partners to build supply chains. South Australia is prioritizing combining hydrogen production with its large wind farms and constructing hydrogen hubs around industrial clusters. The Queensland government encourages hydrogen as a path to shift its energy-intensive industries and establish new jobs. These state programs tend to be partnerships with Indigenous groups to maintain sustainable land use and social inclusion, aligning with Australia's wider commitment to responsible resource development. Through financing for infrastructure, efficient approvals, and regulatory assistance, state governments supplement federal policy, establishing a multi-level system of government that fosters innovation and lowers investment risk in the green hydrogen sector.
Research, Innovation, and Workforce Development Support
Australian government support also includes promoting research, innovation, and specialized workforce development in green hydrogen technologies. With the understanding that technological innovation and expert human capital are essential for commercial success, federal and state governments fund joint research projects among universities, research centers, and industry stakeholders. These programs target more efficient electrolyzer development, the creation of water-conserving electrolysis technologies suitable for Australia's dry climate, and the infusion of hydrogen into power networks and industrial processes. Additionally, specialized programs finance pilot projects and demonstration plants, providing important information to expand production while overcoming technical hurdles specific to Australia's geography and climate. Workforce development programs target training local communities in hydrogen technology, maintenance, and safety procedures. This focus on building capacity makes the supply chain more resilient while maximizng economic dividends, particularly in regional and Indigenous communities. Through these all-encompassing initiatives, Australian governments are building a strong foundation for a competitive and sustainable green hydrogen sector.
Challenges of Australia Green Hydrogen Market:
Infrastructure and Geographic Constraints
One of the major hurdles for Australia's green hydrogen industry is the establishment of sufficient infrastructure throughout its large and frequently remote geography. Although Australia has vast renewable energy resources in areas like the Pilbara, the Nullarbor Plain, and Spencer Gulf in South Australia, these areas tend to be distant from large industrial centers and export terminals. This geographic dispersal creates supply chain challenges in shipping hydrogen economically and efficiently. Construction of pipelines, storage units, and port facilities for the large-scale handling of hydrogen or its derivatives, for example, ammonia, involves large capital outlays and planned coordination. In Australia, the current energy infrastructure is fossil fuel-directed, and a complete retrofit or a whole new system is required for hydrogen. These remote areas also present issues of water supply, which is a vital input for electrolysis, especially in dry regions where water is a problem. It is hence crucial to overcome these geographic and infrastructure challenges to realize Australia's green hydrogen potential.
High Production Costs and Technology Maturity
Another significant hurdle to the success of Australia's green hydrogen industry is the existing high production cost compared to traditional fuels and other energy carriers. While Australia has the luxury of being endowed with vast renewable resources, the technology used to produce green hydrogen—namely, electrolysis—is not yet mature and still needs innovation to become cost-competitive. Electrolyzer, renewable generation, and hydrogen storage capital expenditure are still high. In addition, the intermittent nature of solar and wind, as renewable energy sources, may restrict ongoing hydrogen production, curtailing efficiency in operations. Although Australia boasts some of the world's best research centers, blowing up pilot projects to commercial scale in economically viable prices is challenging. The problem is aggravated by low domestic demand for hydrogen currently, which confines economies of scale. Closing the cost gap and developing technology maturity by means of research, development, and demonstration projects will be imperative to the sustainable growth of the market.
Regulatory and Market Uncertainty
Australia's green hydrogen industry also encounters regulatory framework and market risk concerns. Even with high federal and state government interest, policies and standards regarding hydrogen are still in their development stage, and that poses uncertainty for investors and project developers. Coordination among different regulatory agencies such as energy, environment, and safety agencies are essential but sometimes broken across jurisdictions. In addition, certification for green hydrogen and the formation of clear-cut sustainability criteria remain in the process of refinement. Price volatility and competition with other low-carbon options such as blue hydrogen or battery storage are further aspects of market uncertainty. Lack of established global hydrogen trading markets also makes long-term contract negotiation and financing more challenging. Finally, indigenous rights to land and the environment need to be carefully addressed in planning large-scale hydrogen projects, particularly in areas of high sensitivity such as the Kimberley region. More defined policies, stable incentives, and stakeholder involvement will be crucial to addressing these uncertainties and facilitating market expansion in a confident manner.
Australia Green Hydrogen Market Segmentation:
IMARC Group provides an analysis of the key trends in each segment of the market, along with forecasts at the country and regional levels for 2026-2034. Our report has categorized the market based on technology, application, and distribution channel.
Technology Insights:
- Proton Exchange Membrane Electrolyzer
- Alkaline Electrolyzer
- Others
The report has provided a detailed breakup and analysis of the market based on the technology. This includes proton exchange membrane electrolyzer, alkaline electrolyzer, and others.
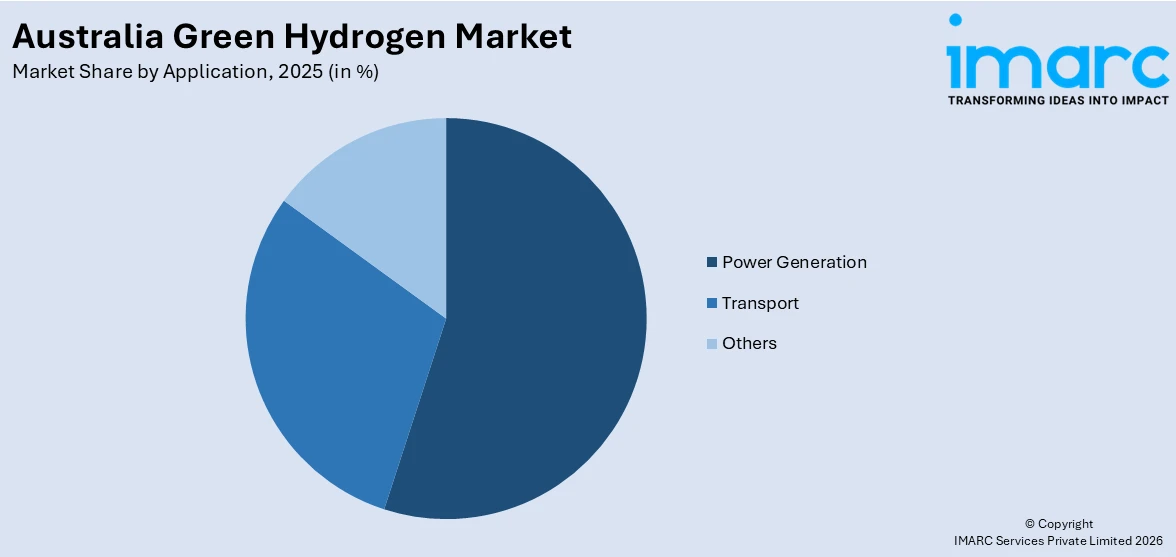
Application Insights:
Access the comprehensive market breakdown Request Sample
- Power Generation
- Transport
- Others
A detailed breakup and analysis of the market based on the application have also been provided in the report. This includes power generation, transport, and others.
Distribution Channel Insights:
- Pipeline
- Cargo
The report has provided a detailed breakup and analysis of the market based on the distribution channel. This includes pipeline and cargo.
Regional Insights:
- Australia Capital Territory & New South Wales
- Victoria & Tasmania
- Queensland
- Northern Territory & South Australia
- Western Australia
The report has also provided a comprehensive analysis of all the major regional markets, which include Australia Capital Territory & New South Wales, Victoria & Tasmania, Queensland, Northern Territory & Southern Australia, and Western Australia.
Competitive Landscape:
The market research report has also provided a comprehensive analysis of the competitive landscape. Competitive analysis such as market structure, key player positioning, top winning strategies, competitive dashboard, and company evaluation quadrant has been covered in the report. Also, detailed profiles of all major companies have been provided, including:
- ABEL Energy Pty Ltd
- Allied Green Ammonia
- Edify Energy Pty Ltd
- Hysata
- LINE Hydrogen
- Nel Hydrogen
- Star Scientific Limited
- Yarra Valley Water
Australia Green Hydrogen Market News:
- On January 28, 2025, Japanese energy company ENEOS announced an AUD 200 million investment in a green hydrogen demonstration plant in Queensland, Australia. The project, supported by the Queensland and Australian Governments, will produce hydrogen using renewable energy and aims to export it to Japan in methylcyclohexane (MCH) form. This investment strengthens Australia–Japan clean energy collaboration and reinforces Queensland’s position as a major player in the global hydrogen economy.
- On March 20, 2025, ARENA announced $814 Million in conditional funding for Copenhagen Infrastructure Partners’ 1,500 MW Murchison Green Hydrogen Project in Western Australia under the Hydrogen Headstart Program. The project, powered by 1.2 GW of solar and 1.7 GW of wind energy, aims to produce renewable hydrogen and ammonia entirely off-grid, with a production capacity of up to 3,600 tonnes per day of ammonia.
- On January 10, 2024, Australia selected six major electrolysis projects for a A$2bn (US$1.34bn) initiative aimed at reducing carbon emissions in heavy industry and establishing itself as a frontrunner in green hydrogen production and export. The chosen projects comprise the 1,625 MW Murchison initiative, which aims to generate hydrogen for ammonia in Western Australia, and the 750 MW Kepco Australia plant, also intended for ammonia production at the Port of Newcastle in New South Wales
- On April 22, 2025, Adani Ports purchased Australia’s NQXT terminal, enhancing its cargo capacity by 35 million tons and elevating EBITDA, as it aims to hit 1 Billion Tons each year by 2030. The AUD 3.975 Billion agreement is a non-cash equity exchange that expands Adani’s international logistics presence, with opportunities for green hydrogen exports.
Australia Green Hydrogen Market Report Coverage:
| Report Features | Details |
|---|---|
| Base Year of the Analysis | 2025 |
| Historical Period | 2020-2025 |
| Forecast Period | 2026-2034 |
| Units | Million USD |
| Scope of the Report |
Exploration of Historical Trends and Market Outlook, Industry Catalysts and Challenges, Segment-Wise Historical and Future Market Assessment:
|
| Technologies Covered | Proton Exchange Membrane Electrolyzer, Alkaline Electrolyzer, Others |
| Applications Covered | Power Generation, Transport, Others |
| Distribution Channels Covered | Pipeline, Cargo |
| Regions Covered | Australia Capital Territory & New South Wales, Victoria & Tasmania, Queensland, Northern Territory & Southern Australia, and Western Australia |
| Companies Covered | ABEL Energy Pty Ltd, Allied Green Ammonia, Edify Energy Pty Ltd, Hysata, LINE Hydrogen, Nel Hydrogen, Star Scientific Limited, Yarra Valley Water, etc. |
| Customization Scope | 10% Free Customization |
| Post-Sale Analyst Support | 10-12 Weeks |
| Delivery Format | PDF and Excel through Email (We can also provide the editable version of the report in PPT/Word format on special request) |
Key Benefits for Stakeholders:
- IMARC’s industry report offers a comprehensive quantitative analysis of various market segments, historical and current market trends, market forecasts, and dynamics of the Australia green hydrogen market from 2020-2034.
- The research report provides the latest information on the market drivers, challenges, and opportunities in the Australia green hydrogen market.
- Porter's five forces analysis assist stakeholders in assessing the impact of new entrants, competitive rivalry, supplier power, buyer power, and the threat of substitution. It helps stakeholders to analyze the level of competition within the Australia green hydrogen industry and its attractiveness.
- Competitive landscape allows stakeholders to understand their competitive environment and provides an insight into the current positions of key players in the market.
Frequently Asked Questions About the Australia Green Hydrogen Market Report
The Australia green hydrogen market was valued at USD 70.1 Million in 2025.
The Australia green hydrogen market is projected to exhibit a CAGR of 47.89% during 2026-2034
The Australia green hydrogen market is expected to reach a value of USD 2,594.0 Million by 2034.
The Australia green hydrogen market trends include the emergence of integrated renewable energy hubs in areas such as Pilbara and Spencer Gulf, greater alignment with Asia-Pacific export markets, and pilot integration into heavy industry and transportation sectors. Furthermore, emphasis is increasing on water-efficient electrolysis, modularized electrolyzer solutions, and scalable demonstration facilities across states.
The major growth drivers of the Australia green hydrogen market are vast renewable resources, supportive government policies, and increasing international demand for clean energy. Strategic export opportunities to Asia-Pacific nations, industrial decarbonization targets, and increasing investments in hydrogen infrastructure and technology further propel the nation's drive toward becoming a world green hydrogen leader.
Need more help?
- Speak to our experienced analysts for insights on the current market scenarios.
- Include additional segments and countries to customize the report as per your requirement.
- Gain an unparalleled competitive advantage in your domain by understanding how to utilize the report and positively impacting your operations and revenue.
- For further assistance, please connect with our analysts.
 Request Customization
 Speak to an Analyst
 Request Brochure
 Inquire Before Buying
Benefits of Customization
- Personalize this research
- Triangulate with your data
- Get data as per your format and definition
- Gain a deeper dive into a specific application, geography, customer, or competitor
- Any level of personalization
Get in Touch With Us
UNITED STATES
Phone: +1-201-971-6302
INDIA
Phone: +91-120-433-0800
UNITED KINGDOM
Phone: +44-753-714-6104
Email: [email protected]
Client Testimonials


.webp)


