
Australia Mobile Money Market Size, Share, Trends and Forecast by Technology, Business Model, Transaction Type, and Region, 2026-2034
Australia Mobile Money Market Overview:
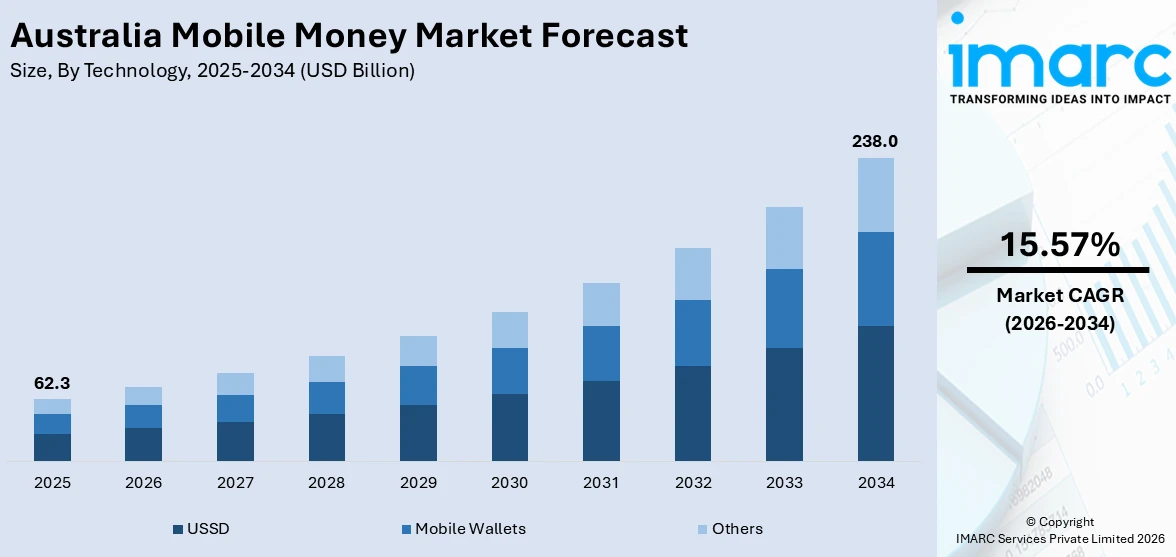
The Australia mobile money market size reached USD 62.3 Billion in 2025. Looking forward, the market is expected to reach USD 238.0 Billion by 2034, exhibiting a growth rate (CAGR) of 15.57% during 2026-2034. The widespread smartphone adoption, the shift towards contactless and digital payments accelerated by the COVID-19 pandemic, robust fintech innovations, and supportive regulatory frameworks fostering a competitive and secure digital payment ecosystem are strengthening the market expansion.
|
Report Attribute
|
Key Statistics
|
|---|---|
|
Base Year
|
2025 |
|
Forecast Years
|
2026-2034
|
|
Historical Years
|
2020-2025
|
| Market Size in 2025 | USD 62.3 Billion |
| Market Forecast in 2034 | USD 238.0 Billion |
| Market Growth Rate 2026-2034 | 15.57% |
Key Trends of Australia Mobile Money Market:
Rising Adoption of Mobile Wallets and Contactless Mobile Payments
In recent years, Australians have increasingly transitioned from physical cards and cash to mobile wallets like Apple Pay, Google Pay, and Samsung Pay, which are embedded in smartphones and wearables. This shift is fueled by near-universal smartphone ownership, with around 90% of adults in 2023 owning a smartphone, and the widespread installation of NFC-enabled terminals at retail points. By mid-2023, mobile wallets accounted for 35% of all in-person card transactions, a significant jump from just 11% in 2020. The trend is particularly popular among younger Australians, with nearly 65% of those aged 18–29 using a mobile wallet regularly in 2022, up from under 20% in 2019. As a result, the volume of electronic payments has surged, with Australians making an average of 730 payments per person in 2022/23, more than double the 330 payments per person recorded a decade ago. This widespread adoption has made mobile wallets a staple in daily life, from café purchases to public transport fares.
To get more information on this market Request Sample
Strengthened Regulatory Framework and Open Banking Infrastructure
Australia is rapidly evolving its regulatory framework to support mobile money services and foster innovation. In November 2023, new legislation brought digital wallets like Apple Pay and Google Pay under the same regulatory scope as credit cards and EFTPOS, empowering the Reserve Bank of Australia (RBA) and the Australian Prudential Regulation Authority (APRA) with greater oversight. By September 2024, regulators unveiled a three-year roadmap to pilot central bank digital currencies (CBDCs) and enhance wholesale market efficiency, highlighting the country’s strong focus on digital financial transformation. Simultaneously, the New Payments Platform (NPP), used by over 110 financial institutions as of mid-2023, enabled 25% of all real-time account-to-account transactions, underscoring the system’s growing importance. Together, these regulatory shifts, infrastructure upgrades, and advancements in real-time payments and data-sharing are creating fertile ground for mobile money innovation and fintech expansion across Australia.
Growth Factors of Australia Mobile Money Market:
Increased Smartphone and Internet Penetration
Australia boasts high smartphone adoption and reliable internet connectivity across both urban and regional areas. This widespread digital access is enabling more Australians to engage with mobile money platforms and digital financial services in their daily lives. As younger generations are born into tech-savvy environments and older demographics become more comfortable using apps and digital tools, the market for mobile-based financial services continues to expand. Financial institutions, fintech startups, and telcos are capitalizing on this digital readiness by offering easy-to-use mobile apps with secure authentication features. This strong digital infrastructure provides the essential groundwork for inclusive growth, allowing mobile money services to reach a broad consumer base across various income groups, occupations, and geographic locations within Australia.
Shift Toward Cashless Transactions
Australian consumer preferences have seen a notable shift toward cashless payments, accelerated by public health concerns during the COVID-19 pandemic and a broader embrace of digital convenience. This behavioral shift is supported by merchants, transit systems, and service providers that increasingly favor contactless and mobile-based payment methods. The availability of NFC-enabled smartphones and mobile wallets has further normalized the use of mobile money for everyday purchases, thereby driving the Australia mobile money market growth. Additionally, consumers now expect fast, seamless, and secure payment options, especially in retail, dining, and transport. This evolution in payment behavior aligns with Australia's national push toward a digital economy and is reinforcing the growth of mobile money platforms. As physical cash use declines, mobile money becomes a natural and scalable alternative for consumers and businesses alike.
Integration with E-commerce and Gig Economy
The rapid rise of e-commerce and the gig economy in Australia has created a growing demand for flexible and efficient payment systems. Mobile money platforms are increasingly preferred for processing transactions among online retailers, freelancers, and gig workers, offering near-instant fund transfers and better financial control. These systems are especially valuable for part-time workers, delivery personnel, and digital freelancers who require real-time access to earnings and low-friction payment tools. Additionally, mobile wallets and payment apps often integrate directly with marketplaces and gig platforms, streamlining both payouts and purchases. As more Australians participate in on-demand services or build businesses online, the importance of mobile money solutions grows. This ecosystem encourages continuous use, thereby reinforcing mobile money's role in Australia's digital financial landscape.
Opportunities of Australia Mobile Money Market:
Expansion into Underserved Financial Segments
Australia’s mobile money platforms hold strong potential to serve financially underserved populations, particularly in rural, remote, and migrant communities. Traditional banking infrastructure often falls short in these areas due to limited physical branches, language barriers, or documentation requirements. Mobile money can bridge this gap by offering user-friendly, app-based solutions accessible from smartphones without the need for extensive paperwork. Tailored features like multilingual interfaces, low-balance requirements, and simplified onboarding processes further enhance financial accessibility. For migrant workers or individuals in geographically isolated regions, mobile money provides a secure and efficient way to store, send, and receive funds. By extending financial services to these neglected segments, providers not only promote financial inclusion but also unlock new customer bases for long-term market growth.
Cross-Border Remittance Solutions
Given Australia’s large immigrant population and strong global ties, there is a significant opportunity for mobile money platforms to capture a share of the cross-border remittance market. Many migrants send funds regularly to family members abroad, often facing high fees and slow transfer times through traditional remittance channels. Mobile money solutions can offer faster, more affordable, and secure alternatives by leveraging digital platforms and blockchain-based infrastructure, which is a major factor driving the Australia mobile money market demand. By partnering with international fintechs or remittance service providers, Australian mobile money firms can enhance cross-border compatibility, currency exchange options, and regulatory compliance. Offering real-time transfer tracking, mobile alerts, and multilingual support can further appeal to migrant communities. Tapping into this space allows mobile money providers to expand revenue streams while fulfilling a critical need for international users.
Strategic Partnerships with Telecoms and Retailers
Mobile money platforms can unlock significant value by forming strategic alliances with telecom operators and large retail networks, which is fueling the Australia mobile money market share. Telecom companies offer access to wide user bases and established billing systems, enabling seamless integration of mobile financial services. Similarly, partnerships with supermarket chains, convenience stores, and rural retail outlets can extend physical touchpoints for cash-in and cash-out services, especially in areas where bank branches are scarce. These collaborations also support co-branded offerings, loyalty programs, and promotional campaigns that boost customer acquisition and engagement. In regional and underserved areas, where digital penetration may be lower, combining mobile money with retail infrastructure helps build trust and accessibility. By leveraging existing networks, mobile money providers can scale faster, improve service availability, and enhance user convenience across Australia.
Challenges of Australia Mobile Money Market:
Consumer Trust and Data Privacy Concerns
One of the major obstacles to the growth of mobile money in Australia is consumer concern regarding data privacy and digital security. Many Australians remain skeptical about how their financial data is collected, stored, and used, particularly with the rise of data breaches and cybercrime incidents across sectors. Even with stringent regulations like the Privacy Act and Consumer Data Right (CDR), public trust can be fragile if platforms fail to ensure transparency and accountability. Concerns about identity theft, unauthorized transactions, and third-party data sharing slow the willingness of users to adopt new mobile payment solutions. For providers, building and maintaining trust through robust security protocols, clear privacy policies, and real-time fraud detection tools is essential for driving long-term customer engagement and market penetration.
Intense Market Competition and Fragmentation
Australia’s mobile money landscape is increasingly saturated with a wide array of fintech startups, digital banks, and established financial institutions offering competing solutions. According to the Australia mobile money market analysis, this crowded environment can overwhelm consumers with too many choices, making it difficult to build strong brand loyalty or achieve high user retention. Smaller or newer players often struggle to gain visibility and differentiate themselves in a market dominated by major banks and well-funded tech companies. Additionally, overlapping features and limited product innovation can result in fragmented adoption, where users engage with multiple platforms for different needs without full commitment to any one provider. This fragmentation hinders scalability and reduces profitability for individual companies. To succeed, players must offer unique value propositions, seamless user experiences, and targeted customer acquisition strategies.
Interoperability and Integration Limitations
A significant technical hurdle in the mobile money ecosystem is the lack of full interoperability between platforms and integration with legacy financial systems. Many mobile money solutions face compatibility issues when connecting with traditional banks, older core systems, or competing digital wallets, leading to inefficient transactions and a poor user experience. Customers often encounter delays, errors, or limited functionality when attempting to move money across platforms or use services outside a closed network. These integration barriers not only frustrate users but also limit broader adoption across sectors. Additionally, businesses and retailers may hesitate to invest in mobile payment infrastructure that lacks universal compatibility. To address this, providers need to invest in open APIs, real-time processing capabilities, and collaborative infrastructure that supports smooth cross-platform functionality.
Australia Mobile Money Market Segmentation:
IMARC Group provides an analysis of the key trends in each segment of the market, along with forecasts at the region/country level for 2026-2034. Our report has categorized the market based on technology, business model, and transaction type.
Technology Insights:
- USSD
- Mobile Wallets
- Others
The report has provided a detailed breakup and analysis of the market based on the technology. This includes USSD, mobile wallets, and others.
Business Model Insights:
Access the comprehensive market breakdown Request Sample
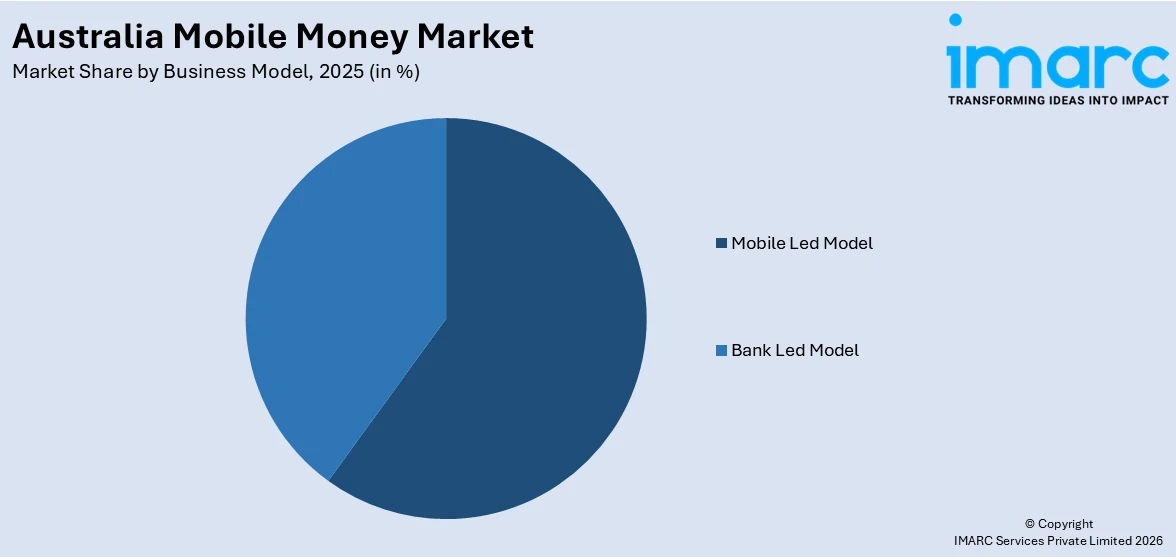
- Mobile Led Model
- Bank Led Model
A detailed breakup and analysis of the market based on the business model have also been provided in the report. This includes mobile led model and bank led model.
Transaction Type Insights:
- Peer to Peer
- Bill Payments
- Airtime Top-ups
- Others
The report has provided a detailed breakup and analysis of the market based on the transaction type. This includes peer to peer, bill payments, airtime top-ups, and others.
Regional Insights:
- Australia Capital Territory & New South Wales
- Victoria & Tasmania
- Queensland
- Northern Territory & Southern Australia
- Western Australia
The report has also provided a comprehensive analysis of all the major regional markets, which include Australia Capital Territory & New South Wales, Victoria & Tasmania, Queensland, Northern Territory & Southern Australia, and Western Australia.
Competitive Landscape:
The market research report has also provided a comprehensive analysis of the competitive landscape. Competitive analysis such as market structure, key player positioning, top winning strategies, competitive dashboard, and company evaluation quadrant has been covered in the report. Also, detailed profiles of all major companies have been provided.
Australia Mobile Money Market News:
- November 2024: Tyro launched its BYO app for Android, enabling Australian businesses to accept contactless payments via Tap to Pay. Compatible with Android 9.0+, the app uses NFC technology, supporting PIN entry and accessibility. It follows Tyro’s iOS launch.
- April 2024: Mastercard launched a mobile virtual card app in Australia to simplify business and travel expenses, with HSBC Australia and Westpac as the first participating banks. The app enables secure, contactless payments via digital wallets, offering enhanced spend controls, real-time data, and seamless integration.
Australia Mobile Money Market Report Coverage:
| Report Features | Details |
|---|---|
| Base Year of the Analysis | 2025 |
| Historical Period | 2020-2025 |
| Forecast Period | 2026-2034 |
| Units | Billion USD |
| Scope of the Report |
Exploration of Historical Trends and Market Outlook, Industry Catalysts and Challenges, Segment-Wise Historical and Future Market Assessment:
|
| Technologies Covered | USSD, Mobile Wallets, Others |
| Business Models Covered | Mobile Led Model, Bank Led Model |
| Transaction Types Covered | Peer to Peer, Bill Payments, Airtime Top-ups, Others |
| Regions Covered | Australia Capital Territory & New South Wales, Victoria & Tasmania, Queensland, Northern Territory & Southern Australia, Western Australia |
| Customization Scope | 10% Free Customization |
| Post-Sale Analyst Support | 10-12 Weeks |
| Delivery Format | PDF and Excel through Email (We can also provide the editable version of the report in PPT/Word format on special request) |
Key Benefits for Stakeholders:
- IMARC’s industry report offers a comprehensive quantitative analysis of various market segments, historical and current market trends, market forecasts, and dynamics of the Australia mobile money market from 2020-2034.
- The research report provides the latest information on the market drivers, challenges, and opportunities in the Australia mobile money market.
- Porter's five forces analysis assist stakeholders in assessing the impact of new entrants, competitive rivalry, supplier power, buyer power, and the threat of substitution. It helps stakeholders to analyze the level of competition within the Australia mobile money industry and its attractiveness.
- Competitive landscape allows stakeholders to understand their competitive environment and provides an insight into the current positions of key players in the market.
Frequently Asked Questions About the Australia Mobile Money Market Report
The mobile money market in Australia was valued at USD 62.3 Billion in 2025.
The Australia mobile money market is projected to exhibit a CAGR of 15.57% during 2026-2034.
The Australia mobile money market is projected to reach a value of USD 238.0 Billion by 2034.
Australia’s mobile money market is driven by the widespread shift toward cashless transactions, fueled by rapid digital wallet adoption. The integration of platforms, such as BPAY, eftpos, and NPP, is streamlining the user experience, which is further encouraging contactless and secure mobile payments.
Australia’s mobile money market growth is driven by rising smartphone penetration, expanding e-commerce, and strong demand for real-time payments via platforms like PayID and Osko. The surge in digital wallet usage, along with regulatory support for cashless transactions, further accelerates market expansion and consumer adoption.
Need more help?
- Speak to our experienced analysts for insights on the current market scenarios.
- Include additional segments and countries to customize the report as per your requirement.
- Gain an unparalleled competitive advantage in your domain by understanding how to utilize the report and positively impacting your operations and revenue.
- For further assistance, please connect with our analysts.
 Request Customization
 Speak to an Analyst
 Request Brochure
 Inquire Before Buying
Benefits of Customization
- Personalize this research
- Triangulate with your data
- Get data as per your format and definition
- Gain a deeper dive into a specific application, geography, customer, or competitor
- Any level of personalization
Get in Touch With Us
UNITED STATES
Phone: +1-201-971-6302
INDIA
Phone: +91-120-433-0800
UNITED KINGDOM
Phone: +44-753-714-6104
Email: [email protected]
Client Testimonials


.webp)


