
Australia Online Gambling Market Size, Share, Trends and Forecast by Game Type, Device, and Region, 2026-2034
Australia online gambling market Size and Share:
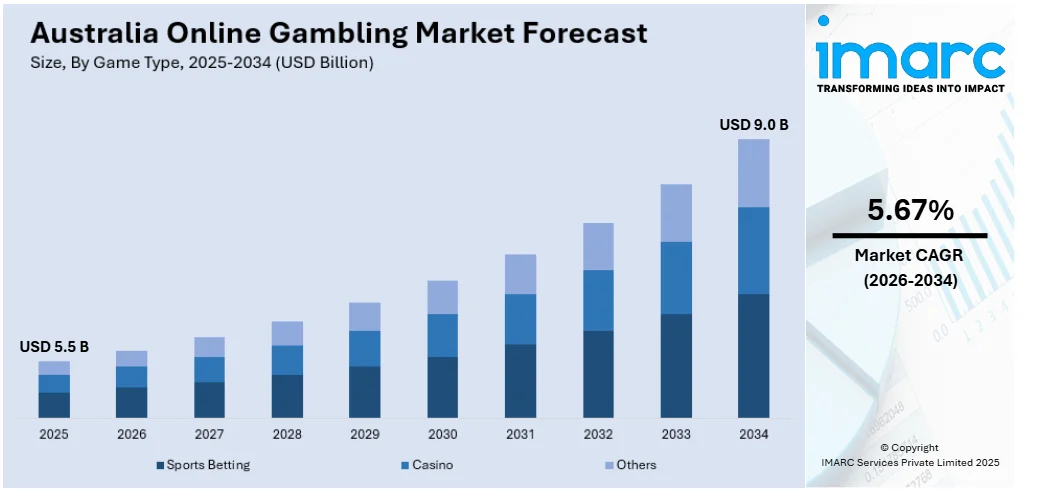
The Australia online gambling market size was valued at USD 5.5 Billion in 2025. Looking forward, IMARC Group estimates the market to reach USD 9.0 Billion by 2034, exhibiting a CAGR of 5.67% from 2026-2034. Favorable regulatory environment in the country, rapid technological advancements, changing consumer preferences, ongoing promotion and advertising activities, and expansion of variety of offerings are some of the factors bolstering the market Australia online gambling market share.
|
Report Attribute
|
Key Statistics
|
|---|---|
|
Base Year
|
2025 |
|
Forecast Years
|
2026-2034 |
|
Historical Years
|
2020-2025
|
|
Market Size in 2025
|
USD 5.5 Billion |
|
Market Forecast in 2034
|
USD 9.0 Billion |
|
Market Growth Rate (2026-2034)
|
5.67% |
Country's regulatory environment has historically been conducive to the Australia online gambling market growth. The Interactive Gambling Act 2001 permitted licensed operators to offer online betting services, creating a framework that facilitated industry expansion. Additionally, in August 2024, the government implemented a ban on the use of credit cards for online gambling, aiming to mitigate financial risks associated with gambling debts. These measures reflect a growing regulatory focus on consumer protection and responsible gambling practices. While the initial regulatory framework supported market growth, the recent tightening of regulations indicates a balancing act between industry expansion and safeguarding public health.
To get more information on this market Request Sample
Technological advancements have significantly propelled the growth of Australia online gambling market share. The extensive use of smartphones and high-speed internet has significantly increased Australians' access to online gambling. A 2022 report by the Australian Communications and Media Authority (ACMA) noted that for the first time, more than one in ten Australians (11%) participated in online gambling within a six-month period, up from 8% in 2020. This increase is attributed to the convenience offered by mobile applications and improved internet infrastructure. The integration of secure payment platforms has also enhanced user confidence in online transactions, contributing to the market Australia online gambling market demand. Additionally, the development of interactive and immersive gaming experiences, facilitated by advancements in software and graphics technology, has attracted a broader audience.
Australia Online Gambling Market Trends:
Changing Consumer Preferences
The increasing demand for digital entertainment and the convenience of online platforms are significantly propelling the growth of Australia's online gambling market. Recent statistics highlight this pattern: in 2022, around 73% of Australian adults participated in gambling, with 33% involved in online gambling activities. This shift towards digital platforms is particularly evident among younger demographics, who are more inclined to use online channels for gambling. The Australian Gambling Research Centre's 2022 survey highlighted that 33.4% of respondents had placed bets online in the past 12 months, with online participation being highest for sports and racing betting. This surge in online engagement is attributed to the desire for accessible and convenient entertainment options, allowing individuals to gamble from the comfort of their homes or on-the-go via mobile devices.
Ongoing Promotion and Advertising Activities
Aggressive marketing strategies by gambling operators have significantly contributed to the growth of Australia's online gambling market. From May 2022 to April 2023, over 1 million gambling ads were broadcast on free-to-air TV and radio, with online gambling providers contributing to 64% of this exposure. This extensive advertising presence has been instrumental in attracting younger demographics to online gambling platforms. However, this increased advertising has served as a cause of concern to the public, as recently prompting a parliamentary committee to suggest that there be a complete ban on all forms of advertisements of online gambling over a phased three-year period. The Australian Government is currently debating these recommendations, reflecting the debate between industry growth and public health considerations.
Expansion of Variety of Offerings
The expansion of the Australian online gambling market is significantly propelled by the diversification of offerings, encompassing a wide array of casino-style games such as blackjack, roulette, poker, and slots. This variety caters to a broad spectrum of player preferences, thereby attracting a larger user base. However, this growth has raised regulatory concerns. Between October and December 2024, the Australian Communications and Media Authority (ACMA) investigated 301 complaints, resulting in the identification of 16 breaches of the Interactive Gambling Act 2001. Consequently, 75 websites, primarily offering casino-style games, were referred for blocking due to their illegal operations. Additionally, the BetStop National Self-Exclusion Register, launched in August 2023, reported that by the end of the second quarter of the 2024–2025 fiscal year, 35,671 individuals had registered to self-exclude from all licensed online and phone wagering providers in Australia, with 26,020 active exclusions as of December 31, 2024.
Australia Online Gambling Industry Segmentation:
IMARC Group provides an analysis of the key trends in each segment of the Australia online gambling market, along with forecasts at the country and regional levels from 2026-2034. The market has been categorized based on game type and device.
Analysis by Game Type:
- Sports Betting
- Football
- Horse Racing
- E-Sports
- Others
- Casino
- Live Casino
- Baccarat
- Blackjack
- Poker
- Slots
- Others
- Others
As per the Australia online gambling market outlook, sports betting continues to hold the largest share due to its broad appeal and deep integration into the nation’s sporting culture. Popular events such as the AFL, NRL, cricket, and horse racing serve as significant drivers, with bettors engaging in pre-match and live betting options. The inclusion of sophisticated betting platforms offering real-time updates, predictive analytics, and tailored promotions has elevated the user experience, further solidifying sports betting as the preferred game type. Additionally, the social aspect of sports wagering, often combined with live streaming features, keeps users engaged and encourages frequent participation. The trust and familiarity associated with established operators also contribute to its dominance, creating a strong sense of reliability among users.
Analysis by Device:
Access the comprehensive market breakdown Request Sample
- Desktop
- Mobile
- Others
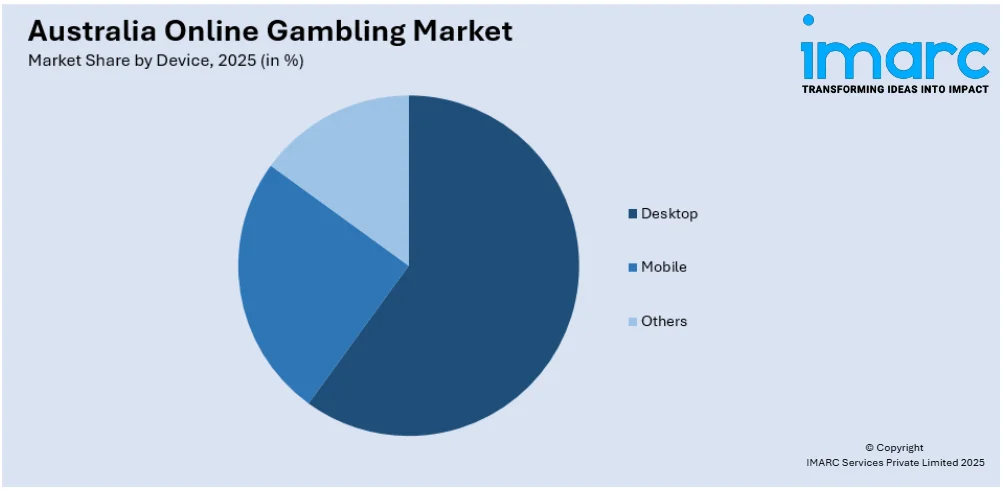
Based on the latest Australia online gambling market forecast, desktops are still leading the Australian online gambling market. Desktops are preferred because of the immersive nature whereby bigger screens provide clearer visualization of graphics of games played and even the dashboards for the betting options. Desktop platforms generally tend to provide better features like multi-screen support, high-resolution graphics, and faster processing speeds, making it ideal for heavy gaming and betting. The usage of a desktop aligns well with users' overall tendency to gamble from the comfort of their home, where stability and security are required. Operators try to optimize interfaces on desktop to have smooth navigation and detailed game presentation, which appeals to experienced gamers.
Regional Analysis:
- Australia Capital Territory and New South Wales
- Victoria and Tasmania
- Queensland
- Northern Territory & Southern Australia
- Western Australia
The Australia Capital Territory (ACT) and New South Wales (NSW) dominate the online gaming space due to their relatively high population density and strong economic profiles. These areas host a population with a technical pungency and disposable incomes, which make it amicable to engage in online gambling activities. In NSW, there exists a long history of gambling tradition with large users engaging in sports betting and casino games. ACT balances this with a well-controlled framework for gambling and solid internet connectivity, which facilitates the availability and reliability of online gambling services. The availability of local operators and marketing tailored to the locals residing in those regions makes them leaders in the market.
Competitive Landscape:
Leading players in the Australian market for online gambling are focusing on innovation, strategic partnerships, user-centric enhancement, and maintenance of competitive edge. Extensive investments are being made in technology to deliver personalized experiences through AI-driven recommendations, advanced analytics, and excellent game performance across devices. Enhanced user interfaces and mobile optimization allow players to access lots of games and betting options while using their cellphones. The companies are increasing their portfolios for games, also bringing innovative formats in live dealer games, interactive features for betting, and esports-related wagering to bring the market nearer to a large group of clients. Strategic associations with payment processors will guarantee transactions are safe, quick, and diversified through a wide variety, such as digital wallets and cryptocurrencies, targeting tech-savvy users. Further still, there has been increased emphasis on compliance with the emerging regulations, as operators introduce effective responsible gambling tools, including self-exclusion programs, deposit limits, and real-time monitoring for potential gambling harm.
The report provides a comprehensive analysis of the competitive landscape in the Australia online gambling market with detailed profiles of all major companies.
Latest News and Developments:
- In November 2023: Picklebet, an Australian esports and sports betting company, secured a $15M AUD Series A funding round led by Discerning Capital, with participation from Drive by DraftKings, Manifest Investment Partners, and Jeff Sagansky. The investment supports growth, technology innovation, media expansion, and Picklebet’s planned international expansion.
- In September 2024: According to Queensland Treasury, online gambling turnover in Australia rose 165.7% year-on-year to $75.4m in 2022-2023, making up 31% of total gambling turnover. Per capita online spending reached $397.5. Gaming machines led with $191.2bn in turnover, up 20.9%. Overall gambling turnover grew 18.2%, with per capita spending increasing 11.5% to $1,555.
- In July 2024: 4D Lotto launched Australia’s first fixed payout lottery game. Targeting 150,000 players in its first quarter, it offers draws every five minutes via a mobile app. Licensed by the Northern Territory government, it features 2D, 3D, 4D Classic, 5D, and the upcoming 4D Jackpot game.
- In July 2024: Caesars Entertainment acquired ZeroFlucs Group, a sports betting software provider, following successful integration into Caesars Sportsbook. The deal enhances pricing capabilities and product offerings, including in-play same-game parlays. ZeroFlucs’ leadership joins Caesars Digital, strengthening data science and trading technology expertise to improve customer experience and expand sports betting innovations.
Australia Online Gambling Market Report Scope:
| Report Features | Details |
|---|---|
| Base Year of the Analysis | 2025 |
| Historical Period | 2020-2025 |
| Forecast Period | 2026-2034 |
| Units | Billion USD |
| Scope of the Report |
Exploration of Historical Trends and Market Outlook, Industry Catalysts and Challenges, Segment-Wise Historical and Future Market Assessment:
|
| Game Types Covered |
|
| Devices Covered | Desktop, Mobile, Others |
| Regions Covered | Australia Capital Territory and New South Wales, Victoria and Tasmania, Queensland, Northern Territory & Southern Australia, Western Australia |
| Customization Scope | 10% Free Customization |
| Post-Sale Analyst Support | 10-12 Weeks |
| Delivery Format | PDF and Excel through Email (We can also provide the editable version of the report in PPT/Word format on special request) |
Key Benefits for Stakeholders:
- IMARC’s report offers a comprehensive quantitative analysis of various market segments, historical and current market trends, market forecasts, and dynamics of the Australia online gambling market from 2020-2034.
- The research study provides the latest information on the market drivers, challenges, and opportunities in the Australia online gambling market.
- Porter's Five Forces analysis assists stakeholders in assessing the impact of new entrants, competitive rivalry, supplier power, buyer power, and the threat of substitution. It helps stakeholders to analyze the level of competition within the Australia online gambling industry and its attractiveness.
- Competitive landscape allows stakeholders to understand their competitive environment and provides an insight into the current positions of key players in the market.
Frequently Asked Questions About the Australia Online Gambling Market Report
The Australia online gambling market was valued at USD 5.5 Billion in 2025.
Favorable regulatory environment in the country, rapid technological advancements, changing consumer preferences, ongoing promotion and advertising activities, and expansion of variety of offerings are some of the factors bolstering the market Australia online gambling market share.
IMARC estimates the Australia online gambling market to exhibit a CAGR of 5.67% during 2026-2034, reaching USD 9.0 Billion in 2034.
Desktop holds the largest share for the device segment of the Australia online gambling market.
Need more help?
- Speak to our experienced analysts for insights on the current market scenarios.
- Include additional segments and countries to customize the report as per your requirement.
- Gain an unparalleled competitive advantage in your domain by understanding how to utilize the report and positively impacting your operations and revenue.
- For further assistance, please connect with our analysts.
 Request Customization
 Speak to an Analyst
 Request Brochure
 Inquire Before Buying
Benefits of Customization
- Personalize this research
- Triangulate with your data
- Get data as per your format and definition
- Gain a deeper dive into a specific application, geography, customer, or competitor
- Any level of personalization
Get in Touch With Us
UNITED STATES
Phone: +1-201-971-6302
INDIA
Phone: +91-120-433-0800
UNITED KINGDOM
Phone: +44-753-714-6104
Email: [email protected]
Client Testimonials


.webp)


