
Australia Paper Cups Market Size, Share, Trends and Forecast by Cup Type, Wall Type, Application, Distribution Channel, End User, and Region, 2026-2034
Australia Paper Cups Market Overview:
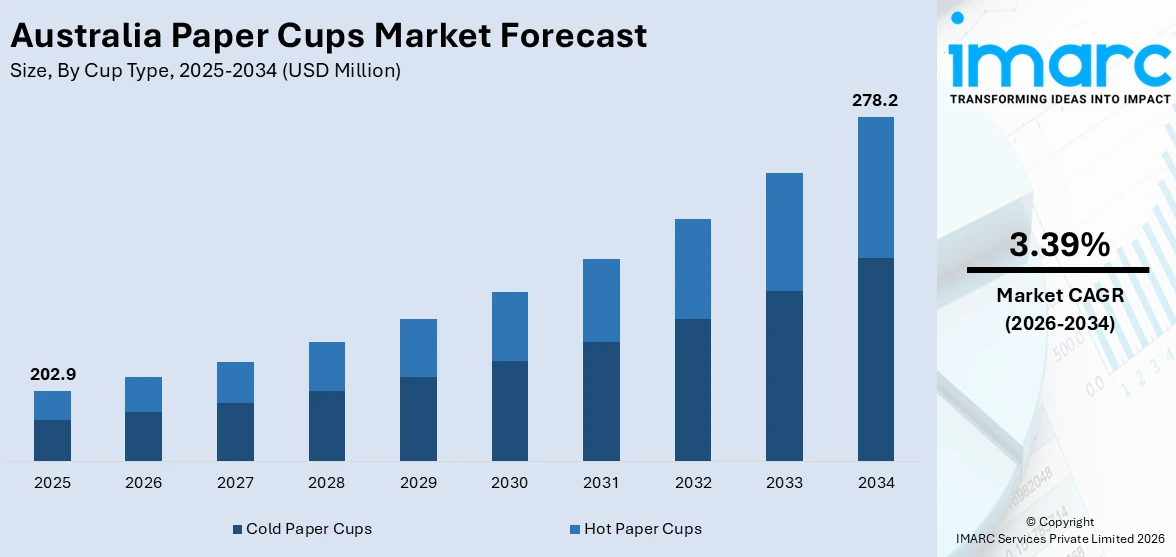
The Australia paper cups market size reached USD 202.9 Million in 2025. Looking forward, IMARC Group expects the market to reach USD 278.2 Million by 2034, exhibiting a growth rate (CAGR) of 3.39% during 2026-2034. The market is witnessing steady growth due to the rising demand for sustainable packaging, government bans on single use plastics and expanding foodservice activities. Moreover, innovation in recyclable materials and improved recycling infrastructure further support long-term growth across the country.
|
Report Attribute
|
Key Statistics
|
|---|---|
|
Base Year
|
2025 |
|
Forecast Years
|
2026-2034
|
|
Historical Years
|
2020-2025
|
| Market Size in 2025 | USD 202.9 Million |
| Market Forecast in 2034 | USD 278.2 Million |
| Market Growth Rate 2026-2034 | 3.39% |
Australia Paper Cups Market Trends:
Growth in Foodservice and Takeaway Culture
The growth of café and quick service restaurant (QSR) segment is one of the key drivers of Australia paper cups market growth. With rising on-the-go lifestyles, Australian consumers are opting for takeaway beverages, particularly coffee and other hot beverages, to a greater extent. This factor is supported by the fast pace of food delivery services, where disposable packaging features prominently due to convenience and cleanliness. The emergence of gourmet coffee shops and premium brands has created an increased demand for high-quality, branded paper cups that are not only utilitarian but also attractive. Many of these businesses are also seeking sustainable packaging options to align with customer values and government guidelines, leading to a growing shift from plastic to paper alternatives. For instance, in April 2025, Piazza D’Oro introduced certified home compostable coffee cups, aiming to reduce landfill waste. Transitioning from PLA-lined to Aqueous BioCups, these cups decompose in under six months. This initiative reinforces Piazza D’Oro’s commitment to sustainability and responsible practices within Australia’s coffee industry. This evolving consumption pattern continues to influence the Australia paper cup market share, particularly in urban and high-footfall areas.
To get more information on this market Request Sample
Expansion of Local Recycling Infrastructure
Australia is witnessing increased investment in recycling and waste management infrastructure, which is significantly shaping the paper cups market. Local governments and private players are collaborating to enhance collection, sorting, and processing capacities for paper-based packaging waste. For instance, in August 2024, Melton City Council launched a trial coffee cup recycling program in partnership with Simply Cups, aiming to divert over 50,000 paper cups from landfill. The initiative will run for two years at six locations, allowing the recycling of various cup types to create sustainable materials for construction and roads. With the introduction of advanced facilities capable of handling polyethylene-lined paper cups, the industry is making strides toward diverting disposable items from landfills. These developments are aligned with Australia’s national circular economy goals, which promote resource recovery and sustainable production. The establishment of closed-loop recycling systems not only supports environmental targets but also reassures businesses and consumers about the end-of-life management of paper cups. This shift is expected to improve recycling rates and reduce reliance on offshore processing. As sustainability regulations tighten and infrastructure scales up, it will play a significant role in shaping the Australia paper cups market outlook.
Australia Paper Cups Market Segmentation:
IMARC Group provides an analysis of the key trends in each segment of the market, along with forecasts at the regional level for 2026-2034. Our report has categorized the market based on cup type, wall type, application, distribution channel, and end user.
Cup Type Insights:
- Cold Paper Cups
- Hot Paper Cups
The report has provided a detailed breakup and analysis of the market based on the cup type. This includes cold paper cups and hot paper cups.
Wall Type Insights:
- Single Wall
- Double Wall
- Triple Wall
A detailed breakup and analysis of the market based on the wall type have also been provided in the report. This includes single wall, double wall, and triple wall.
Application Insights:
Access the comprehensive market breakdown Request Sample
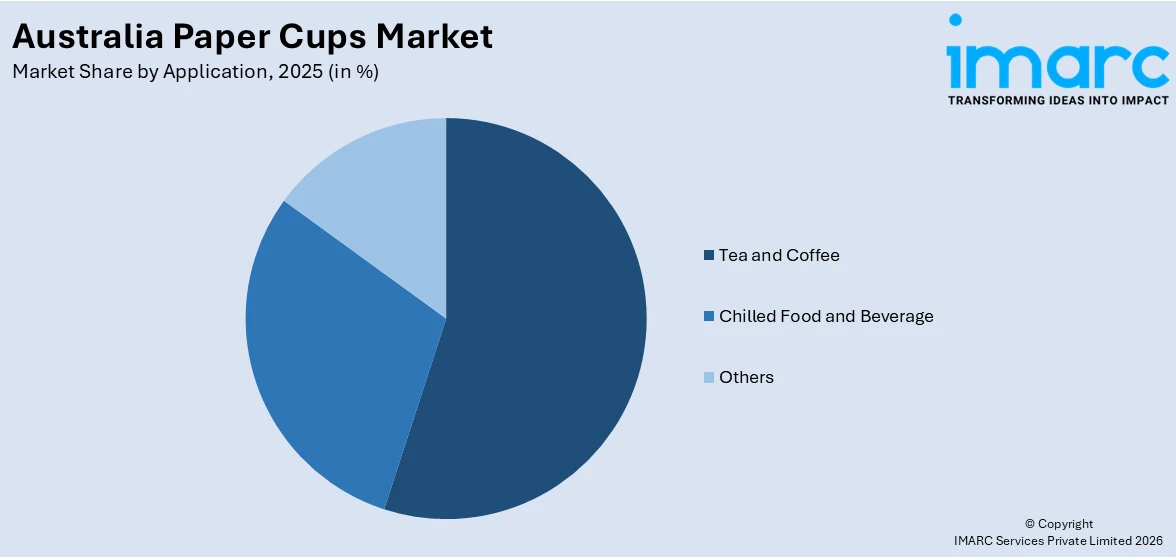
- Tea and Coffee
- Chilled Food and Beverage
- Others
A detailed breakup and analysis of the market based on the application have also been provided in the report. This includes tea and coffee, chilled food and beverage, and others.
Distribution Channel Insights:
- Institutional Sales
- Retail Sales
A detailed breakup and analysis of the market based on the distribution channel have also been provided in the report. This includes institutional sales and retail sales.
End User Insights:
- Coffee and Tea Shops
- QSR and Other Fast Food Shops
- Offices and Educational Institutions
- Residential Use
- Others
A detailed breakup and analysis of the market based on the end user have also been provided in the report. This includes coffee and tea shops, QSR and other fast food shops, offices and educational institutions, residential use, and others.
Regional Insights:
- Australia Capital Territory & New South Wales
- Victoria & Tasmania
- Queensland
- Northern Territory & Southern Australia
- Western Australia
The report has also provided a comprehensive analysis of all the major regional markets, which include Australia Capital Territory & New South Wales, Victoria & Tasmania, Queensland, Northern Territory & Southern Australia, and Western Australia.
Competitive Landscape:
The market research report has also provided a comprehensive analysis of the competitive landscape. Competitive analysis such as market structure, key player positioning, top winning strategies, competitive dashboard, and company evaluation quadrant has been covered in the report. Also, detailed profiles of all major companies have been provided.
Australia Paper Cups Market News:
- In June 2024, BioPak introduced Australia's first PHA-lined home-compostable cups, which are made from renewable resources like FSC-certified paper. This innovative biopolymer, created through fermentation, offers a solution for sustainable waste management and is certified marine biodegradable. The cups will be commercially available later this year in various sizes.
- In February 2024, APCO and Simply Cups launched a new 'Drop Off Only' logo for qualifying paper cups, guiding Australians to over 1,500 recycling collection points. This initiative, part of the Australasian Recycling Label program, aims to improve recycling efforts for paper cups, which are challenging to process in regular kerbside collections.
Australia Paper Cups Market Report Coverage:
| Report Features | Details |
|---|---|
| Base Year of the Analysis | 2025 |
| Historical Period | 2020-2025 |
| Forecast Period | 2026-2034 |
| Units | Million USD |
| Scope of the Report |
Exploration of Historical Trends and Market Outlook, Industry Catalysts and Challenges, Segment-Wise Historical and Future Market Assessment:
|
| Cup Types Covered | Cold Paper Cups, Hot Paper Cups |
| Wall Types Covered | Single Wall, Double Wall, Triple Wall |
| Applications Covered | Tea and Coffee, Chilled Food and Beverage, Others |
| Distribution Channels Covered | Institutional Sales, Retail Sales. |
| End Users Covered | Coffee and Tea Shops, QSR and Other Fast Food Shops, Offices and Educational Institutions, Residential Use, Others |
| Regions Covered | Australia Capital Territory & New South Wales, Victoria & Tasmania, Queensland, Northern Territory & Southern Australia, Western Australia |
| Customization Scope | 10% Free Customization |
| Post-Sale Analyst Support | 10-12 Weeks |
| Delivery Format | PDF and Excel through Email (We can also provide the editable version of the report in PPT/Word format on special request) |
Key Questions Answered in This Report:
- How has the Australia paper cups market performed so far and how will it perform in the coming years?
- What is the breakup of the Australia paper cups market on the basis of cup type?
- What is the breakup of the Australia paper cups market on the basis of wall type?
- What is the breakup of the Australia paper cups market on the basis of application?
- What is the breakup of the Australia paper cups market on the basis of distribution channel?
- What is the breakup of the Australia paper cups market on the basis of end user?
- What is the breakup of the Australia paper cups market on the basis of region?
- What are the various stages in the value chain of the Australia paper cups market?
- What are the key driving factors and challenges in the Australia paper cups market?
- What is the structure of the Australia paper cups market and who are the key players?
- What is the degree of competition in the Australia paper cups market?
Key Benefits for Stakeholders:
- IMARC’s industry report offers a comprehensive quantitative analysis of various market segments, historical and current market trends, market forecasts, and dynamics of the Australia paper cups market from 2020-2034.
- The research report provides the latest information on the market drivers, challenges, and opportunities in the Australia paper cups market.
- Porter's five forces analysis assist stakeholders in assessing the impact of new entrants, competitive rivalry, supplier power, buyer power, and the threat of substitution. It helps stakeholders to analyze the level of competition within the Australia paper cups industry and its attractiveness.
- Competitive landscape allows stakeholders to understand their competitive environment and provides an insight into the current positions of key players in the market.
Need more help?
- Speak to our experienced analysts for insights on the current market scenarios.
- Include additional segments and countries to customize the report as per your requirement.
- Gain an unparalleled competitive advantage in your domain by understanding how to utilize the report and positively impacting your operations and revenue.
- For further assistance, please connect with our analysts.
 Request Customization
 Speak to an Analyst
 Request Brochure
 Inquire Before Buying
Benefits of Customization
- Personalize this research
- Triangulate with your data
- Get data as per your format and definition
- Gain a deeper dive into a specific application, geography, customer, or competitor
- Any level of personalization
Get in Touch With Us
UNITED STATES
Phone: +1-201-971-6302
INDIA
Phone: +91-120-433-0800
UNITED KINGDOM
Phone: +44-753-714-6104
Email: [email protected]
Client Testimonials


.webp)


