
Australia Smart Ticketing Market Size, Share, Trends and Forecast by Product, Component, System, Application, and Region, 2026-2034
Australia Smart Ticketing Market Overview:
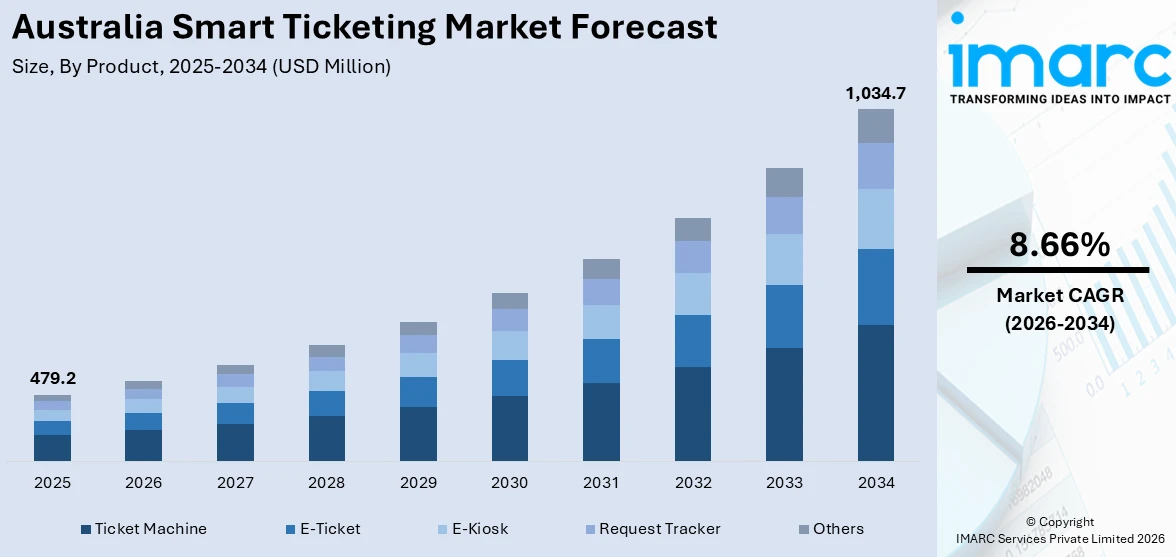
The Australia smart ticketing market size reached USD 479.2 Million in 2025. Looking forward, IMARC Group expects the market to reach USD 1,034.7 Million by 2034, exhibiting a growth rate (CAGR) of 8.66% during 2026-2034. The market is experiencing robust growth, driven by increasing demand for contactless and seamless payment solutions in transportation, events, and entertainment sectors. Additionally, government support for digital infrastructure and the push for improved customer experiences are contributing to market expansion. Moreover, the adoption of mobile and biometric-based ticketing systems is also on the rise, which is strengthening the Australia smart ticketing market share.
|
Report Attribute
|
Key Statistics
|
|---|---|
|
Base Year
|
2025
|
|
Forecast Years
|
2026-2034
|
|
Historical Years
|
2020-2025
|
| Market Size in 2025 | USD 479.2 Million |
| Market Forecast in 2034 | USD 1,034.7 Million |
| Market Growth Rate 2026-2034 | 8.66% |
Australia Smart Ticketing Market Trends:
Rising Adoption of Contactless Payments
Australia’s public transport systems and entertainment venues are rapidly embracing contactless payment technologies to streamline access and enhance user convenience. By enabling commuters and attendees to tap in using credit or debit cards, smartphones, or wearable devices, agencies are phasing out traditional paper-based ticketing and minimizing the need for manual kiosks. For instance, in March 2025, Smart Ticketing became available for all public transport in South East Queensland. Users can now pay using contactless Visa, Mastercard, or American Express cards, as well as digital wallets. This new payment method has facilitated over 28 million trips, allowing for seamless travel across trains, trams, ferries, and buses. Additionally, Go cards are still an option for payment. This shift is not only cutting down transaction times but also supporting hygiene-conscious travel behavior. Major cities are expanding infrastructure to support open-loop payment systems, allowing seamless travel across multiple modes of transport. Additionally, integration with digital wallets and mobile banking platforms has made adoption more widespread among both locals and tourists. The convenience, speed, and security of these systems have positioned contactless technology as a preferred choice for both daily commutes and one-time events. This momentum continues to be a key driver of Australia smart ticketing market growth.
To get more information on this market Request Sample
Growing Shift Toward Mobile-First Ticketing
In Australia, mobile-first ticketing is becoming the default option for a growing segment of commuters and event-goers. Consumers prefer using apps that consolidate ticket booking, storage, and validation into one streamlined interface. For instance, in January 2025, Ticketmaster launched an enhanced ticket experience for the Australian Open. Fans can now access vital event information, venue maps, and an exclusive playlist through Apple Wallet. This marks the first international rollout of the feature, enhancing the overall event day experience. These platforms allow quick access to travel passes, QR codes for venue entry, and real-time updates on schedules or disruptions. Features like auto-renewal of travel cards, push notifications, and one-click refunds or reschedules have significantly improved user convenience. For operators, mobile ticketing reduces the overhead of maintaining physical kiosks and printing infrastructure, while enabling richer data collection on passenger behavior. Mobile-first strategies are also being tailored for multilingual and accessibility features to ensure inclusive adoption. As more people demand instant, flexible solutions that fit into their smartphones, transport providers and ticketing platforms are investing heavily in app development pushing further momentum in Australia smart ticketing market growth.
Australia Smart Ticketing Market Segmentation:
IMARC Group provides an analysis of the key trends in each segment of the market, along with forecasts at the country and regional levels for 2026-2034. Our report has categorized the market based on product, component, system, and application.
Product Insights:
- Ticket Machine
- E-Ticket
- E-Kiosk
- Request Tracker
- Others
The report has provided a detailed breakup and analysis of the market based on the product. This includes ticket machine, e-ticket, e-kiosk, request tracker, and others.
Component Insights:
- Software
- Hardware
A detailed breakup and analysis of the market based on the component have also been provided in the report. This includes software and hardware.
System Insights:
- Open Payment System
- Smart Card
- Near-Field Communication
A detailed breakup and analysis of the market based on the system have also been provided in the report. This includes open payment system, smart card, and near-field communication.
Application Insights:
Access the comprehensive market breakdown Request Sample
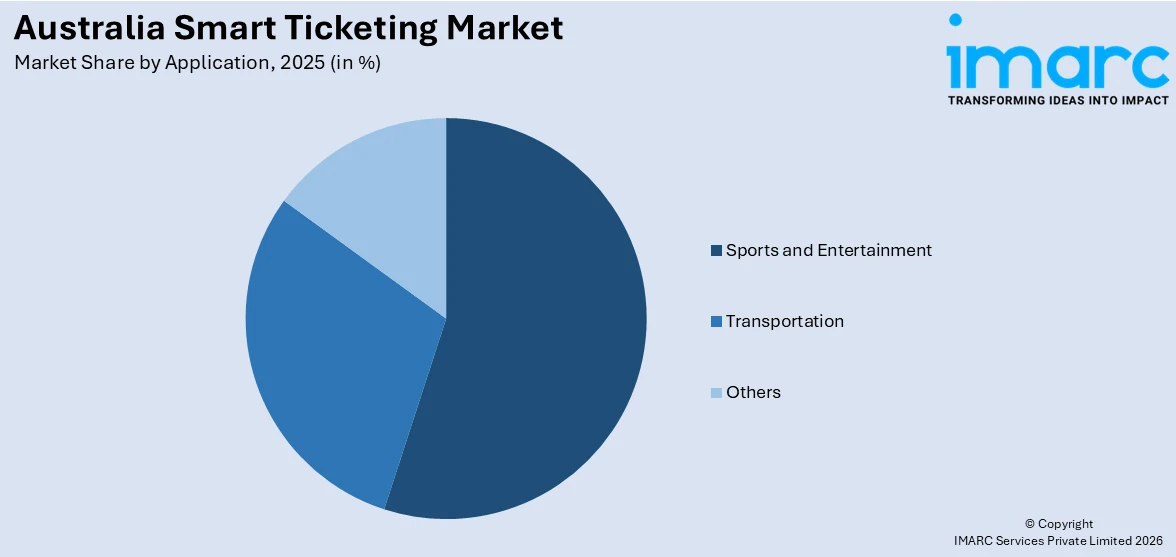
- Sports and Entertainment
- Transportation
- Others
A detailed breakup and analysis of the market based on the application have also been provided in the report. This includes sports and entertainment, transportation, and others.
Regional Insights:
- Australia Capital Territory & New South Wales
- Victoria & Tasmania
- Queensland
- Northern Territory & South Australia
- Western Australia
The report has also provided a comprehensive analysis of all the major regional markets, which include Australia Capital Territory & New South Wales, Victoria & Tasmania, Queensland, Northern Territory & South Australia, and Western Australia.
Competitive Landscape:
The market research report has also provided a comprehensive analysis of the competitive landscape. Competitive analysis such as market structure, key player positioning, top winning strategies, competitive dashboard, and company evaluation quadrant has been covered in the report. Also, detailed profiles of all major companies have been provided.
Australia Smart Ticketing Market News:
- In March 2025, Brisbane City Council announced its plans to launch smart ticketing on buses and metro services, allowing commuters to use credit and debit cards or smart devices instead of go cards.
- In February 2025, Victoria announced its plans to introduce ticketless public transport early next year, allowing train passengers to pay using bank cards, phones, or smartwatches. Public Transport Minister Gabrielle Williams announced the installation of over 20,000 card readers, starting with the train network in early 2026, following successful trials in Wangaratta.
Australia Smart Ticketing Market Report Coverage:
| Report Features | Details |
|---|---|
| Base Year of the Analysis | 2025 |
| Historical Period | 2020-2025 |
| Forecast Period | 2026-2034 |
| Units | Million USD |
| Scope of the Report |
Exploration of Historical Trends and Market Outlook, Industry Catalysts and Challenges, Segment-Wise Historical and Future Market Assessment:
|
| Products Covered | Ticket Machine, E-Ticket, E-Kiosk, Request Tracker, Others |
| Components Covered | Software, Hardware |
| Systems Covered | Open Payment System, Smart Card, Near-Field Communication |
| Applications Covered | Sports and Entertainment, Transportation, Others |
| Regions Covered | Australia Capital Territory & New South Wales, Victoria & Tasmania, Queensland, Northern Territory & South Australia, Western Australia |
| Customization Scope | 10% Free Customization |
| Post-Sale Analyst Support | 10-12 Weeks |
| Delivery Format | PDF and Excel through Email (We can also provide the editable version of the report in PPT/Word format on special request) |
Key Questions Answered in This Report:
- How has the Australia smart ticketing market performed so far and how will it perform in the coming years?
- What is the breakup of the Australia smart ticketing market on the basis of product?
- What is the breakup of the Australia smart ticketing market on the basis of component?
- What is the breakup of the Australia smart ticketing market on the basis of system?
- What is the breakup of the Australia smart ticketing market on the basis of application?
- What is the breakup of the Australia smart ticketing market on the basis of region?
- What are the various stages in the value chain of the Australia smart ticketing market?
- What are the key driving factors and challenges in the Australia smart ticketing market?
- What is the structure of the Australia smart ticketing market and who are the key players?
- What is the degree of competition in the Australia smart ticketing market?
Key Benefits for Stakeholders:
- IMARC’s industry report offers a comprehensive quantitative analysis of various market segments, historical and current market trends, market forecasts, and dynamics of the Australia smart ticketing market from 2020-2034.
- The research report provides the latest information on the market drivers, challenges, and opportunities in the Australia smart ticketing market.
- Porter's five forces analysis assist stakeholders in assessing the impact of new entrants, competitive rivalry, supplier power, buyer power, and the threat of substitution. It helps stakeholders to analyze the level of competition within the Australia smart ticketing industry and its attractiveness.
- Competitive landscape allows stakeholders to understand their competitive environment and provides an insight into the current positions of key players in the market.
Need more help?
- Speak to our experienced analysts for insights on the current market scenarios.
- Include additional segments and countries to customize the report as per your requirement.
- Gain an unparalleled competitive advantage in your domain by understanding how to utilize the report and positively impacting your operations and revenue.
- For further assistance, please connect with our analysts.
 Request Customization
 Speak to an Analyst
 Request Brochure
 Inquire Before Buying
Benefits of Customization
- Personalize this research
- Triangulate with your data
- Get data as per your format and definition
- Gain a deeper dive into a specific application, geography, customer, or competitor
- Any level of personalization
Get in Touch With Us
UNITED STATES
Phone: +1-201-971-6302
INDIA
Phone: +91-120-433-0800
UNITED KINGDOM
Phone: +44-753-714-6104
Email: [email protected]
Client Testimonials


.webp)


