
Ball Valves Market Report by Material (Stainless Steel, Cast Iron, Alloy Based, and Others), Valve Type (Trunnion Mounted Ball Valves, Floating Ball Valves, Rising Stem Ball Valves), Size (Up To 1”, 1-6”, 6-25”, 25-50”, 50” and Larger), End Use Industry (Oil & Gas, Water & Wastewater Treatment, Energy & Power, Food & Beverages, Chemicals, Building & Construction, Pulp & Paper, Pharmaceuticals Metals & Mining, Agriculture, and Others), and Region 2026-2034
Ball Valves Market Size:
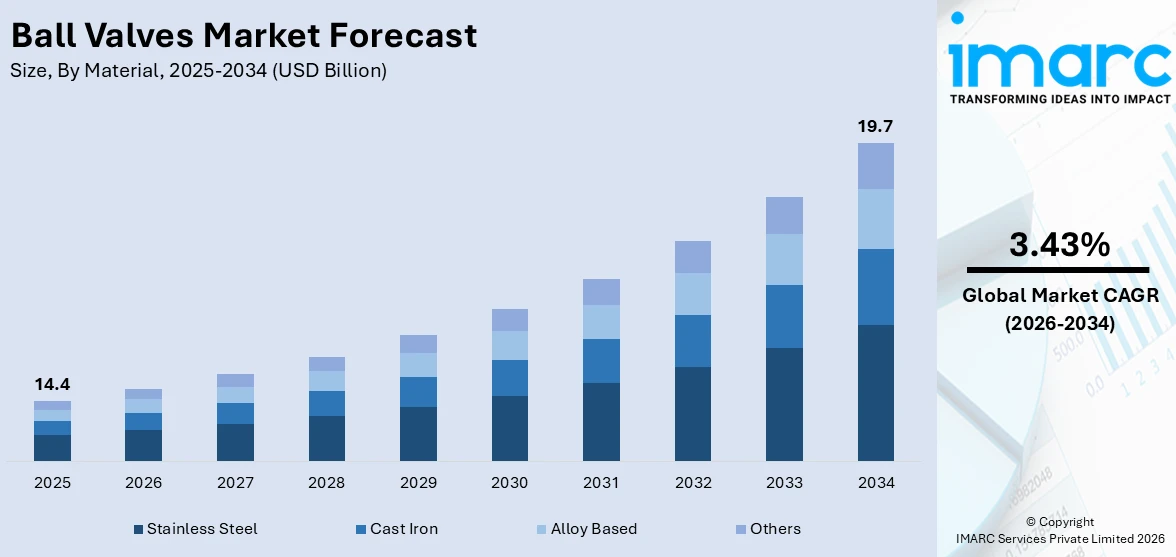
The global ball valves market size reached USD 14.4 Billion in 2025. Looking forward, IMARC Group expects the market to reach USD 19.7 Billion by 2034, exhibiting a growth rate (CAGR) of 3.43% during 2026-2034. The market is experiencing significant growth mainly driven by the rising demand in the oil and gas, water treatment and chemical industries. Enhanced safety and efficiency feature, along with the increasing automation in manufacturing are also contributing positively to the market growth.
|
Report Attribute
|
Key Statistics
|
|---|---|
|
Base Year
|
2025
|
|
Forecast Years
|
2026-2034
|
|
Historical Years
|
2020-2025
|
|
Market Size in 2025
|
USD 14.4 Billion |
|
Market Forecast in 2034
|
USD 19.7 Billion |
| Market Growth Rate 2026-2034 | 3.43% |
Ball Valves Market Analysis:
- Major Market Drivers: Key market drivers include the rising demand from oil and gas, water treatment and chemical industries where these valves are crucial for regulating flow. The push towards automation in manufacturing processes boosts the demand due to ball valves’ reliability and efficiency. Technological advancements like smart valves with IoT capabilities further enhances the operational performance and monitoring thereby driving the market adoption. Furthermore, the rapid expansion in infrastructure projects mainly in emerging economies necessitates advanced fluid control systems. Environmental regulations and promoting efficient water management and waste reduction further stimulates the ball valves market growth.
- Key Market Trends: Key market trends include the integration of the smart technologies like IoT enabled valves which enhances real time monitoring and predictive maintenance. There is a growing preference for automated and electric operated ball valves generally driven by the advancements in process automation. The gradual shift towards environmentally friendly and energy efficient solutions it is also notable with the increased use of material that offers better durability and performance. Furthermore, the rising investment in infrastructure development mainly in emerging economies are significantly influencing the ball valves market dynamics.
- Geographical Trends: Geographical trends in the market showed significant growth in Asia Pacific mainly driven by the rapid industrialization and extensive infrastructure projects in countries like China and India. North America and Europe remain strong markets mainly due to their ongoing advancements in automation and stringent environmental regulations. The Middle East and Africa also showed significant growth generally fueled by significant investments in oil and gas exploration. Latin America is witnessing steady demand supported by the expansion of mining and energy sectors.
- Competitive Landscape: Some of the major market players in the ball valves industry include Aalberts N.V., Alfa Laval, Schlumberger Limited, The Crane Company, The Curtiss-Wright Corporation, Dwyer Instruments Inc., Emerson Electric Co., The Flowserve Corporation, IMI Plc, KITZ Corporation, Niuwei Group Co. Ltd. and Velan Inc., among many others.
- Challenges and Opportunities: The market faces various challenges which includes fluctuation in raw material prices, intense competition which in turn leads to pricing pressures and the pressing need for compliance with strict regulations. However, opportunities abound with the widespread adoption of the smart and automated valve solutions generally driven by industry 4.0 trends. Expansion in emerging markets mainly in Asia Pacific and Africa represents significant growth potential. Furthermore, the growing focus on sustainable and energy efficient solutions opens new avenues for innovative products tailored to meet evolving environmental standards.
To get more information on this market Request Sample
Ball Valves Market Trends:
Technological Advancements
Technological advancements in ball valves include the integration of IoT and smart valve technology, which boost their functionality and efficiency significantly. These innovations enable remote monitoring, allowing operators to oversee valve performance from afar. Predictive maintenance uses data analytics to anticipate and address potential issues before they lead to failures, thereby reducing downtime. Real-time data analytics provide instant insights into valve operations, enhancing overall operational efficiency. These advancements ensure more reliable and efficient valve management, leading to cost savings and improved process control in various industrial applications. For instance, in March 2024, Valmet introduced the Neles 6D ball valve. It was designed to meet the latest API 6D standards after over two years of development. This product line aims to provide a comprehensive solution for customers' ball valve needs, offering reliability, reduced emissions, and ease of ownership. Valmet emphasizes environmental responsibility, aiming to lower emissions and enhance simplicity in the valve's design and maintenance.
Rising Product Demand from Oil and Gas Industry
The oil and gas sector remains a crucial driver for the ball valves market growth, driven by increasing exploration and production activities. The industry's need for reliable flow control solutions in harsh and demanding environments is propelling the demand for high-performance ball valves. For instance, in November 2023, Flowserve introduced the Worcester Cryogenic series. This series features reduced-port, quarter-turn floating ball valves tailored to the LNG, hydrogen, and industrial gas sectors. The valves boast a high-strength stem, superior fugitive emissions control, and a modular bolted bonnet design for cost-effective flexibility. They comply with global standards for fire safety and fugitive emissions, making them suitable for various industries and applications. These valves are essential for managing the flow of oil, gas, and other fluids under extreme pressures and temperatures, ensuring operational efficiency and safety. The continuous advancements and expansions in oil and gas infrastructure further enhance the demand for robust and durable ball valves.
Increasing Need of Water and Wastewater Treatment
The growing infrastructure for water and wastewater treatment, fueled by urbanization and population growth, is significantly increasing the demand for ball valves. Based on a report published by International Trade Administration (ITA), the current market value of water and wastewater treatment sector in India is around $11 billion and is expected to exceed $18 billion by 2026. India, despite having 18% of the world's population, only has access to 4% of the world's water sources, leading to water scarcity in multiple regions. In response, India has ambitious plans to develop comprehensive water and wastewater treatment and distribution infrastructure. Several national initiatives, such as the Jal Jeevan Mission and AMRUT, are contributing to the market's growth. These valves play a crucial role in managing water flow and ensuring the efficiency of treatment processes. They provide precise control, durability, and reliability needed in various stages of water purification and distribution. As municipalities and industries strive to meet higher standards for water quality and environmental regulations, the use of advanced ball valves becomes essential to maintain and enhance the effectiveness of water treatment systems.
Ball Valves Market Segmentation:
IMARC Group provides an analysis of the key trends in each segment of the market, along with forecasts at the global, regional, and country levels for 2026-2034. Our report has categorized the market based on material, valve type, size and end use industry.
Breakup by Material:
- Stainless Steel
- Cast Iron
- Alloy Based
- Others
Stainless Steel accounts for the majority of the market share
The report has provided a detailed breakup and analysis of the market based on the material. This includes stainless steel, cast iron, alloy based and others. According to the report, stainless steel represented the largest segment.
Stainless steel holds the largest ball valves market share due to its exceptional durability, corrosion resistance, and ability to withstand high pressures and temperatures. This makes it ideal for various industries, including oil and gas, chemical processing, and water treatment. The material's longevity and low maintenance requirements contribute to its widespread adoption. Additionally, the increasing focus on hygiene and contamination prevention in food and beverage and pharmaceutical sectors further boosts the demand for stainless steel ball valves, solidifying its market leadership. For instance, in June 2024, Baltic Valve Co., Ltd. unveiled a premium Super Duplex Steel ASTM A182 F51 Ball Valve designed for industrial excellence. The 3-piece, Side Entry, Full Bore valve features Trunnion Mounting, Solid Ball, and impressive key features such as Fire Safe Design, Anti-static Device, and Anti-blow Out Proof Stem. With material specifications meeting ASTM A182 F51 and Nylon 12 standards, this 14-inch valve is set to offer high performance in industrial applications.
Breakup by Valve Type:
- Trunnion Mounted Ball Valves
- Floating Ball Valves
- Rising Stem Ball Valves
Trunnion Mounted Ball Valves holds the largest share of the industry
A detailed breakup and analysis of the market based on the valve type have also been provided in the report. This includes trunnion mounted ball valves, floating ball valves and rising stem ball valves. According to the report, trunnion mounted ball valves accounted for the largest market share.
Trunnion mounted ball valves leads the market accounting for the largest ball valves market share due to their superior performance in high-pressure applications. Unlike floating ball valves, trunnion mounted designs provide additional support to the ball through a trunnion, reducing the operating torque and enabling smoother operation. This makes them highly suitable for large-scale industries such as oil and gas, petrochemical, and power generation, where reliability and efficiency are critical. Their ability to handle high pressure and large volumes with minimal wear and tear, coupled with enhanced sealing capabilities, drives their widespread adoption, reinforcing their dominance in the market.
Breakup by Size:
- Up To 1”
- 1-6”
- 6-25”
- 25-50”
- 50” and Larger
1-6” represents the leading market segment
The report has provided a detailed breakup and analysis of the market based on the size. This includes up to 1”, 1-6”, 6-25”, 25-50” and 50” and larger. According to the report, 1-6” represented the largest segment.
The 1-6” ball valves segment represents the leading share of the ball valves market, driven by their extensive use across various industries due to their versatility and adaptability. These valves are essential in applications requiring precise flow control and reliability, such as in water and wastewater treatment, oil and gas pipelines, and chemical processing. Their manageable size and efficiency in handling moderate pressures and flow rates make them ideal for both industrial and commercial uses. The segment's dominance is further bolstered by the growing demand for efficient fluid handling systems in infrastructure development and the maintenance of existing pipelines and facilities.
Breakup by End Use Industry:
Access the comprehensive market breakdown Request Sample
- Oil & Gas
- Water & Wastewater Treatment
- Energy & Power
- Food & Beverages
- Chemicals
- Building & Construction
- Pulp & Paper
- Pharmaceuticals Metals & Mining
- Agriculture
- Others
Oil & Gas exhibits a clear dominance in the market
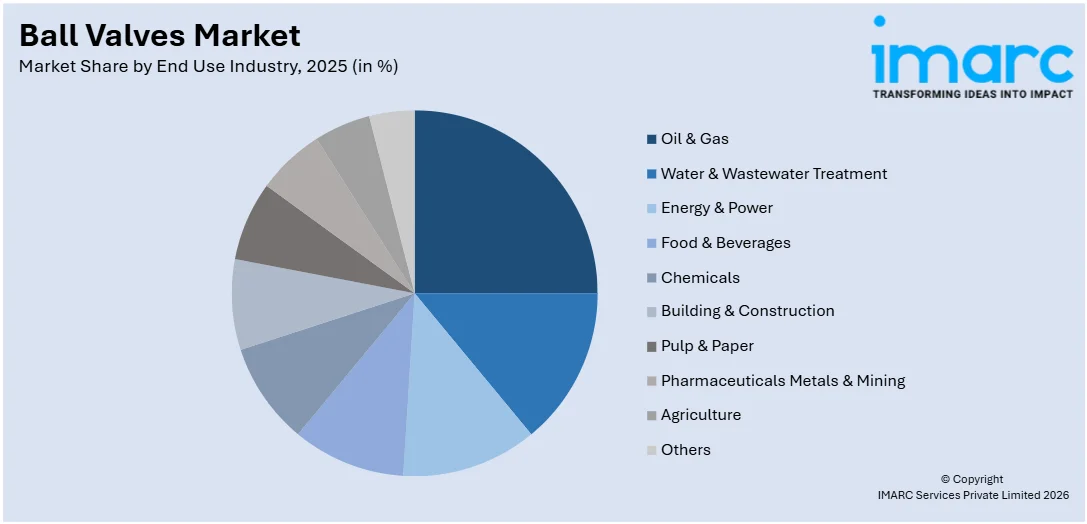
A detailed breakup and analysis of the market based on the end use industry have also been provided in the report. This includes oil & gas, water & wastewater treatment, energy & power, food & beverages, chemicals, building & construction, pulp & paper, pharmaceuticals metals & mining, agriculture and others. According to the report, oil & gas accounted for the largest market share.
The oil and gas industry exhibits clear dominance in the ball valves market, significantly influencing the ball valves market share. This sector's demand for robust and reliable flow control solutions is driven by the need for efficient operation in high-pressure and high-temperature environments. Ball valves' ability to provide tight shut-off and durable performance in challenging conditions makes them indispensable in upstream, midstream, and downstream operations. The continuous exploration, production, and transportation activities within the oil and gas sector further bolster the market share of ball valves, underscoring their critical role in ensuring safety and efficiency in these demanding applications. For instance, in January 2024, Control Devices LLC, a company under HBM Holdings, completed the acquisition of Gilmore. This acquisition will expand Control Devices' portfolio in the energy market, particularly in the oil and gas sector. Gilmore, known for its high-performance severe-service valves, will bring expertise and a talented team to Control Devices. The acquisition is expected to accelerate Gilmore's growth plans and further its commitment to developing reliable flow control solutions.
Breakup by Region:
- North America
- United States
- Canada
- Asia-Pacific
- China
- Japan
- India
- South Korea
- Australia
- Indonesia
- Others
- Europe
- Germany
- France
- United Kingdom
- Italy
- Spain
- Russia
- Others
- Latin America
- Brazil
- Mexico
- Others
- Middle East and Africa
Asia Pacific leads the market, accounting for the largest ball valves market share
The report has also provided a comprehensive analysis of all the major regional markets, which include North America (the United States and Canada); Europe (Germany, France, the United Kingdom, Italy, Spain, Russia, and others); Asia Pacific (China, Japan, India, South Korea, Australia, Indonesia, and others); Latin America (Brazil, Mexico, and others); and the Middle East and Africa. According to the report, Asia Pacific represents the largest regional market for ball valves.
The Asia Pacific region leads the ball valves market, accounting for the largest ball valves market share due to rapid industrialization and urbanization. Major economies such as China, India, and Japan drive the demand, with extensive applications in oil and gas, chemical, and water treatment industries. The region's growing infrastructure projects and expanding energy sectors further boost the need for reliable flow control solutions. Additionally, increasing investments in manufacturing and processing industries enhance the adoption of ball valves. For instance, in June 2024, KITZ Corporation announced the establishment of a sales company in India to expand its business in the growing Indian market. The new subsidiary aims to increase sales of its main products, such as butterfly valves, ball valves, and actuators. The company also plans to utilize Indian parts suppliers to strengthen the KITZ Group's supply chain. The presence of numerous local manufacturers offering cost-effective solutions also contributes to the region's dominant market position.
Competitive Landscape:
- The market research report has also provided a comprehensive analysis of the competitive landscape in the market. Detailed profiles of all major companies have also been provided. Some of the major market players in the ball valves industry include Aalberts N.V., Alfa Laval, Schlumberger Limited, The Crane Company, The Curtiss-Wright Corporation, Dwyer Instruments Inc., Emerson Electric Co., The Flowserve Corporation, IMI Plc, KITZ Corporation, Niuwei Group Co. Ltd. and Velan Inc.
(Please note that this is only a partial list of the key players, and the complete list is provided in the report.)
- The ball valves market is highly competitive, characterized by the presence of numerous global and regional players. Key companies such as Emerson Electric Co., Flowserve Corporation, and Alfa Laval AB dominate the market, leveraging extensive product portfolios and advanced technologies. These industry leaders focus on innovation, strategic mergers, and acquisitions to enhance their market presence and gain a competitive edge. Additionally, smaller and regional manufacturers are intensifying competition by offering cost-effective and customized solutions. The market's competitive landscape is further shaped by technological advancements, increasing demand for automation, and stringent regulatory standards driving quality and performance enhancements.
Ball Valves Market News:
- In April 2024, Metalúrgica Golden Art’s Ltda. (MGA), a company within the KITZ Group in Brazil, completed construction of a new 6,189-square-meter plant to increase industrial ball valve production by 30%.
- In May 2024, Viega LLC expanded its press system portfolio with the introduction of 21 new valve products, including filters, swing check valves, hydronic balancing valves, and brass ball valves. This expansion aims to reduce installation time and establish Viega as a one-stop shop solution for residential, commercial, and industrial projects. The new valves can be readily specified and purchased for various applications, offering increased efficiency and cost savings through the use of Viega's press technology.
Ball Valves Market Report Scope:
| Report Features | Details |
|---|---|
| Base Year of the Analysis | 2025 |
| Historical Period | 2020-2025 |
| Forecast Period | 2026-2034 |
| Units | Billion USD |
| Scope of the Report | Exploration of Historical Trends and Market Outlook, Industry Catalysts and Challenges, Segment-Wise Historical and Future Market Assessment:
|
| Materials Covered | Stainless Steel, Cast Iron, Alloy Based, Others |
| Valve Types Covered | Trunnion Mounted Ball Valves, Floating Ball Valves, Rising Stem Ball Valves |
| Sizes Covered | Up To 1”, 1-6”, 6-25”, 25-50”, 50” and Larger |
| End Use Industries Covered | Oil & Gas, Water & Wastewater Treatment, Energy & Power, Food & Beverages, Chemicals, Building & Construction, Pulp & Paper, Pharmaceuticals Metals & Mining, Agriculture, Others |
| Regions Covered | Asia Pacific, Europe, North America, Latin America, Middle East and Africa |
| Countries Covered | United States, Canada, Germany, France, United Kingdom, Italy, Spain, Russia, China, Japan, India, South Korea, Australia, Indonesia, Brazil, Mexico |
| Companies Covered | Aalberts N.V., Alfa Laval, Schlumberger Limited, The Crane Company, The Curtiss-Wright Corporation, Dwyer Instruments Inc., Emerson Electric Co., The Flowserve Corporation, IMI Plc, KITZ Corporation, Niuwei Group Co. Ltd., Velan Inc., etc. |
| Customization Scope | 10% Free Customization |
| Post-Sale Analyst Support | 10-12 Weeks |
| Delivery Format | PDF and Excel through Email (We can also provide the editable version of the report in PPT/Word format on special request) |
Key Benefits for Stakeholders:
- IMARC’s industry report offers a comprehensive quantitative analysis of various market segments, historical and current market trends, market forecasts, and dynamics of the ball valves market from 2020-2034.
- The research report provides the latest information on the market drivers, challenges, and opportunities in the global ball valves market.
- The study maps the leading, as well as the fastest-growing, regional markets. It further enables stakeholders to identify the key country-level markets within each region.
- Porter's five forces analysis assists stakeholders in assessing the impact of new entrants, competitive rivalry, supplier power, buyer power, and the threat of substitution. It helps stakeholders to analyze the level of competition within the ball valves industry and its attractiveness.
- The competitive landscape allows stakeholders to understand their competitive environment and provides insight into the current positions of key players in the market.
Frequently Asked Questions About the Ball Valves Market Report
The global ball valves market was valued at USD 14.4 Billion in 2025.
We expect the global ball valves market to exhibit a CAGR of 3.43% during 2026-2034.
The growing utilization of ball valves across numerous industries, such as oil and gas, chemical, pharmaceuticals, etc., owing to their versatility and ability to handle various fluid types and pressure, is primarily driving the global ball valves market.
The sudden outbreak of the COVID-19 pandemic has led to the increasing demand for ball valves in oxygen therapy devices and blood analyzers that assist in treating the coronavirus-infected patients.
Based on the material, the global ball valves market has been divided into stainless steel, cast iron, alloy based, and others. Among these, stainless steel currently exhibits a clear dominance in the market.
Based on the valve type, the global ball valves market can be categorized into trunnion mounted ball valves, floating ball valves, and rising stem ball valves. Currently, trunnion mounted ball valves account for the majority of the global market share.
Based on the size, the global ball valves market has been segregated into up to 1”, 1-6”, 6-25”, 25-50”, and 50” and larger. Among these, 1-6” currently exhibits a clear dominance in the market.
Based on the end use industry, the global ball valves market can be bifurcated into oil & gas, water & wastewater treatment, energy & power, food & beverages, chemicals, building & construction, pulp & paper, pharmaceuticals metals & mining, agriculture, and others. Currently, oil & gas holds the largest market share.
On a regional level, the market has been classified into North America, Asia-Pacific, Europe, Latin America, and Middle East and Africa, where Asia-Pacific currently dominates the global market.
Some of the major players in the global ball valves market include Aalberts N.V., Alfa Laval, Schlumberger Limited, The Crane Company, The Curtiss-Wright Corporation, Dwyer Instruments Inc., Emerson Electric Co., The Flowserve Corporation, IMI Plc, KITZ Corporation, Niuwei Group Co. Ltd., and Velan Inc.
Need more help?
- Speak to our experienced analysts for insights on the current market scenarios.
- Include additional segments and countries to customize the report as per your requirement.
- Gain an unparalleled competitive advantage in your domain by understanding how to utilize the report and positively impacting your operations and revenue.
- For further assistance, please connect with our analysts.
 Request Customization
 Speak to an Analyst
 Request Brochure
 Inquire Before Buying
Benefits of Customization
- Personalize this research
- Triangulate with your data
- Get data as per your format and definition
- Gain a deeper dive into a specific application, geography, customer, or competitor
- Any level of personalization
Get in Touch With Us
UNITED STATES
Phone: +1-201-971-6302
INDIA
Phone: +91-120-433-0800
UNITED KINGDOM
Phone: +44-753-714-6104
Email: [email protected]
Client Testimonials


.webp)


