
Bio-Ethanol Prices, Trend, Chart, Demand, Market Analysis, News, Historical and Forecast Data Report 2026 Edition
Bio-Ethanol Price Trend, Index and Forecast
Track the latest insights on bio-ethanol price trend and forecast with detailed analysis of regional fluctuations and market dynamics across North America, Latin America, Central Europe, Western Europe, Eastern Europe, Middle East, North Africa, West Africa, Central and Southern Africa, Central Asia, Southeast Asia, South Asia, East Asia, and Oceania.
Bio-Ethanol Prices Outlook Q1 2026
- India: USD 815/MT
- China: USD 693/MT
- Germany: USD 718/MT
- Brazil: USD 883/MT
- South Korea: USD 792/MT
Bio-Ethanol Price Chart

Get real-time access to monthly/quaterly/yearly prices Request Sample
During the first quarter of 2026, the bio-ethanol prices in India reached 815 USD/MT in March. The market experienced a strong upward trend supported by rising demand from the fuel blending sector and steady consumption from industrial applications. Government policies promoting ethanol blending encouraged consistent procurement activity. Feedstock availability remained controlled due to fluctuating agricultural output, which tightened supply conditions.
During the first quarter of 2026, the bio-ethanol prices in China reached 693 USD/MT in March. The market observed moderate growth driven by steady demand from the fuel and industrial sectors. Domestic production remained stable, while feedstock supply conditions influenced overall availability. Consumption from blending activities supported consistent market activity. Import levels remained balanced, contributing to controlled supply conditions.
During the first quarter of 2026, the bio-ethanol prices in Germany reached 718 USD/MT in March. The market experienced a steady increase supported by consistent demand from renewable energy and fuel blending sectors. Regulatory support for sustainable fuels contributed to stable consumption patterns. Supply conditions remained controlled due to limited feedstock availability and stable import flows. Market participants maintained balanced procurement strategies, ensuring steady offtake.
During the first quarter of 2026, the bio-ethanol prices in Brazil reached 883 USD/MT in March. The market recorded a strong upward trend driven by robust demand from the domestic fuel sector and export markets. Feedstock availability was influenced by agricultural conditions, which impacted production levels. Consumption remained strong due to widespread use in fuel blending applications. Export activity contributed to tightening supply in the domestic market.
During the first quarter of 2026, the bio-ethanol prices in South Korea reached 792 USD/MT in March. The market witnessed noticeable growth supported by steady demand from fuel blending and industrial sectors. Import dependency influenced supply conditions, with stable inflows ensuring availability. Consumption remained consistent, supporting regular procurement activity. Logistics and transportation costs contributed to pricing trends.
Bio-Ethanol Prices Outlook Q4 2025
- India: USD 740/MT
- China: USD 671/MT
- Germany: USD 702/MT
- Brazil: USD 786/MT
- South Korea: USD 739/MT
During the fourth quarter of 2025, the bio-ethanol prices in India reached 740 USD/MT in December. The quarterly increase was supported by firm domestic blending mandates and steady procurement by state fuel marketing companies. Improved demand from the transportation fuel segment, combined with controlled inventory levels, sustained upward price momentum. Feedstock availability remained moderately tight due to seasonal variations in sugarcane output, leading to higher production costs.
During the fourth quarter of 2025, the bio-ethanol prices in China reached 671 USD/MT in December. The market witnessed gradual price gains driven by stable industrial consumption and resilient demand from the chemical and solvent sectors. Domestic corn-based ethanol production costs remained elevated due to feedstock procurement challenges and energy expenses. Environmental compliance measures and controlled operating rates at several production facilities limited output growth.
During the fourth quarter of 2025, the bio-ethanol prices in Germany reached 702 USD/MT in December. The price increases reflected firm demand from the renewable fuel blending segment amid ongoing decarbonization targets. Feedstock grain prices remained elevated, impacting production economics for ethanol manufacturers. Energy costs and regulatory compliance expenses further added to operational burdens. Imports from neighboring European countries remained stable but were insufficient to significantly soften domestic prices.
During the fourth quarter of 2025, the bio-ethanol prices in Brazil reached 786 USD/MT in December. Strong demand from the domestic fuel sector, particularly amid an active sugarcane crushing season, influenced pricing dynamics. While production volumes improved seasonally, export commitments and steady domestic consumption kept supply relatively balanced. Currency fluctuations and logistical costs impacted export competitiveness and domestic pricing alignment.
During the fourth quarter of 2025, the bio-ethanol prices in South Korea reached 739 USD/MT in December. The modest price rise was primarily driven by steady import demand and stable industrial usage in chemical processing sectors. Limited domestic production capacity kept reliance on imported cargoes intact. Freight rates and currency movements played a role in shaping procurement costs. Downstream demand from sanitization and solvent applications remained consistent, supporting buying activity.
Bio-Ethanol Prices Outlook Q3 2025
- India: USD 724/MT
- China: USD 658/MT
- Germany: USD 687/MT
- Brazil: USD 762/MT
- South Korea: USD 731/MT
During the third quarter of 2025, the bio-ethanol prices in India reached 724 USD/MT in September. The market experienced a gradual price increase supported by consistent demand from fuel blending programs. Feedstock cost pressures stemming from crop procurement influenced production expenses. Seasonal variations in supply and steady offtake by oil marketing companies contributed to firm market sentiment. Industrial demand from the beverage and pharmaceutical sectors remained stable, reinforcing consumption levels.
During the third quarter of 2025, the bio-ethanol prices in China reached 658 USD/MT in September. Prices advanced amid steady downstream consumption and improved industrial activity. Feedstock supply constraints and elevated raw material procurement costs supported firm pricing. Production discipline among major manufacturers prevented oversupply in the domestic market. Demand from chemical processing and fuel blending applications remained resilient.
During the third quarter of 2025, the bio-ethanol prices in Germany reached 687 USD/MT in September. The market recorded a decline during the quarter due to relatively weaker industrial demand and improved regional supply availability. Increased imports from neighboring markets enhanced product availability. Feedstock price moderation eased production cost pressures, allowing suppliers to offer competitive pricing. Slower procurement from fuel distributors temporarily softened market sentiment.
During the third quarter of 2025, the bio-ethanol prices in Brazil reached 762 USD/MT in September. The upward trend was driven by firm domestic fuel consumption and steady export inquiries. Supply dynamics were influenced by crop harvesting cycles and processing capacities. Currency fluctuations impacted export pricing competitiveness. Consistent demand from transportation fuel blending supported market fundamentals.
During the third quarter of 2025, the bio-ethanol prices in South Korea reached 731 USD/MT in September. Prices declined slightly due to softer import costs and improved cargo availability from key exporting countries. Stable industrial demand was insufficient to counterbalance the easing supply pressure. Currency stabilization supported procurement at relatively competitive levels. Inventory replenishment activities slowed as buyers anticipated improved supply conditions.
Bio-Ethanol Prices Outlook Q2 2025
- India: USD 717/KG
- China: USD 645/KG
- Germany: USD 703/KG
- Brazil: USD 741/KG
- South Korea: USD 745/KG
During the second quarter of 2025, the bio-ethanol prices in India reached 717 USD/KG in June. As per the bio-ethanol price chart, states like Gujarat saw substantial investments in biofuel infrastructure, including ethanol production facilities. These investments were part of a broader strategy to enhance domestic ethanol production capacity, reduce dependence on fossil fuels, and support rural economies. This contributed to the stabilization and gradual increase in bioethanol prices in India during Q2 2025, aligning with the country's renewable energy objectives and the EBP programme's goals.
During the second quarter of 2025, the bio-ethanol prices in China reached 645 USD/KG in June. The market price of corn-based ethanol in the Sichuan region saw a decrease. The primary reason for this decline was that the early orders had already been executed, leading to reduced demand for immediate procurement. Additionally, the influx of cheaper corn ethanol from other regions pressured the market, resulting in a price drop.
During the second quarter of 2025, bio-ethanol prices in Germany reached 703 USD/KG in June. Germany's bioethanol prices were influenced by the increasing environmental awareness and government incentives supporting renewable energy sources. The demand for bioethanol as a cleaner alternative to traditional fossil fuels rose, particularly in the transportation sector, where bioethanol blends were used to reduce carbon emissions.
During the second quarter of 2025, the bio-ethanol prices in Brazil reached 741 USD/KG in June. Brazil's bioethanol market experienced significant shifts due to the government's decision to increase the ethanol blend in gasoline. This policy change, approved by the National Energy Policy Council (CNPE), aimed to enhance energy independence and reduce fuel costs.
During the second quarter of 2025, the bio-ethanol prices in South Korea reached 745 USD/KG in June. South Korea relies heavily on imports for its bioethanol supply. Hence, fluctuations in global feedstock prices, such as corn, impacted the cost of imported ethanol. Additionally, disruptions in supply chains and changes in trade policies also affected the availability and pricing of bioethanol in South Korea.
Bio-Ethanol Prices Outlook Q1 2025
- India: USD 706/MT
- China: USD 630/MT
- Germany: USD 681/MT
- Brazil: USD 715/MT
- South Korea: USD 755/MT
During the first quarter of 2025, the bio-ethanol prices in India reached 706 USD/MT in March. As per the bio-ethanol price chart, prices in India experienced fluctuations due to several factors, including government blending mandates, production volumes, and feedstock availability.
During the first quarter of 2025, bio-ethanol prices in China reached 630 USD/MT in March. Domestic production capacity struggled to keep pace with the rising demand, leading to increased reliance on imports. Besides, government policies supporting biofuel blending mandates also played a role in sustaining market demand and prices.
During the first quarter of 2025, the bio-ethanol prices in Germany reached 681 USD/MT in March. The implementation of more stringent renewable fuel standards increased demand for bio-ethanol as a biofuel component. Besides, higher greenhouse gas quotas for 2025 also boosted the demand for bio-ethanol, as it helped companies meet their emissions reduction targets.
During the first quarter of 2025, the bio-ethanol prices in Brazil reached 715 USD/MT in March. Brazil saw fluctuating bio-ethanol prices due to a mix of strong domestic demand, proposed increase in the ethanol blending ratio, and government policy changes. Besides, corn-based ethanol production saw significant growth, influencing overall prices.
During the first quarter of 2025, the bio-ethanol prices in South Korea reached 755 USD/MT in March. The overall market was affected by various factors, including feedstock costs like corn prices, seasonal demand changes, and varying blending requirements.
Regional Coverage
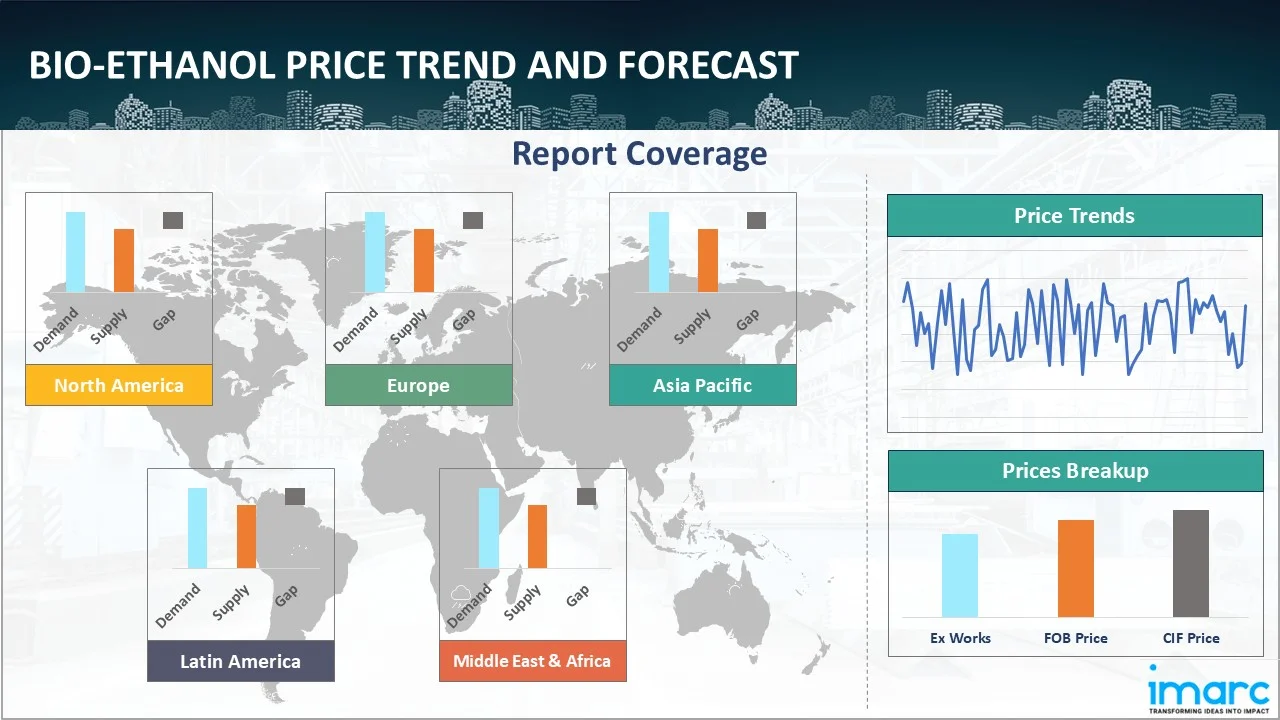
The report provides a detailed analysis of the market across different regions, each with unique pricing dynamics influenced by localized market conditions, supply chain intricacies, and geopolitical factors. This includes price trends, price forecast and supply and demand trends for each region, along with spot prices by major ports. The report also provides coverage of FOB and CIF prices, as well as the key factors influencing bio-ethanol prices.
Europe Bio-Ethanol Price Trend
Q1 2026:
The bio-ethanol price index in Europe showed a steady upward trend supported by consistent demand from the renewable fuel and energy sectors. Regulatory frameworks promoting the use of sustainable fuels continued to encourage steady consumption across key economies. Demand from fuel blending operations remained firm, ensuring regular offtake in the market. At the same time, feedstock availability remained controlled due to agricultural supply conditions, which influenced production levels and limited excess output. Import flows remained balanced, helping maintain supply continuity without creating surplus conditions.
Q4 2025:
In Europe, the bio-ethanol price index reflected a firm upward movement. Strong adherence to renewable energy directives and sustained blending mandates supported consistent demand. Elevated grain feedstock costs and regulatory compliance expenses influenced production economics. Import flows remained stable but did not create oversupply conditions. Industrial consumption across the pharmaceutical and beverage sectors contributed additional demand support, reinforcing the regional price strength.
Q3 2025:
In Europe, the bio-ethanol price index indicated a softer trajectory, reflecting evolving supply-side dynamics across key producing nations. Improved production rates following earlier maintenance shutdowns increased product availability in several markets. Moderation in grain and sugar-based feedstock costs reduced manufacturing pressure, enabling suppliers to offer more competitive quotations. Import arrivals from neighboring regions supplemented domestic output, contributing to comfortable inventory positions. Although demand from fuel blending programs remained structurally intact, purchasing volumes lacked strong incremental growth.
Q2 2025:
As per the bio-ethanol price index, adverse weather conditions in key producing countries, such as France and Ukraine, resulted in poorer harvests for corn. This reduced feedstock availability, leading to higher input costs for bioethanol producers and subsequently increasing market prices. Besides, congestion at major European ports and rail delays disrupted supply chains, causing temporary shortages and price fluctuations in the bioethanol market. These logistical challenges added to the upward pressure on prices during the quarter.
Q1 2025:
As per the bio-ethanol price index, in the first quarter of 2025, prices in Europe fluctuated due to a combination of regulatory changes, supply chain disruptions, and shifting demand. Stricter renewable fuel standards in Germany and improved greenhouse gas quotas initially drove prices, but these increases were later offset by weakened demand after the winter and logistical challenges.
This analysis can be extended to include detailed bio-ethanol price information for a comprehensive list of countries.
| Region | Countries Covered |
|---|---|
| Europe | Germany, France, United Kingdom, Italy, Spain, Russia, Turkey, Netherlands, Poland, Sweden, Belgium, Austria, Ireland, Switzerland, Norway, Denmark, Romania, Finland, Czech Republic, Portugal, and Greece, among other European countries. |
North America Bio-Ethanol Price Trend
Q1 2026:
The bio-ethanol price index in North America reflected varied trends driven by steady demand from fuel blending and industrial sectors. Consumption remained consistent across transportation fuel applications, supported by ongoing blending requirements and stable industrial usage. Production levels were maintained through reliable feedstock availability, ensuring an uninterrupted supply to the market. At the same time, export demand remained stable, contributing to balanced supply distribution.
Q4 2025:
In North America, the bio-ethanol price index demonstrated varied trends supported by firm compliance with renewable fuel standards and consistent gasoline blending requirements. Ethanol producers maintained disciplined operating rates to prevent excess supply, aligning output closely with steady domestic consumption. Agricultural feedstock availability remained stable, yet procurement strategies reflected cautious inventory management amid evolving crop conditions. Export demand remained active, absorbing incremental volumes and preventing stock accumulation.
Q3 2025:
In North America, the bio-ethanol price index registered fluctuations supported by consistent renewable fuel blending requirements and stable crop harvesting conditions. Ethanol producers maintained disciplined operating strategies, aligning production closely with domestic gasoline demand to avoid excessive inventory accumulation. Agricultural feedstock availability remained dependable yet cost management strategies among producers preserved margin stability. Export inquiries from Latin America and selected Asian markets provided incremental offtake opportunities, supporting balanced stock levels.
Q2 2025:
The US Renewable Fuel Standard (RFS) continued to drive demand for bioethanol by mandating the blending of renewable fuels with conventional transportation fuels. This policy ensured a consistent market for bioethanol, supporting price stability. In Canada, similar policies aimed at reducing greenhouse gas emissions and promoting renewable energy sources further bolstered demand. Besides, corn, the primary feedstock for bioethanol production in the US, experienced price fluctuations due to varying crop yields and input costs. Increased corn prices raised production costs, which, in turn, influenced bioethanol prices.
Q1 2025:
Bio-ethanol prices in North America fluctuated due to a combination of factors, including rising corn prices, strong export demand, and changes in domestic blending requirements. Besides, government regulations like the Renewable Fuel Standard (RFS) in the USA also influenced prices. Moreover, global events such as trade agreements and weather patterns impacted both supply and demand, influencing price movements.
Specific bio-ethanol historical data within the United States and Canada can also be provided.
| Region | Countries Covered |
|---|---|
| North America | United States and Canada |
Middle East and Africa Bio-Ethanol Price Trend
Q1 2026:
The study examines the Middle East and Africa's bio-ethanol trends and pricing chart, taking into account variables that specifically affect market prices, such as regional industrial expansion, the availability of natural resources, and geopolitical tensions.
Q4 2025:
The report explores the bio-ethanol trends and bio-ethanol price chart in the Middle East and Africa, considering factors like regional industrial growth, the availability of natural resources, and geopolitical tensions that uniquely influence market prices.
Q3 2025:
As per the bio-ethanol price chart, the prices in the Middle East and Africa fluctuated due to a complex interplay of factors, primarily driven by supply chain disruptions, seasonal demand shifts, and geopolitical influences.
In addition to region-wise data, information on bio-ethanol prices for countries can also be provided.
| Region | Countries Covered |
|---|---|
| Middle East & Africa | Saudi Arabia, UAE, Israel, Iran, South Africa, Nigeria, Oman, Kuwait, Qatar, Iraq, Egypt, Algeria, and Morocco, among other Middle Eastern and African countries. |
Asia Pacific Bio-Ethanol Price Trend
Q1 2026:
In the Asia Pacific region, bio-ethanol prices showed moderate growth, driven by steady demand from fuel blending and industrial applications. Consumption remained consistent across major economies, supported by ongoing energy requirements and industrial usage. Production levels were stable, although feedstock availability influenced supply conditions and limited excess output. Import dependency in several countries contributed to pricing sensitivity, particularly in relation to freight and logistics costs. Market participants maintained balanced inventory levels, avoiding aggressive procurement.
Q4 2025:
In the Asia Pacific, the bio-ethanol market exhibited a firm pricing environment underpinned by robust fuel blending mandates in key economies and consistent consumption across the chemical and beverage industries. Producers adjusted operating rates in response to feedstock availability and evolving domestic demand patterns, maintaining a balanced supply scenario. Feedstock procurement costs remained a central pricing determinant, particularly in corn and sugar-based production hubs. Regional trade flows were active, with cross-border shipments ensuring supply continuity without creating surplus conditions.
Q3 2025:
In the Asia Pacific, bio-ethanol prices displayed mixed movements during the third quarter, influenced by divergent feedstock conditions and regional supply balances. In certain producing countries, constrained corn and sugar availability tightened production margins and supported firmer quotations. Conversely, improved output levels in other markets enhanced supply accessibility, leading to localized price corrections. Demand from transportation fuel blending programs remained structurally firm, while chemical and beverage sector consumption provided additional stability.
Q2 2025:
In Q2 2025, bioethanol prices in the Asia-Pacific region, particularly in China, experienced fluctuations. In the Sichuan region, the market price for corn-grade ethanol fell due to a surge in corn availability. Traders' corn inventories were gradually decreasing, leading to reduced purchasing activity and further contributing to the price drop. Moreover, environmental concerns, stringent regulations related to greenhouse gas emissions, and government initiatives promoting bioethanol as a renewable and sustainable alternative to fossil fuels also influenced pricing trends.
Q1 2025:
Bio-ethanol prices in the Asia Pacific region fluctuated due to a mix of factors, including feedstock costs, demand from key industries, and logistical challenges. Rising raw material costs, particularly for corn and sugarcane, put upward pressure on prices, while strong demand from fuel blending and industrial applications in China also contributed to price changes early in the quarter.
This bio-ethanol price analysis can be expanded to include a comprehensive list of countries within the region.
| Region | Countries Covered |
|---|---|
| Asia Pacific | China, India, Indonesia, Pakistan, Bangladesh, Japan, Philippines, Vietnam, Thailand, South Korea, Malaysia, Nepal, Taiwan, Sri Lanka, Hongkong, Singapore, Australia, and New Zealand, among other Asian countries. |
Latin America Bio-Ethanol Price Trend
Q1 2026:
In Latin America, bio-ethanol prices recorded strong growth supported by robust demand from domestic fuel markets and export activity. Consumption remained firm due to widespread use in fuel blending applications, ensuring continuous market demand. Production levels were influenced by feedstock availability, which impacted overall supply conditions. Strong export demand contributed to tighter domestic availability, supporting price increases. Market participants maintained steady procurement strategies to secure supply amid active trading conditions.
Q4 2025:
In Latin America, bio-ethanol prices advanced as strong domestic fuel consumption coincided with sustained export commitments to international markets. Seasonal sugarcane harvesting cycles influenced production volumes, with processing adjustments carefully managed to balance ethanol and sugar output streams. Domestic blending mandates provided a stable demand base, reinforcing consistent procurement by fuel distributors. Export-oriented shipments tightened local availability, supporting price firmness.
Q3 2025:
In Latin America, bio-ethanol prices followed an upward trajectory during the third quarter, supported by firm domestic fuel consumption and consistent export engagement. Seasonal agricultural cycles influenced sugarcane processing volumes, with producers carefully allocating output between sugar and ethanol streams to optimize returns. Active export shipments to international markets tightened local spot availability, reinforcing price strength. Domestic blending mandates sustained predictable offtake from fuel distributors, maintaining healthy demand fundamentals.
Q2 2025:
As per the bio-ethanol price index, Brazil's decision to increase the ethanol blend in gasoline, significantly impacted the market. Besides, fluctuations in energy markets affected production costs and export competitiveness, indirectly influencing regional price trends. Moreover, infrastructure limitations and logistical inefficiencies in certain Latin American countries impacted the supply chain and distribution of bioethanol. These challenges led to regional price disparities, with some areas experiencing higher costs due to transportation bottlenecks and limited access to production facilities.
Q1 2025:
As per the bio-ethanol price index, bio-ethanol prices in Latin America experienced fluctuations due to a combination of factors, including increased production, rising demand, and global market dynamics. Early in the quarter, prices were influenced due to strong domestic demand and exports, particularly from Brazil, supported by government initiatives like blending mandates and rising production.
This comprehensive review can be extended to include specific countries within the region.
| Region | Countries Covered |
|---|---|
| Latin America | Brazil, Mexico, Argentina, Columbia, Chile, Ecuador, and Peru, among other Latin American countries. |
Bio-Ethanol Pricing Report, Market Analysis, and News
IMARC's latest publication, “Bio-Ethanol Prices, Trend, Chart, Demand, Market Analysis, News, Historical and Forecast Data Report 2026 Edition,” presents a detailed examination of the bio-ethanol market, providing insights into both global and regional trends that are shaping prices. This report delves into the spot price of bio-ethanol at major ports and analyzes the composition of prices, including FOB and CIF terms. It also presents detailed bio-ethanol prices trend analysis by region, covering North America, Europe, Asia Pacific, Latin America, and Middle East and Africa. The factors affecting bio-ethanol pricing, such as the dynamics of supply and demand, geopolitical influences, and sector specific developments, are thoroughly explored. This comprehensive report helps stakeholders stay informed with the latest market news, regulatory updates, and technological progress, facilitating informed strategic decision-making and forecasting.
Bio-Ethanol Industry Analysis
The global bio-ethanol market size reached USD 11.35 Billion in 2025. By 2034, IMARC Group expects the market to reach USD 19.24 Billion, at a projected CAGR of 6.04% during 2026-2034. The market is primarily driven by the expanding renewable fuel blending mandates, rising environmental sustainability goals, and increasing demand from industrial solvent and pharmaceutical applications.
Latest News and Developments:
- March 2026: Gevo unveiled plans to expand its North Dakota facility by adding a second bioethanol production unit with a targeted capacity of up to 75 million gallons per year. The company highlighted the site’s strong infrastructure, including carbon capture and sequestration capabilities, as a key advantage. The expansion aims to support low carbon fuel production and enhance revenue through carbon markets. Gevo also planned incremental upgrades to existing capacity, strengthening its position in sustainable aviation fuel and clean energy solutions.
- April 2025: The CEO of NIORDC, the fuel department of the Iranian Oil Ministry, announced that the Iranian Ministry of Industry opened the country's first bioethanol production plant at Kermanshah Refinery in western Iran to significantly reduce emissions and elevate the sustainability of the fuel sector.
- October 2024: Indonesia's state-owned oil corporation, Pertamina, started a pilot project for sorghum growing to be used as a bioethanol feedstock in response to the new government's energy self-sufficiency program. This will lessen dependency on imported wheat and other grains.
Product Description
Bio-ethanol is a renewable form of ethanol (ethyl alcohol) produced through the fermentation of biomass-derived sugars and starches. Commonly sourced from agricultural crops such as corn, sugarcane, wheat, and barley, it can also be made from lignocellulosic materials like crop residues and forestry waste, known as second-generation bio-ethanol. It is primarily used as a biofuel additive in gasoline, helping to reduce greenhouse gas emissions and reliance on fossil fuels. Blends such as E10 (10% ethanol, 90% gasoline) and E85 (up to 85% ethanol) are widely used in transportation to promote cleaner combustion and lower environmental impact.
Bio-ethanol’s significance lies in its ability to provide a sustainable, biodegradable, and low-carbon alternative to conventional fuels. It plays a vital role in achieving national energy security goals and in fulfilling international climate commitments.
Report Coverage
| Key Attributes | Details |
|---|---|
| Product Name | Bio-Ethanol |
| Report Features | Exploration of Historical Trends and Market Outlook, Industry Demand, Industry Supply, Gap Analysis, Challenges, Ammonia Price Analysis, and Segment-Wise Assessment. |
| Currency/Units | US$ (Data can also be provided in local currency) or Metric Tons |
| Region/Countries Covered | The current coverage includes analysis at the global and regional levels only. Based on your requirements, we can also customize the report and provide specific information for the following countries: Asia Pacific: China, India, Indonesia, Pakistan, Bangladesh, Japan, Philippines, Vietnam, Thailand, South Korea, Malaysia, Nepal, Taiwan, Sri Lanka, Hongkong, Singapore, Australia, and New Zealand Europe: Germany, France, United Kingdom, Italy, Spain, Russia, Turkey, Netherlands, Poland, Sweden, Belgium, Austria, Ireland, Switzerland, Norway, Denmark, Romania, Finland, Czech Republic, Portugal and Greece North America: United States and Canada Middle East & Africa: Saudi Arabia, UAE, Israel, Iran, South Africa, Nigeria, Oman, Kuwait, Qatar, Iraq, Egypt, Algeria, and Morocco Latin America: Brazil, Mexico, Argentina, Columbia, Chile, Ecuador, Peru The list of countries presented is not exhaustive. Information on additional countries can be provided if required by the client. |
| Information Covered for Key Suppliers |
|
| Customization Scope | The report can be customized as per the requirements of the customer |
| Report Price and Purchase Option |
Plan A: Monthly Updates - Annual Subscription
Plan B: Quarterly Updates - Annual Subscription
Plan C: Biannually Updates - Annual Subscription
|
| Post-Sale Analyst Support | 360-degree analyst support after report delivery |
| Delivery Format | PDF and Excel through email (We can also provide the editable version of the report in PPT/Word format on special request) |
Key Benefits for Stakeholders:
- IMARC’s report presents a detailed analysis of bio-ethanol pricing, covering global and regional trends, spot prices at key ports, and a breakdown of FOB and CIF prices.
- The study examines factors affecting bio-ethanol price trend, including input costs, supply-demand shifts, and geopolitical impacts, offering insights for informed decision-making.
- The competitive landscape review equips stakeholders with crucial insights into the latest market news, regulatory changes, and technological advancements, ensuring a well-rounded, strategic overview for forecasting and planning.
- IMARC offers various subscription options, including monthly, quarterly, and biannual updates, allowing clients to stay informed with the latest market trends, ongoing developments, and comprehensive market insights. The bio-ethanol price charts ensure our clients remain at the forefront of the industry.
Need more help?
- Speak to our experienced analysts for insights on the current market scenarios.
- Include additional segments and countries to customize the report as per your requirement.
- Gain an unparalleled competitive advantage in your domain by understanding how to utilize the report and positively impacting your operations and revenue.
- For further assistance, please connect with our analysts.
 Request Customization
 Inquire Before Buying
 Speak to an Analyst
 Request Brochure
Benefits of Customization
- Personalize this research
- Triangulate with your data
- Get data as per your format and definition
- Gain a deeper dive into a specific application, geography, customer, or competitor
- Any level of personalization
Get in Touch With Us
UNITED STATES
Phone: +1-201-971-6302
INDIA
Phone: +91-120-433-0800
UNITED KINGDOM
Phone: +44-753-714-6104
Email: [email protected]
Client Testimonials


.webp)


Why Choose Us
IMARC offers trustworthy, data-centric insights into commodity pricing and evolving market trends, enabling businesses to make well-informed decisions in areas such as procurement, strategic planning, and investments. With in-depth knowledge spanning more than 1000 commodities and a vast global presence in over 150 countries, we provide tailored, actionable intelligence designed to meet the specific needs of diverse industries and markets.
1000
+Commodities
150
+Countries Covered
3000
+Clients
20
+Industry
Robust Methodologies & Extensive Resources
IMARC delivers precise commodity pricing insights using proven methodologies and a wealth of data to support strategic decision-making.
Subscription-Based Databases
Our extensive databases provide detailed commodity pricing, import-export trade statistics, and shipment-level tracking for comprehensive market analysis.
Primary Research-Driven Insights
Through direct supplier surveys and expert interviews, we gather real-time market data to enhance pricing accuracy and trend forecasting.
Extensive Secondary Research
We analyze industry reports, trade publications, and market studies to offer tailored intelligence and actionable commodity market insights.
Trusted by 3000+ industry leaders worldwide to drive data-backed decisions. From global manufacturers to government agencies, our clients rely on us for accurate pricing, deep market intelligence, and forward-looking insights.