
Blasting Automation Services Market Report by Application (Metal Mining, Non-Metal Mining, Coal Mining), and Region 2026-2034
Blasting Automation Services Market Size:
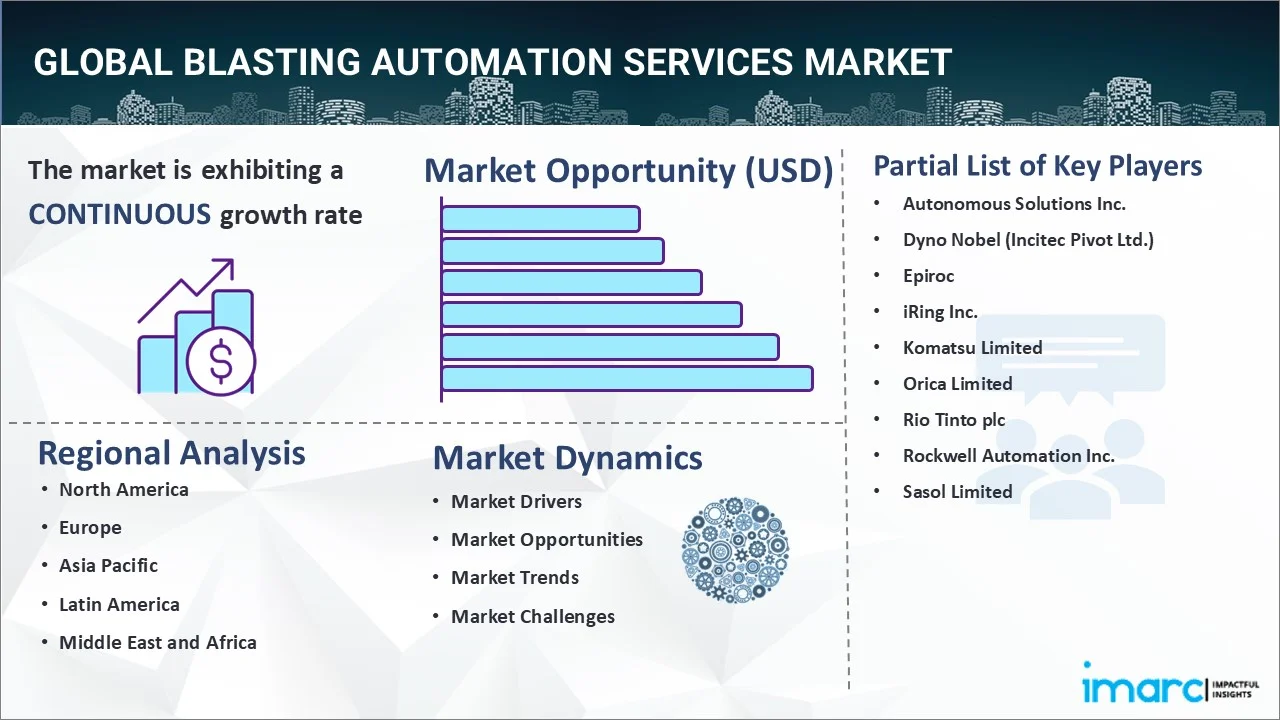
The global blasting automation services market size reached USD 879.7 Million in 2025. Looking forward, IMARC Group expects the market to reach USD 2,291.6 Million by 2034, exhibiting a growth rate (CAGR) of 10.89% during 2026-2034. The market is growing rapidly driven by recent technological advancements, growing demand for safety and regulatory compliance, rising focus on operational efficiency, increasing labor shortages, and the growing environmental concerns in mining and construction industries.
|
Report Attribute
|
Key Statistics
|
|---|---|
|
Base Year
|
2025
|
|
Forecast Years
|
2026-2034
|
|
Historical Years
|
2020-2025
|
|
Market Size in 2025
|
USD 879.7 Million |
|
Market Forecast in 2034
|
USD 2,291.6 Million |
| Market Growth Rate 2026-2034 | 10.89% |
Blasting Automation Services Market Analysis:
- Market Growth and Size: The market is witnessing stable growth, driven by increasing demand in the mining and construction industries. Furthermore, the expanding application of advanced technologies and heightened safety and efficiency requirements is supporting the market growth.
- Major Market Drivers: Key drivers influencing the market growth include technological advancements, heightened safety and regulatory compliance, operational efficiency, labor shortages, environmental concerns, and the pressing need for precision and efficiency in mining and construction operations.
- Technological Advancements: The integration of artificial intelligence (AI), machine learning (ML), and robotics, leading to more precise and safer processes, is boosting the market growth. Furthermore, continuous innovation in sensor technology and real-time data processing, which is enhancing the effectiveness and adaptability of automated blasting systems is supporting the market growth.
- Industry Applications: The market finds extensive application in metal mining, non-metal mining, and coal mining, each requiring specific automated blasting solutions.
- Key Market Trends: The key market trends involve the ongoing shift towards forming strategic partnerships and investing in research and innovation to develop more sophisticated blasting automation solutions. Additionally, the customization of services to meet specific project needs and a focus on environmental sustainability are further bolstering the market growth.
- Geographical Trends: Various regions are also showing significant growth, fueled by technological innovation, expanding mining activities, stringent safety and environmental regulations, and rapid infrastructural development activities.
- Competitive Landscape: The market is characterized by the presence of key players actively engaging in research and development (R&D), strategic partnerships, and expansion into new markets. Additionally, they are diversifying their offerings and focusing on compliance with safety and environmental standards to maintain a competitive edge.
- Challenges and Opportunities: The market faces various challenges, such as varying levels of technological adoption across regions, economic vitality, and the need to balance cost with advanced technology implementation. However, widespread service adoption to address labor shortage, enhance safety in hazardous operations, and meet environmentally responsible mining practices are creating new opportunities for the market growth.
To get more information on this market Request Sample
Blasting Automation Services Market Trends:
Recent technological advancements
The advent of cutting-edge technologies in automation, such as artificial intelligence (AI), robotics, and machine learning (ML), is a primary factor driving the market growth. These technologies enable a higher level of precision in blasting operations, which is crucial in industries like mining and construction, where accuracy is paramount. Furthermore, AI and ML algorithms can analyze vast amounts of data to predict the most effective blasting patterns, reducing the amount of explosives needed and minimizing unintended damage to surrounding areas. Additionally, the incorporation of robotics in blasting automation to enhance accuracy and increase the speed of operations is boosting the market growth. Besides this, the advancement in sensor technology and real-time data processing, which allows for immediate adjustments during operations, ensuring optimal results, is driving the market growth.
Growing demand for safety and regulatory compliance
The growing demand for safety and regulatory compliance in industries like mining and construction, where blasting is a common practice, is propelling the market growth. In line with this, automated blasting systems offer enhanced safety by minimizing human intervention in high-risk operations. They are designed to operate in hazardous conditions where manual operation would be unsafe, thereby reducing the risk of accidents and injuries. Additionally, automated systems are programmed to adhere strictly to safety protocols and regulatory standards, ensuring compliance with local and international regulations. Moreover, they can be programmed to minimize vibrations, noise, and dust emissions, which are critical environmental concerns. In addition, the widespread adoption of blasting automation services by companies to avoid costly fines and legal challenges while enhancing their reputation for safety and environmental stewardship is favoring the market growth.
Rising focus on operational efficiency
The rising focus on operational efficiency is a key factor driving the market growth. In line with this, automated blasting services enhance efficiency as they reduce the time required to set up and execute blasting operations. Furthermore, they can quickly and accurately place charges, calculate optimal blast patterns, and execute blasts with minimal human intervention. This speed and precision are essential in large-scale operations where even small delays can have cascading effects on project timelines. Additionally, automation reduces the likelihood of errors that can occur in manual operations, which not only cause delays but can also lead to additional costs due to material wastage and potential damage to the project site. Moreover, automated systems can operate continuously, unlike human-operated systems that require breaks and shift changes, which is particularly beneficial in tight project schedules.
Increasing labor shortage
Labor shortages in skilled positions, such as those required for blasting operations, are an important factor driving the market growth. It is particularly acute in remote or hazardous locations where blasting activities are often necessary. Automated blasting services offer a solution to this challenge by reducing the reliance on skilled labor. They can perform complex tasks that would otherwise require highly trained professionals. Moreover, automation can lead to significant cost reductions in the long run, as it requires less human oversight and can operate for extended periods without breaks or shift changes, leading to higher operational uptime. Additionally, the precision and efficiency of automated systems can reduce the overall cost of materials and explosives by optimizing their usage.
Escalating environmental concerns
The growing demand for sustainable and eco-friendly industrial practices, including blasting operations, due to rising environmental concerns is propelling the market growth. Automated blasting systems offer several environmental advantages over traditional manual methods. They are capable of precise explosive placements and detonation timings, which helps minimize the environmental impact of blasting operations, such as ground vibrations, noise, and dust emissions. Moreover, automated systems can be programmed to comply with environmental regulations and standards, ensuring that operations do not harm local ecosystems or violate legal requirements. Additionally, they aid in optimizing the use of materials and resources, which decreases the amount of waste produced, contributing to more sustainable operation practices.
Blasting Automation Services Industry Segmentation:
IMARC Group provides an analysis of the key trends in each segment of the market, along with forecasts at the global, regional, and country levels for 2026-2034. Our report has categorized the market based on application.
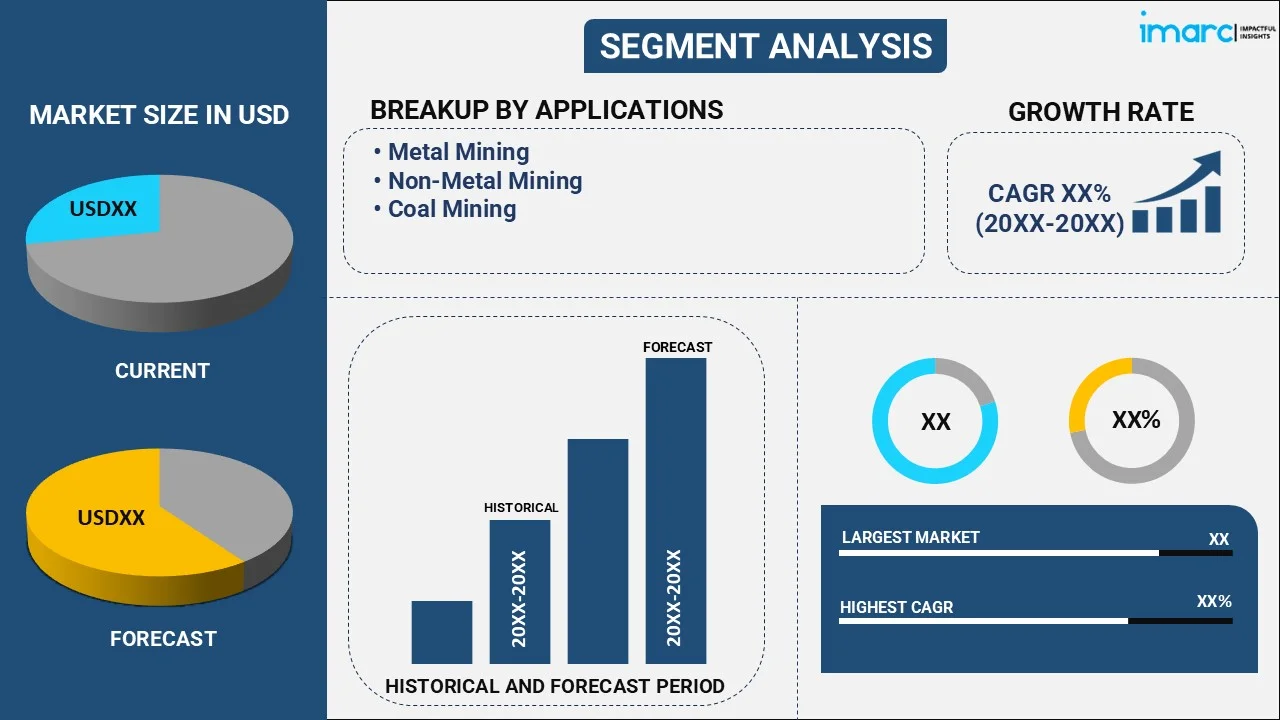
Breakup by Application:
To get detailed segment analysis of this market Request Sample
- Metal Mining
- Non-Metal Mining
- Coal Mining
Metal mining holds the largest share in the industry
The report has provided a detailed breakup and analysis of the market based on the application. This includes metal mining, non-metal mining, and coal mining. According to the report, metal mining represented the largest segment.
Metal mining segment deals with the mining of metals, such as gold, copper, iron, and aluminum, which often requires precise and controlled blasting to access and extract ore from the earth. In line with this, automated blasting systems are used to optimize the deployment of explosives, ensuring minimal ore dilution and maximum rock fragmentation efficiency. Furthermore, it reduces waste and increases the yield of valuable metals, directly impacting the profitability of mining operations.
Non-metal mining segment includes the extraction of minerals like limestone, granite, and sand. It takes place in less structured environments, such as quarries or open-pit mines. Automated blasting systems in this segment are designed to achieve uniform rock fragmentation, which is crucial for maintaining the quality of non-metallic minerals. They also help in reducing the environmental impact of blasting operations, a key concern in non-metal mining.
Blasting automation services are widely used in coal mining to ensure the efficient and safe extraction of coal. It is designed to optimize the fragmentation of coal seams, thereby maximizing coal recovery and reducing the amount of waste rock. Furthermore, it enhances safety by allowing remote operation, thereby reducing the exposure of workers to hazardous conditions.
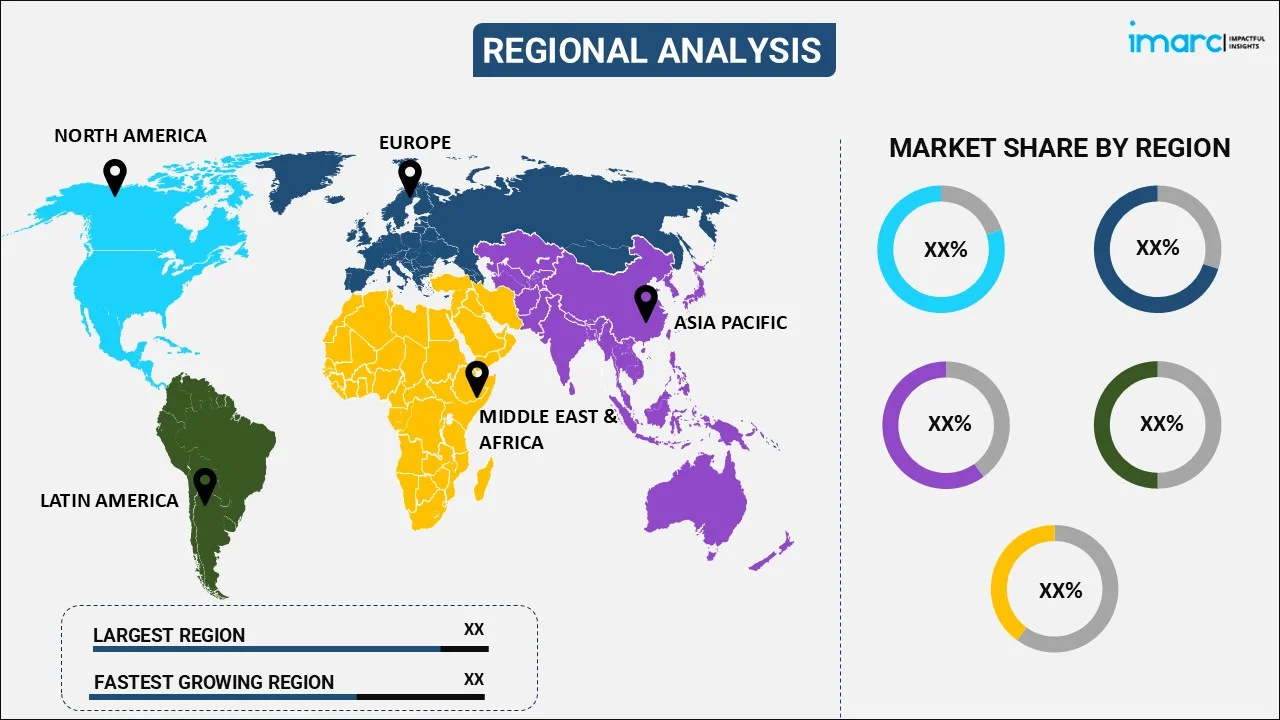
Breakup by Region:
To get more information on the regional analysis of this market Request Sample
- North America
- United States
- Canada
- Asia-Pacific
- China
- Japan
- India
- South Korea
- Australia
- Indonesia
- Others
- Europe
- Germany
- France
- United Kingdom
- Italy
- Spain
- Russia
- Others
- Latin America
- Brazil
- Mexico
- Others
- Middle East and Africa
Asia-Pacific leads the market, accounting for the largest blasting automation services market share
The market research report has also provided a comprehensive analysis of all the major regional markets, which include North America (the United States and Canada); Asia Pacific (China, Japan, India, South Korea, Australia, Indonesia, and others); Europe (Germany, France, the United Kingdom, Italy, Spain, Russia, and others); Latin America (Brazil, Mexico, and others); and the Middle East and Africa. According to the report, Asia-Pacific accounted for the largest market share.
The Asia Pacific region is rich in mineral resources and has witnessed significant investments in mining infrastructure and technology, which is driving the market growth. Additionally, the increasing demand for minerals and metals, coupled with a growing awareness of operational safety and environmental sustainability, is catalyzing the market growth.
North America has a significant number of metal and coal mining operations, which are increasingly adopting automated blasting technologies to enhance safety, efficiency, and compliance with stringent environmental regulations. Furthermore, the availability of sophisticated technological infrastructure in the region, coupled with a strong emphasis on innovation and research and development (R&D), is supporting the market growth.
The blasting automation services market in Europe is characterized by a strong focus on safety standards, environmental regulations, and technological innovation. Furthermore, the European mining sector is highly regulated and places a premium on sustainable and responsible mining practices. Additionally, European countries are leaders in technological research and development (R&D), contributing to the advancement of automation in blasting services.
Latin America is a major global supplier of metals like copper and iron ore, and the mining sector is pivotal to their economies. In line with this, the adoption of blasting automation in this region to improve operational efficiency and safety in mining operations is propelling the market growth. Besides this, the growing interest in adopting advanced technologies to remain competitive in the market is acting as another growth-inducing factor.
The Middle East and Africa (MEA) region has significant mineral resources, coupled with the ongoing development in infrastructure, which is driving the market growth. Additionally, regional countries are increasingly looking towards automation to enhance efficiency and safety in operations. Furthermore, the growing focus on large-scale construction and infrastructure projects in the region is contributing to the market growth.
Leading Key Players in the Blasting Automation Services Industry:
Key players are actively engaging in a range of strategic activities to strengthen their market position and capitalize on growing opportunities. They are investing heavily in research and development (R&D) to introduce innovative automation technologies that enhance precision, safety, and efficiency in blasting operations. Additionally, several companies are forming strategic partnerships and collaborations with technology providers and other industry stakeholders to expand their service offerings and geographic reach. Besides this, major players are focusing on customizing solutions to meet specific client needs, particularly in industries with complex or unique blasting requirements. Furthermore, market leaders are actively involved in regulatory discussions and environmental initiatives, positioning themselves as compliant and responsible industry participants.
The market research report has provided a comprehensive analysis of the competitive landscape. Detailed profiles of all major companies have also been provided. Some of the key players in the market include:
- Autonomous Solutions Inc.
- Dyno Nobel (Incitec Pivot Ltd.)
- Epiroc
- iRing Inc.
- Komatsu Limited
- Orica Limited
- Rio Tinto plc
- Rockwell Automation Inc.
- Sasol Limited
(Please note that this is only a partial list of the key players, and the complete list is provided in the report.)
Latest News:
- In December 2023, Epiroc launched a new digital solutions that includes a new safe blasting module and new release of situational awareness under Mobilaris Mining Intelligence.
- In November 2020, Orica collaborated with Epiroc to develop the first-of-its-kind industry-driven explosive delivery system.
- In March 2020, Dyno Nobel launched The EZshot detonator series with accurate electronic delay timing.
Blasting Automation Services Market Report Scope:
| Report Features | Details |
|---|---|
| Base Year of the Analysis | 2025 |
| Historical Period | 2020-2025 |
| Forecast Period | 2026-2034 |
| Units | Million USD |
| Scope of the Report | Exploration of Historical Trends and Market Outlook, Industry Catalysts and Challenges, Segment-Wise Historical and Future Market Assessment:
|
| Applications Covered | Metal Mining, Non-Metal Mining, Coal Mining |
| Regions Covered | Asia Pacific, Europe, North America, Latin America, Middle East and Africa |
| Countries Covered | United States, Canada, Germany, France, United Kingdom, Italy, Spain, Russia, China, Japan, India, South Korea, Australia, Indonesia, Brazil, Mexico |
| Companies Covered | Autonomous Solutions Inc., Dyno Nobel (Incitec Pivot Ltd.), Epiroc, iRing Inc., Komatsu Limited, Orica Limited, Rio Tinto plc, Rockwell Automation Inc., Sasol Limited, etc. |
| Customization Scope | 10% Free Customization |
| Post-Sale Analyst Support | 10-12 Weeks |
| Delivery Format | PDF and Excel through Email (We can also provide the editable version of the report in PPT/Word format on special request) |
Key Questions Answered in This Report:
- How has the global blasting automation services market performed so far, and how will it perform in the coming years?
- What are the drivers, restraints, and opportunities in the global blasting automation services market?
- What is the impact of each driver, restraint, and opportunity on the global blasting automation services market?
- What are the key regional markets?
- Which countries represent the most attractive blasting automation services market?
- What is the breakup of the market based on the application?
- Which is the most attractive application in the blasting automation services market?
- What is the competitive structure of the market?
- Who are the key players/companies in the global blasting automation services market?
Key Benefits for Stakeholders:
- IMARC’s industry report offers a comprehensive quantitative analysis of various market segments, historical and current market trends, market forecasts, and dynamics of the blasting automation services market from 2020-2034.
- The research report provides the latest information on the market drivers, challenges, and opportunities in the global blasting automation services market.
- The study maps the leading, as well as the fastest-growing, regional markets. It further enables stakeholders to identify the key country-level markets within each region.
- Porter's five forces analysis assists stakeholders in assessing the impact of new entrants, competitive rivalry, supplier power, buyer power, and the threat of substitution. It helps stakeholders to analyze the level of competition within the blasting automation services industry and its attractiveness.
- The competitive landscape allows stakeholders to understand their competitive environment and provides insight into the current positions of key players in the market.
Need more help?
- Speak to our experienced analysts for insights on the current market scenarios.
- Include additional segments and countries to customize the report as per your requirement.
- Gain an unparalleled competitive advantage in your domain by understanding how to utilize the report and positively impacting your operations and revenue.
- For further assistance, please connect with our analysts.
 Request Customization
 Speak to an Analyst
 Request Brochure
 Inquire Before Buying
Benefits of Customization
- Personalize this research
- Triangulate with your data
- Get data as per your format and definition
- Gain a deeper dive into a specific application, geography, customer, or competitor
- Any level of personalization
Get in Touch With Us
UNITED STATES
Phone: +1-201-971-6302
INDIA
Phone: +91-120-433-0800
UNITED KINGDOM
Phone: +44-753-714-6104
Email: [email protected]
Client Testimonials


.webp)


