
Boron Prices, Trend, Chart, Demand, Market Analysis, News, Historical and Forecast Data Report 2026 Edition
Boron Price Trend, Index and Forecast
Track the latest insights on boron price trend and forecast with detailed analysis of regional fluctuations and market dynamics across North America, Latin America, Central Europe, Western Europe, Eastern Europe, Middle East, North Africa, West Africa, Central and Southern Africa, Central Asia, Southeast Asia, South Asia, East Asia, and Oceania.
Boron Prices Outlook Q4 2025
- USA: USD 780/MT
- Spain: USD 578/MT
- China: USD 610/MT
- Brazil: USD 645/MT
- Turkey: USD 586/MT
Boron Price Chart

Get real-time access to monthly/quarterly/yearly prices Request Sample
During the fourth quarter of 2025, the boron prices in the USA reached 780 USD/MT in December. The upward movement in prices was primarily supported by improved downstream demand from the glass and ceramics sectors, which maintained stable procurement volumes throughout the quarter. Steady activity in the construction and insulation materials industries further strengthened buying interest. Additionally, moderated domestic inventories and balanced supply conditions allowed suppliers to sustain firmer offers.
During the fourth quarter of 2025, the boron prices in Spain reached 578 USD/MT in December. Prices recorded a marginal increase, supported by steady demand from fiberglass and agricultural micronutrient manufacturers. Regional consumption patterns remained stable, while controlled production rates prevented surplus accumulation in the domestic market. Import flows from neighboring European suppliers were consistent, reducing volatility in supply chains. Energy cost stabilization across the region supported predictable operating expenses for producers, enabling them to maintain moderate price adjustments.
During the fourth quarter of 2025, the boron prices in China reached 610 USD/MT in December. Prices declined compared to the previous quarter due to softened downstream consumption from the ceramics and electronics sectors. Slower export orders and cautious procurement strategies from buyers contributed to reduced trading activity. Elevated inventory levels at major distribution hubs exerted additional pressure on spot prices. Domestic production remained sufficient to meet demand, limiting upward price momentum.
During the fourth quarter of 2025, the boron prices in Brazil reached 645 USD/MT in December. Prices moved upward due to steady consumption in the agriculture sector, particularly for boron-based fertilizers. Infrastructure and glass manufacturing demand also provided support to domestic procurement levels. Import reliance influenced pricing, as consistent freight activity and balanced shipment volumes maintained supply stability.
During the fourth quarter of 2025, the boron prices in Turkey reached 586 USD/MT in December. The moderate increase was influenced by sustained export demand and active domestic consumption in ceramics and detergent manufacturing. Turkey’s established boron production base allowed stable output levels, yet controlled supply management prevented market oversaturation. Export-oriented shipments supported steady offtake volumes, reinforcing supplier pricing power.
Boron Prices Outlook Q3 2025
- USA: USD 740/MT
- Spain: USD 572/MT
- China: USD 635/MT
- Brazil: USD 632/MT
- Turkey: USD 575/MT
During the third quarter of 2025, the boron prices in the USA reached 740 USD/MT in September. Prices edged lower as procurement from the agriculture and advanced materials sectors softened. Softer export interest created additional downward pressure, while steady production rates kept inventories comfortable. Logistical conditions remained stable, allowing buyers to negotiate more competitive offers throughout the quarter.
During the third quarter of 2025, the boron prices in Spain reached 572 USD/MT in September. The decline in pricing reflected muted demand from the glass and ceramics industries. Market participants noted improved availability as import flows remained uninterrupted. A moderation in raw material costs also contributed to a weaker price environment, prompting distributors to adjust quotations accordingly.
During the third quarter of 2025, the boron prices in China reached 635 USD/MT in September. A notable downturn occurred as oversupply emerged from elevated production activity in key manufacturing regions. Downstream consumption, especially in electronics and specialty chemical applications, softened, reducing procurement intensity. Favorable freight conditions further contributed to downward price sentiment during the period.
During the third quarter of 2025, the boron prices in Brazil reached 632 USD/MT in September. Prices decreased as demand from the agriculture and industrial processing sectors eased. Consistent import arrivals helped maintain sufficient supply levels across major hubs. Currency-related cost adjustments and stable maritime logistics also allowed suppliers to lower offer levels across the domestic market.
During the third quarter of 2025, the boron prices in Turkey reached 575 USD/MT in September. The downward movement was driven by slower consumption across the construction materials and glass segments. Supply levels remained stable due to steady refinery output, while easing energy-linked production costs supported softer pricing. Competitive pressures among local distributors further influenced the decline.
Boron Prices Outlook Q2 2025
- USA: USD 757/MT
- Germany: USD 593/MT
- China: USD 701/MT
- Brazil: USD 684/MT
- Turkey: USD 597/MT
During the second quarter of 2025, the boron prices in the USA reached 757 USD/MT in June. As per the boron price chart, the market maintained a stable domestic supply of boron, with major producers operating at consistent levels. Demand from sectors such as agriculture, construction, and glass manufacturing remained steady, supporting a balanced market.
During the second quarter of 2025, the boron prices in Germany reached 593 USD/MT in June. Germany's boron market was significantly impacted by its reliance on imports, particularly from Turkey. Besides, the construction industry showed signs of recovery, leading to increased demand for boron in fiberglass insulation and ceramic tiles. Simultaneously, the agricultural sector maintained steady consumption of boron-based fertilizers, supporting overall market stability.
During the second quarter of 2025, boron prices in China reached 701 USD/MT in June. The boron production cost trend in China was largely stable, though slightly affected by freight fluctuations and energy pricing. These cost pressures were reflected in the pricing of boron products. Besides, environmental regulations governing mining and production, along with safety regulations for workers exposed to boron compounds, continued to impact production costs and, consequently, boron prices.
During the second quarter of 2025, the boron prices in Brazil reached 684 USD/MT in June. In Q2 2025, fluctuations in global boron production and export quotas from leading producers impacted the availability and pricing of boron imports into Brazil. These external supply factors introduced variability in local market prices. The Brazilian real's exchange rate against the US dollar played a role in boron pricing. While no dramatic price changes occurred, these elements collectively contributed to a moderately fluctuating pricing environment.
During the second quarter of 2025, the boron prices in Turkey reached 597 USD/MT in June. The construction sector, a significant consumer of boron-based products, showed signs of slowing down. Similarly, the agricultural sector faced challenges due to climate change impacts, leading to reduced demand for boron in agriculture. Turkey's strategic positioning as a major boron producer also influenced its export activities. Despite fluctuations in domestic demand, Turkish boron exports remained steady, with key destinations including Italy, Taiwan, and Germany.
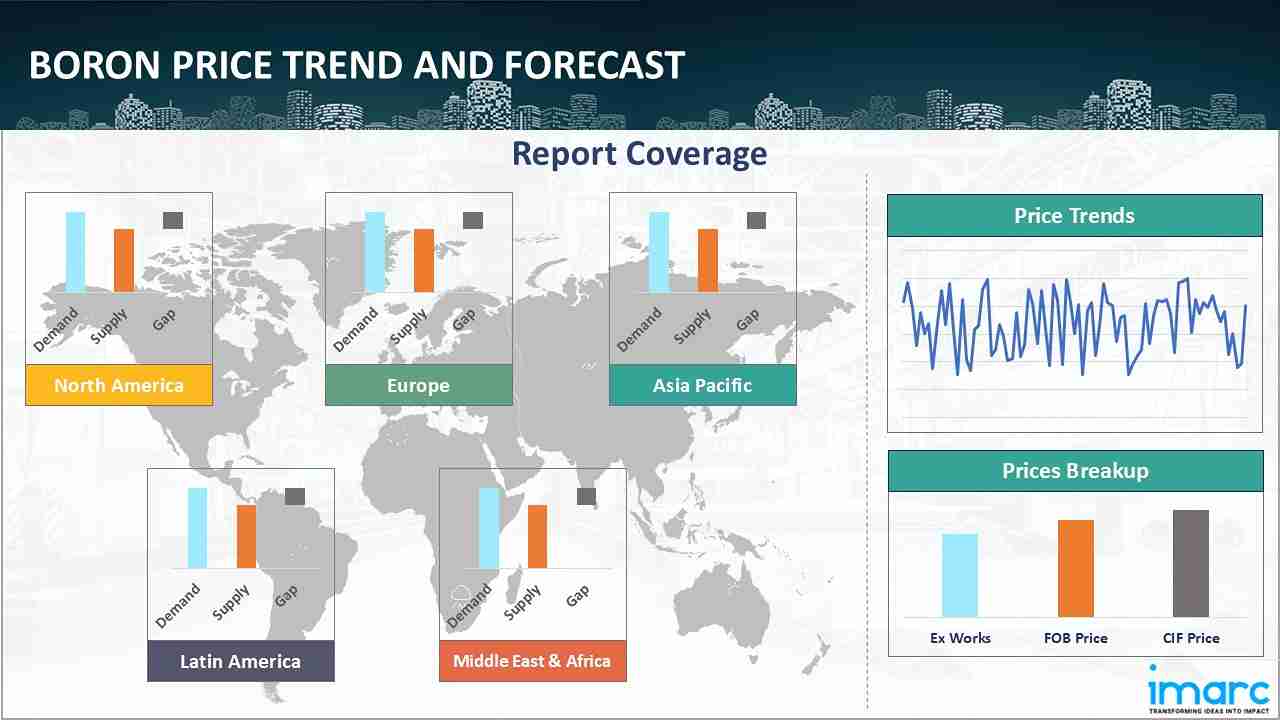
Regional Coverage
The report provides a detailed analysis of the market across different regions, each with unique pricing dynamics influenced by localized market conditions, supply chain intricacies, and geopolitical factors. This includes price trends, price forecast and supply and demand trends for each region, along with spot prices by major ports. The report also provides coverage of FOB and CIF prices, as well as the key factors influencing boron prices.
Europe Boron Price Trend
Q4 2025:
During the fourth quarter of 2025, the boron price index in Europe reflected upward trends across major markets. Demand from the construction and insulation sectors remained steady, particularly from glass wool and specialty glass manufacturers, which supported consistent procurement volumes. Industrial activity was moderated compared to earlier quarters, limiting aggressive restocking behavior among buyers. Balanced inventory positions across distribution hubs prevented excess spot availability, thereby reducing volatility in transactional prices.
Q3 2025:
As per the boron price index, Europe experienced a downward pricing environment across the quarter as regional demand cooled within the glass, ceramics, and chemical sectors. Abundant availability, supported by uninterrupted inland and maritime flows, placed pressure on sellers. Lower feedstock-related expenses and easing energy markets encouraged competitive pricing from suppliers. Procurement remained cautious as buyers anticipated continued softness, which further reinforced weakened sentiment across major consuming countries during this period.
Q2 2025:
As per the boron price index, European Union regulations promoting sustainable practices and reducing carbon emissions influenced the boron market. These policies encouraged the adoption of boron in green technologies but also introduced compliance costs for producers. Besides, the demand for boron remained steady across various sectors. The glass and ceramics industries continued to utilize boron for its thermal and chemical stability properties. Additionally, the agricultural sector maintained a consistent need for boron-based fertilizers to enhance crop yields.
This analysis can be extended to include detailed boron price information for a comprehensive list of countries.
| Region | Countries Covered |
|---|---|
| Europe | Germany, France, United Kingdom, Italy, Spain, Russia, Turkey, Netherlands, Poland, Sweden, Belgium, Austria, Ireland, Switzerland, Norway, Denmark, Romania, Finland, Czech Republic, Portugal, and Greece, among other European countries. |
North America Boron Price Trend
Q4 2025:
During the fourth quarter of 2025, the boron price index in North America showed moderate strengthening, supported by resilient downstream demand fundamentals. Fiberglass insulation manufacturers maintained steady operating rates, driven by ongoing construction and renovation activity. Procurement patterns remained consistent, with buyers adhering to structured purchasing cycles rather than opportunistic spot buying. Domestic production levels were aligned with contractual commitments, preventing surplus accumulation in warehouses.
Q3 2025:
As per the boron price index, North America observed weakening price levels as spot demand from agriculture, metallurgy, and advanced manufacturing segments moderated. Inventories remained comfortable due to stable domestic production and timely imports that helped maintain broad availability. Reduced transportation bottlenecks improved product circulation, reinforcing the downward momentum. Additionally, procurement strategies shifted toward shorter commitments, enabling buyers to capitalize on softer pricing across multiple distribution channels.
Q2 2025:
Anticipating potential supply disruptions, US buyers proactively increased their stockpiles of boron. This behavior was driven by concerns over global supply issues, including trade tensions and logistical challenges, which heightened the market sentiment. Besides, trade tensions between the US and China added uncertainty to the market. Such geopolitical factors disrupted supply chains and affect pricing dynamics, prompting buyers to secure materials in advance. These combined factors led to a significant upward trend in prices in the US during, reflecting the complex interplay of supply limitations, sustained demand, and strategic stockpiling amid global uncertainties.
Specific boron historical data within the United States and Canada can also be provided.
| Region | Countries Covered |
|---|---|
| North America | United States and Canada |
Middle East and Africa Boron Price Trend
Q4 2025:
In the Middle East and Africa, boron prices demonstrated slightly firm behavior, supported by sustained infrastructure and construction-related demand. Ongoing industrial projects across select economies contributed to consistent consumption of boron-containing materials such as glass and ceramics. Supply was maintained through structured trade flows from major producing countries, ensuring availability without creating market oversaturation. Producers and distributors implemented controlled inventory management practices, which minimized excessive stock buildup.
Q3 2025:
Demand from glass manufacturing, ceramics production, and detergent formulation sustained consistent procurement volumes throughout the period. Industrial diversification initiatives in select countries contributed to ongoing consumption of boron-based materials in specialty applications. Supply availability was managed through structured import flows from major producing nations, ensuring adequate material presence without creating surplus pressure in domestic markets. Distributors implemented disciplined inventory control strategies, which limited spot market volatility.
Q2 2025:
The report explores the boron pricing trends and boron price chart in the Middle East and Africa, considering factors like regional industrial growth, the availability of natural resources, and geopolitical tensions that uniquely influence market prices.
In addition to region-wise data, information on boron prices for countries can also be provided.
| Region | Countries Covered |
|---|---|
| Middle East and Africa | Saudi Arabia, UAE, Israel, Iran, South Africa, Nigeria, Oman, Kuwait, Qatar, Iraq, Egypt, Algeria, and Morocco, among other Middle Eastern and African countries. |
Asia Pacific Boron Price Trend
Q4 2025:
In the Asia Pacific region, boron prices experienced slight downward pressure due to moderated downstream manufacturing activity. Demand from ceramics, electronics, and specialty materials sectors softened, leading to more cautious procurement strategies among buyers. Inventory levels in certain regional markets increased as production rates earlier in the year outpaced immediate consumption needs. This elevated stock availability encouraged competitive pricing approaches among suppliers seeking to maintain market share.
Q3 2025:
In the Asia Pacific region, prices declined as elevated production levels, combined with slower demand from electronics, materials processing, and fertilizer applications, shaped a weaker market profile. Inventory buildup in key supply centers weighed on sentiment, while improving freight connectivity reduced landed costs for import-reliant countries. Additionally, cautious ordering behavior across several industries added downward pressure, contributing to broad-based softness across major markets in the region.
Q2 2025:
Boron prices in the Asia-Pacific region during Q2 2025 were shaped by a combination of strong demand in key industries, supply constraints, and regional dynamics. The market exhibited variability, with early-quarter surges followed by stabilization and mild declines. In India, the glass and ceramics industries maintained steady demand, supporting price levels. Besides, limited domestic production and logistical challenges led to supply shortages, contributing to price increases. Moreover, prices saw moderate fluctuations, influenced by the interplay of supply and demand dynamics.
This boron price analysis can be expanded to include a comprehensive list of countries within the region.
| Region | Countries Covered |
|---|---|
| Asia Pacific | China, India, Indonesia, Pakistan, Bangladesh, Japan, Philippines, Vietnam, Thailand, South Korea, Malaysia, Nepal, Taiwan, Sri Lanka, Hongkong, Singapore, Australia, and New Zealand, among other Asian countries. |
Latin America Boron Price Trend
Q4 2025:
In Latin America, boron prices trended upward driven primarily by agricultural demand for micronutrient fertilizers. Seasonal application cycles supported consistent purchasing activity, particularly in key farming economies. Infrastructure and construction projects also contributed to steady consumption of boron-based glass and related materials. The region’s reliance on imports influenced pricing dynamics, as suppliers adjusted offers in response to stable international freight conditions and structured shipment schedules.
Q3 2025:
In Latin America, boron prices weakened as industrial and agricultural demand moderated compared with earlier periods. Imports arrived on schedule, maintaining comfortable supply across key distribution hubs. Improved port operations and reduced inland transport constraints supported lower distribution costs, enabling suppliers to adjust prices downward. Many buyers adopted conservative procurement strategies amid uncertain consumption trends, extending the duration of the region’s softer pricing environment.
Q2 2025:
As per the boron price index, Peru remained the dominant producer of boron in the region. However, production levels remained relatively stable, and exports faced challenges. Mexico emerged as the leading exporter in value terms, while other countries like Brazil and Argentina showed a decline in their export volumes. This shift in export dynamics impacted regional supply and pricing. Infrastructure inefficiencies and logistical challenges, including transportation delays and customs procedures, disrupted supply chains. These issues led to short-term price volatility, as the timely delivery of boron products became uncertain, affecting both domestic markets and international trade.
This comprehensive review can be extended to include specific countries within the region.
| Region | Countries Covered |
|---|---|
| Latin America | Brazil, Mexico, Argentina, Columbia, Chile, Ecuador, and Peru, among other Latin American countries.Brazil, Mexico, Argentina, Columbia, Chile, Ecuador, and Peru, among other Latin American countries. |
Boron Pricing Report, Market Analysis, and News
IMARC's latest publication, “Boron Prices, Trend, Chart, Demand, Market Analysis, News, Historical and Forecast Data Report 2026 Edition,” presents a detailed examination of the boron market, providing insights into both global and regional trends that are shaping prices. This report delves into the spot price of boron at major ports and analyzes the composition of prices, including FOB and CIF terms. It also presents detailed boron prices trend analysis by region, covering North America, Europe, Asia Pacific, Latin America, and Middle East and Africa. The factors affecting boron pricing, such as the dynamics of supply and demand, geopolitical influences, and sector-specific developments, are thoroughly explored. This comprehensive report helps stakeholders stay informed with the latest market news, regulatory updates, and technological progress, facilitating informed strategic decision-making and forecasting.

Boron Industry Analysis
The global boron industry size reached USD 2.49 Billion in 2025. By 2034, IMARC Group expects the market to reach USD 3.49 Billion, at a projected CAGR of 3.80% during 2026-2034. Growth is supported by increasing use across the glass, agriculture, ceramics, energy materials, and electronics sectors, driven by expanding industrial production and rising reliance on boron-based performance additives globally.
Latest News and Developments:
- November 2025: 5E Advanced Materials, Inc. announced a significant resource upgrade for its Fort Cady Project, increasing measured and indicated borate (boron-containing) resources by 61% and positioning the company to expand its role in the domestic boron supply chain. The announcement underscores the growing strategic importance of boron in advanced materials and energy applications.
- October 2024: Ioneer Ltd received federal approval for its Rhyolite Ridge Lithium-Boron Project, marking the first US lithium project approved under the Biden Administration's efforts to boost domestic mineral production. The project is located in Nevada and is said to supply materials for over 370,000 EVs. Its construction is set to begin in 2025, with production expected in 2028.
Product Description
Boron, an element with the symbol B and atomic number 5, is one of the few elements that demonstrate remarkable features and find applications in a wide range of fields. It occurs mixed with other compounds in the Earth's crust and is notable for its extreme hardness, and relatively low abundance. Boron is a metalloid hence it owes its intermediate properties to both metals and non-metals. The unique aspect of this element lies in its ability to form strong covalent bonds, which in turn contributes to its high melting point and hardness. Boron has a crystalline structure, black, shiny, and hard like diamond which is the reason why it can be used in industrial fields where the material needs to be very strong and resilient. Boron is widely employed in glass and fiberglass manufacturing, as a micronutrient in agriculture fertilizers, and as a high-tech material boron carbide and boron nitride due to their hardness and thermal properties.
Report Coverage
| Key Attributes | Details |
|---|---|
| Product Name | Boron |
| Report Features | Exploration of Historical Trends and Market Outlook, Industry Demand, Industry Supply, Gap Analysis, Challenges, Boron Price Analysis, and Segment-Wise Assessment. |
| Currency/Units | US$ (Data can also be provided in local currency) or Metric Tons |
| Region/Countries Covered | The current coverage includes analysis at the global and regional levels only. Based on your requirements, we can also customize the report and provide specific information for the following countries: Asia Pacific: China, India, Indonesia, Pakistan, Bangladesh, Japan, Philippines, Vietnam, Thailand, South Korea, Malaysia, Nepal, Taiwan, Sri Lanka, Hongkong, Singapore, Australia, and New Zealand* Europe: Germany, France, United Kingdom, Italy, Spain, Russia, Turkey, Netherlands, Poland, Sweden, Belgium, Austria, Ireland, Switzerland, Norway, Denmark, Romania, Finland, Czech Republic, Portugal and Greece* North America: United States and Canada Latin America: Brazil, Mexico, Argentina, Columbia, Chile, Ecuador, and Peru* Middle East & Africa: Saudi Arabia, UAE, Israel, Iran, South Africa, Nigeria, Oman, Kuwait, Qatar, Iraq, Egypt, Algeria, and Morocco* *The list of countries presented is not exhaustive. Information on additional countries can be provided if required by the client. |
| Information Covered for Key Suppliers |
|
| Customization Scope | The report can be customized as per the requirements of the customer |
| Report Price and Purchase Option |
Plan A: Monthly Updates - Annual Subscription
Plan B: Quarterly Updates - Annual Subscription
Plan C: Biannually Updates - Annual Subscription
|
| Post-Sale Analyst Support | 360-degree analyst support after report delivery |
| Delivery Format | PDF and Excel through email (We can also provide the editable version of the report in PPT/Word format on special request) |
Key Benefits for Stakeholders:
- IMARC’s report presents a detailed analysis of boron pricing, covering global and regional trends, spot prices at key ports, and a breakdown of FOB and CIF prices.
- The study examines factors affecting boron price trend, including input costs, supply-demand shifts, and geopolitical impacts, offering insights for informed decision-making.
- The competitive landscape review equips stakeholders with crucial insights into the latest market news, regulatory changes, and technological advancements, ensuring a well-rounded, strategic overview for forecasting and planning.
- IMARC offers various subscription options, including monthly, quarterly, and biannual updates, allowing clients to stay informed with the latest market trends, ongoing developments, and comprehensive market insights. The boron price charts ensure our clients remain at the forefront of the industry.
Need more help?
- Speak to our experienced analysts for insights on the current market scenarios.
- Include additional segments and countries to customize the report as per your requirement.
- Gain an unparalleled competitive advantage in your domain by understanding how to utilize the report and positively impacting your operations and revenue.
- For further assistance, please connect with our analysts.
 Request Customization
 Inquire Before Buying
 Speak to an Analyst
 Request Brochure
Benefits of Customization
- Personalize this research
- Triangulate with your data
- Get data as per your format and definition
- Gain a deeper dive into a specific application, geography, customer, or competitor
- Any level of personalization
Get in Touch With Us
UNITED STATES
Phone: +1-201-971-6302
INDIA
Phone: +91-120-433-0800
UNITED KINGDOM
Phone: +44-753-714-6104
Email: [email protected]
Client Testimonials


.webp)


Why Choose Us
IMARC offers trustworthy, data-centric insights into commodity pricing and evolving market trends, enabling businesses to make well-informed decisions in areas such as procurement, strategic planning, and investments. With in-depth knowledge spanning more than 1000 commodities and a vast global presence in over 150 countries, we provide tailored, actionable intelligence designed to meet the specific needs of diverse industries and markets.
1000
+Commodities
150
+Countries Covered
3000
+Clients
20
+Industry
Robust Methodologies & Extensive Resources
IMARC delivers precise commodity pricing insights using proven methodologies and a wealth of data to support strategic decision-making.
Subscription-Based Databases
Our extensive databases provide detailed commodity pricing, import-export trade statistics, and shipment-level tracking for comprehensive market analysis.
Primary Research-Driven Insights
Through direct supplier surveys and expert interviews, we gather real-time market data to enhance pricing accuracy and trend forecasting.
Extensive Secondary Research
We analyze industry reports, trade publications, and market studies to offer tailored intelligence and actionable commodity market insights.
Trusted by 3000+ industry leaders worldwide to drive data-backed decisions. From global manufacturers to government agencies, our clients rely on us for accurate pricing, deep market intelligence, and forward-looking insights.