
Brazil Children’s Entertainment Centers Market Size, Share, Trends and Forecast by Visitor Demographics, Facility Size, Revenue Source, Activity Area, and Region, 2026-2034
Brazil Children’s Entertainment Centers Market Overview:
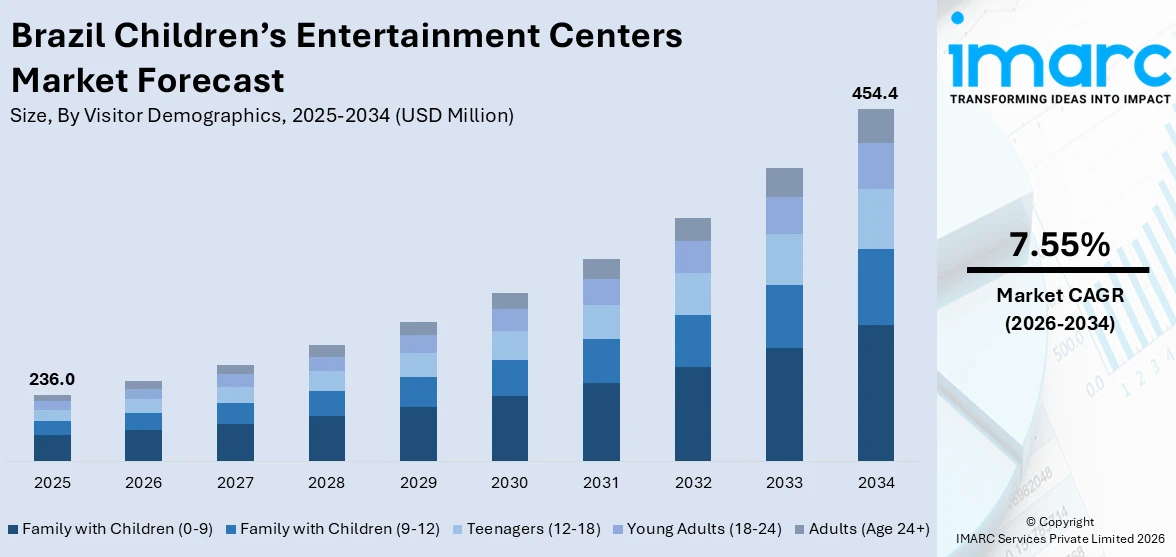
The Brazil children’s entertainment centers market size reached USD 236.0 Million in 2025. Looking forward, IMARC Group expects the market to reach USD 454.4 Million by 2034, exhibiting a growth rate (CAGR) of 7.55% during 2026-2034. Growing disposable income, urbanization, and demand for indoor leisure options are some of the factors contributing to the Brazil children’s entertainment centers market share. Parents seek safe, engaging spaces for children. Shopping malls integrating play zones boost footfall. Franchising models and investment in themed entertainment further expand business opportunities across Brazil’s metropolitan and mid-tier cities.
|
Report Attribute
|
Key Statistics
|
|---|---|
|
Base Year
|
2025
|
|
Forecast Years
|
2026-2034
|
|
Historical Years
|
2020-2025
|
| Market Size in 2025 | USD 236.0 Million |
| Market Forecast in 2034 | USD 454.4 Million |
| Market Growth Rate 2026-2034 | 7.55% |
Brazil Children’s Entertainment Centers Market Trends:
Tech-Driven Play Experiences Drawing in Repeat Visits
Children’s entertainment centers across Brazil are seeing higher retention rates owing to gamified digital systems and RFID-enabled interactive zones. Operators are integrating mobile apps for parents to track points, reward milestones, and schedule visits, which encourages recurring engagement. The mix of physical activity with responsive tech, like projection-based games and motion-sensor challenges, has become a strong draw in urban malls. In São Paulo and Rio, several mid-tier centers have adopted hybrid digital-physical game stations where kids compete or collaborate in real time. This trend is especially popular with families looking for alternatives to passive screen time. Parents view these spaces as safe, semi-educational environments, while children remain engaged longer due to customizable difficulty levels and reward systems. It is not just the novelty; it is the measurable return visits and longer stay durations that are validating these investments. These factors are intensifying the Brazil children’s entertainment centers market growth.
To get more information on this market Request Sample
Local Cultural Themes Replacing Generic Global Concepts
Instead of copying Western-style jungle gyms or arcade models, many Brazilian operators are turning to local traditions, folklore, and nature motifs to create more relatable spaces. Themes based on the Amazon rainforest, Festa Junina, and characters from regional stories are taking over décor, mascots, and even event programming. In the northeast, centers with maracatu-themed shows and native storytelling corners are seeing strong uptake from schools looking for educational field trip tie-ins. These locally rooted spaces are also more appealing to parents who want their children to feel a cultural connection, not just amusement. It’s a noticeable shift from a few years ago when international branding dominated. Now, there's more collaboration with local artists, designers, and educators to build environments that reflect Brazilian identity. These efforts also improve brand loyalty; families are more likely to return to a center that reflects their values and culture. This shift is especially visible in tier-2 cities, where community-centric businesses tend to thrive over franchise-heavy competitors.
Brazil Children’s Entertainment Centers Market Segmentation:
IMARC Group provides an analysis of the key trends in each segment of the market, along with forecasts at the country and regional levels for 2026-2034. Our report has categorized the market based on visitor demographics, facility size, revenue source, and activity area.
Visitor Demographics Insights:
- Family with Children (0-9)
- Family with Children (9-12)
- Teenagers (12-18)
- Young Adults (18-24)
- Adults (Age 24+)
The report has provided a detailed breakup and analysis of the market based on the visitor demographics. This includes family with children (0-9), family with children (9-12), teenagers (12-18), young adults (18-24), and adults (age 24+).
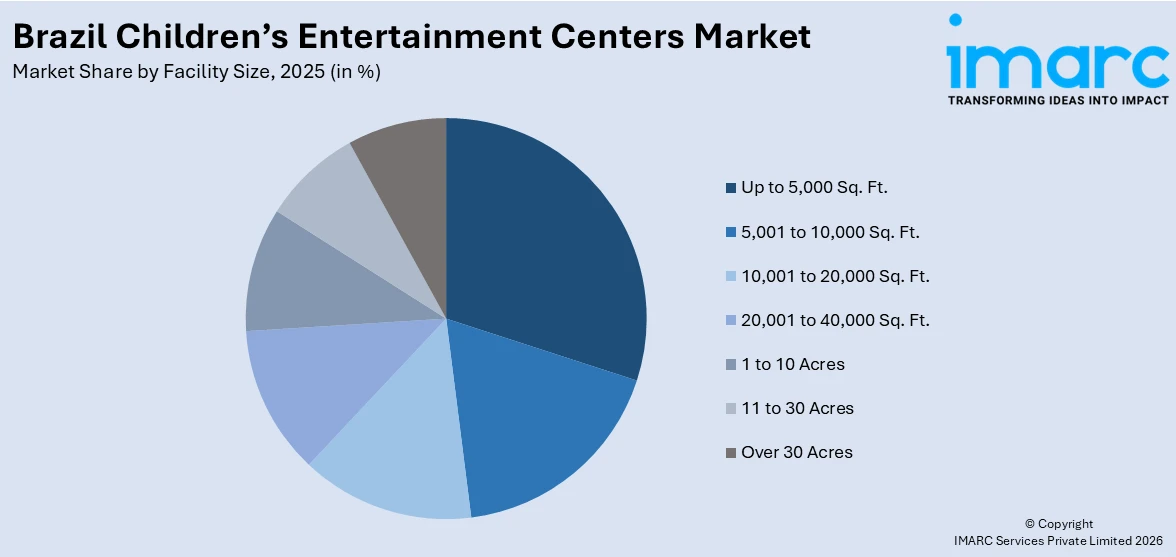
Facility Size Insights:
Access the comprehensive market breakdown Request Sample
- Up to 5,000 Sq. Ft.
- 5,001 to 10,000 Sq. Ft.
- 10,001 to 20,000 Sq. Ft.
- 20,001 to 40,000 Sq. Ft.
- 1 to 10 Acres
- 11 to 30 Acres
- Over 30 Acres
The report has provided a detailed breakup and analysis of the market based on the facility size. This includes up to 5,000 sq. ft., 5,001 to 10,000 sq. ft., 10,001 to 20,000 sq. ft., 20,001 to 40,000 sq. ft., 1 to 10 acres, 11 to 30 acres, and over 30 acres.
Revenue Source Insights:
- Entry Fees and Ticket Sales
- Food and Beverages
- Merchandising
- Advertising
- Others
The report has provided a detailed breakup and analysis of the market based on the revenue source. This includes entry fees and ticket sales, food and beverages, merchandising, advertising, and others.
Activity Area Insights:
- Arcade Studios
- AR and VR Gaming Zone
- Physical Play Activities
- Skill/Competition Games
- Others
A detailed breakup and analysis of the market based on the activity area have also been provided in the report. This includes arcade studios, AR and VR gaming zone, physical play activities, skill/competition games, and others.
Regional Insights:
- Southeast
- South
- Northeast
- North
- Central-West
The report has also provided a comprehensive analysis of all the major regional markets, which include Southeast, South, Northeast, North, and Central-West.
Competitive Landscape:
The market research report has also provided a comprehensive analysis of the competitive landscape. Competitive analysis such as market structure, key player positioning, top winning strategies, competitive dashboard, and company evaluation quadrant has been covered in the report. Also, detailed profiles of all major companies have been provided.
Brazil Children’s Entertainment Centers Market Report Coverage:
| Report Features | Details |
|---|---|
| Base Year of the Analysis | 2025 |
| Historical Period | 2020-2025 |
| Forecast Period | 2026-2034 |
| Units | Million USD |
| Scope of the Report |
Exploration of Historical Trends and Market Outlook, Industry Catalysts and Challenges, Segment-Wise Historical and Future Market Assessment:
|
| Visitor Demographics Covered | Family with Children (0-9), Family with Children (9-12), Teenagers (12-18), Young Adults (18-24), Adults (Age 24+) |
| Facility Sizes Covered | Up to 5,000 Sq. Ft., 5,001 to 10,000 Sq. Ft., 10,001 to 20,000 Sq. Ft., 20,001 to 40,000 Sq. Ft., 1 to 10 Acres, 11 to 30 Acres, Over 30 Acres |
| Revenue Sources Covered | Entry Fees and Ticket Sales, Food and Beverages, Merchandising, Advertising, Others |
| Activity Areas Covered | Arcade Studios, AR and VR Gaming Zone, Physical Play Activities, Skill/Competition Games, Others |
| Regions Covered | Southeast, South, Northeast, North, Central-West |
| Customization Scope | 10% Free Customization |
| Post-Sale Analyst Support | 10-12 Weeks |
| Delivery Format | PDF and Excel through Email (We can also provide the editable version of the report in PPT/Word format on special request) |
Key Questions Answered in This Report:
- How has the Brazil children’s entertainment centers market performed so far and how will it perform in the coming years?
- What is the breakup of the Brazil children’s entertainment centers market on the basis of visitor demographics?
- What is the breakup of the Brazil children’s entertainment centers market on the basis of facility size?
- What is the breakup of the Brazil children’s entertainment centers market on the basis of revenue source?
- What is the breakup of the Brazil children’s entertainment centers market on the basis of activity area?
- What is the breakup of the Brazil children’s entertainment centers market on the basis of region?
- What are the various stages in the value chain of the Brazil children’s entertainment centers market?
- What are the key driving factors and challenges in the Brazil children’s entertainment centers market?
- What is the structure of the Brazil children’s entertainment centers market and who are the key players?
- What is the degree of competition in the Brazil children’s entertainment centers market?
Key Benefits for Stakeholders:
- IMARC’s industry report offers a comprehensive quantitative analysis of various market segments, historical and current market trends, market forecasts, and dynamics of the Brazil children’s entertainment centers market from 2020-2034.
- The research report provides the latest information on the market drivers, challenges, and opportunities in the Brazil children’s entertainment centers market.
- Porter's five forces analysis assist stakeholders in assessing the impact of new entrants, competitive rivalry, supplier power, buyer power, and the threat of substitution. It helps stakeholders to analyze the level of competition within the Brazil children’s entertainment centers industry and its attractiveness.
- Competitive landscape allows stakeholders to understand their competitive environment and provides an insight into the current positions of key players in the market.
Need more help?
- Speak to our experienced analysts for insights on the current market scenarios.
- Include additional segments and countries to customize the report as per your requirement.
- Gain an unparalleled competitive advantage in your domain by understanding how to utilize the report and positively impacting your operations and revenue.
- For further assistance, please connect with our analysts.
 Request Customization
 Speak to an Analyst
 Request Brochure
 Inquire Before Buying
Benefits of Customization
- Personalize this research
- Triangulate with your data
- Get data as per your format and definition
- Gain a deeper dive into a specific application, geography, customer, or competitor
- Any level of personalization
Get in Touch With Us
UNITED STATES
Phone: +1-201-971-6302
INDIA
Phone: +91-120-433-0800
UNITED KINGDOM
Phone: +44-753-714-6104
Email: [email protected]
Client Testimonials


.webp)


