
Brazil Virtual Power Plants Market Size, Share, Trends and Forecast by Technology, Source, End User, and Region, 2026-2034
Brazil Virtual Power Plants Market Overview:
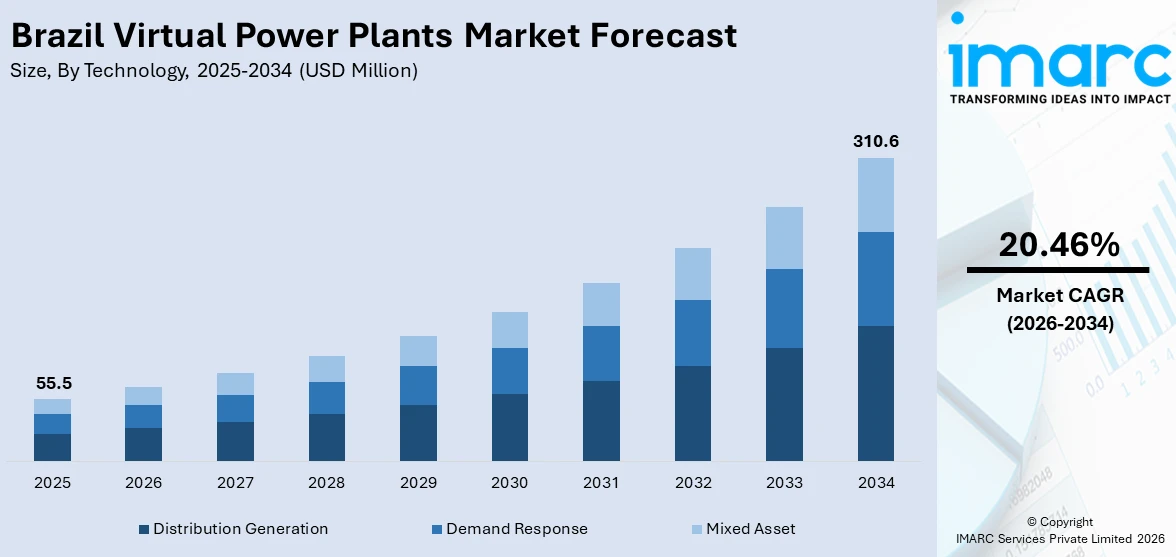
The Brazil virtual power plants market size reached USD 55.5 Million in 2025. The market is projected to reach USD 310.6 Million by 2034, exhibiting a growth rate (CAGR) of 20.46% during 2026-2034. The market is driven by government-led policy framework development and market opening for VPP deployment, rapid growth in energy storage infrastructure and battery system integration, and expansion of distributed generation and prosumer participation in demand response. These factors are collectively enhancing grid flexibility, enabling better integration of intermittent renewable energy sources, and creating new revenue streams for energy consumers while improving overall system reliability. Additionally, the growing significance of decentralized energy resources and smart grid technologies is expanding the Brazil virtual power plants market share.
|
Report Attribute
|
Key Statistics
|
|---|---|
|
Base Year
|
2025
|
|
Forecast Years
|
2026-2034
|
|
Historical Years
|
2020-2025
|
| Market Size in 2025 | USD 55.5 Million |
| Market Forecast in 2034 | USD 310.6 Million |
| Market Growth Rate 2026-2034 | 20.46% |
Brazil Virtual Power Plants Market Trends:
Integration of Renewable Energy Sources
In Brazil, virtual power plants (VPPs) are increasingly combining a variety of renewable energy assets, including solar installations, wind turbines, and small hydropower units, to form a unified energy network. By aggregating these distributed energy resources, VPPs can enhance generation scheduling, balance supply fluctuations, and boost overall grid efficiency. This approach allows for more effective use of renewable capacity, decreases reliance on fossil fuels, and aligns with the nation's sustainability objectives. Additionally, it promotes decentralized energy management, enabling smaller producers to engage in energy markets and contribute to grid stability. The combination of various renewable sources also supports improved forecasting and real-time energy dispatch, ensuring reliable energy access for industrial, commercial, and residential users while aiding Brazil's shift toward a cleaner and more resilient energy framework.
To get more information on this market Request Sample
Advanced Energy Management Systems
The implementation of advanced energy management systems (EMS) is revolutionizing the operations of virtual power plants in Brazil. Organizations are utilizing AI algorithms, IoT devices, and cloud-based solutions to track energy production, forecast consumption patterns, and dynamically balance supply and demand. These systems allow for real-time optimization of distributed energy resources, minimizing waste and improving operational efficiency. Predictive analytics are employed to foresee variations in renewable energy generation linked to weather changes, while automated dispatch guarantees timely energy supply to the grid. By integrating smart metering, data analytics, and remote control capabilities, operators can achieve accurate load balancing, reduce operational expenses, and increase revenue from energy trading. These technological innovations are propelling Brazil virtual power plants market growth and advancing the development of more reliable, intelligent, and flexible energy management approaches.
Grid Flexibility and Peak Load Management
Virtual power plants are essential in enhancing grid flexibility and managing peak electricity demand throughout Brazil. By coordinating distributed energy resources, VPPs can swiftly respond to changes in demand, helping to prevent overloading and potential blackouts. During spikes in consumption, energy stored in batteries or generated from renewable sources can be delivered to maintain grid stability and reliability. This decentralized approach alleviates pressure on traditional power plants, decreases operational costs, and boosts overall energy efficiency. Furthermore, VPPs facilitate demand response initiatives, allowing consumers and industries to modify their usage based on grid signals. By fostering a more adaptable and robust energy network, virtual power plants contribute to a stable, sustainable electricity supply while supporting the integration of a growing amount of renewable energy into Brazil’s power infrastructure.
Brazil Virtual Power Plants Market Segmentation:
IMARC Group provides an analysis of the key trends in each segment of the market, along with forecasts at the country and regional levels for 2026-2034. Our report has categorized the market based on technology, source, and end user.
Technology Insights:
- Distribution Generation
- Demand Response
- Mixed Asset
The report has provided a detailed breakup and analysis of the market based on the technology. This includes distribution generation, demand response, and mixed asset.
Source Insights:
- Renewable Energy
- Cogeneration
- Energy Storage
A detailed breakup and analysis of the market based on the source have also been provided in the report. This includes renewable energy, cogeneration, and energy storage.
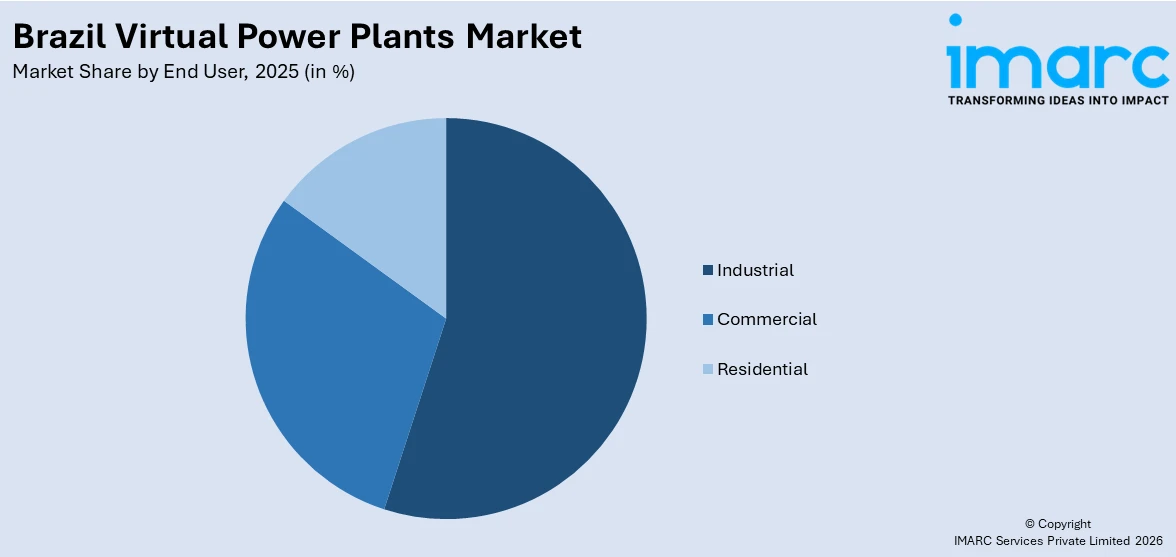
End User Insights:
Access the comprehensive market breakdown Request Sample
- Industrial
- Commercial
- Residential
The report has provided a detailed breakup and analysis of the market based on the end user. This includes industrial, commercial, and residential.
Regional Insights:
- Southeast
- South
- Northeast
- North
- Central-West
The report has also provided a comprehensive analysis of all the major regional markets, which include Southeast, South, Northeast, North, and Central-West.
Competitive Landscape:
The market research report has also provided a comprehensive analysis of the competitive landscape. Competitive analysis such as market structure, key player positioning, top winning strategies, competitive dashboard, and company evaluation quadrant has been covered in the report. Also, detailed profiles of all major companies have been provided.
Brazil Virtual Power Plants Market Report Coverage:
| Report Features | Details |
|---|---|
| Base Year of the Analysis | 2025 |
| Historical Period | 2020-2025 |
| Forecast Period | 2026-2034 |
| Units | Million USD |
| Scope of the Report |
Exploration of Historical Trends and Market Outlook, Industry Catalysts and Challenges, Segment-Wise Historical and Future Market Assessment:
|
| Technologies Covered | Distribution Generation, Demand Response, Mixed Asset |
| Sources Covered | Renewable Energy, Cogeneration, Energy Storage |
| End Users Covered | Industrial, Commercial, Residential |
| Regions Covered | Southeast, South, Northeast, North, Central-West |
| Customization Scope | 10% Free Customization |
| Post-Sale Analyst Support | 10-12 Weeks |
| Delivery Format | PDF and Excel through Email (We can also provide the editable version of the report in PPT/Word format on special request) |
Key Questions Answered in This Report:
- How has the Brazil virtual power plants market performed so far and how will it perform in the coming years?
- What is the breakup of the Brazil virtual power plants market on the basis of technology?
- What is the breakup of the Brazil virtual power plants market on the basis of source?
- What is the breakup of the Brazil virtual power plants market on the basis of end user?
- What is the breakup of the Brazil virtual power plants market on the basis of region?
- What are the various stages in the value chain of the Brazil virtual power plants market?
- What are the key driving factors and challenges in the Brazil virtual power plants market?
- What is the structure of the Brazil virtual power plants market and who are the key players?
- What is the degree of competition in the Brazil virtual power plants market?
Key Benefits for Stakeholders:
- IMARC’s industry report offers a comprehensive quantitative analysis of various market segments, historical and current market trends, market forecasts, and dynamics of the Brazil virtual power plants market from 2020-2034.
- The research report provides the latest information on the market drivers, challenges, and opportunities in the Brazil virtual power plants market.
- Porter's five forces analysis assist stakeholders in assessing the impact of new entrants, competitive rivalry, supplier power, buyer power, and the threat of substitution. It helps stakeholders to analyze the level of competition within the Brazil virtual power plants industry and its attractiveness.
- Competitive landscape allows stakeholders to understand their competitive environment and provides an insight into the current positions of key players in the market.
Need more help?
- Speak to our experienced analysts for insights on the current market scenarios.
- Include additional segments and countries to customize the report as per your requirement.
- Gain an unparalleled competitive advantage in your domain by understanding how to utilize the report and positively impacting your operations and revenue.
- For further assistance, please connect with our analysts.
 Request Customization
 Speak to an Analyst
 Request Brochure
 Inquire Before Buying
Benefits of Customization
- Personalize this research
- Triangulate with your data
- Get data as per your format and definition
- Gain a deeper dive into a specific application, geography, customer, or competitor
- Any level of personalization
Get in Touch With Us
UNITED STATES
Phone: +1-201-971-6302
INDIA
Phone: +91-120-433-0800
UNITED KINGDOM
Phone: +44-753-714-6104
Email: [email protected]
Client Testimonials


.webp)


