
Bronze Prices, Trend, Chart, Demand, Market Analysis, News, Historical and Forecast Data Report 2026 Edition
Bronze Price Trend, Index and Forecast
Track real-time and historical bronze prices across global regions. Updated monthly with market insights, drivers, and forecasts.
Bronze Prices May 2026
| Region | Price (USD/KG) | Latest Movement |
|---|---|---|
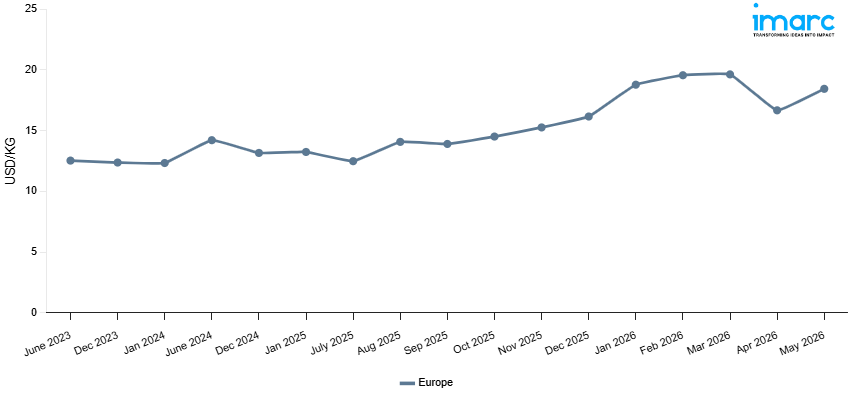
| Europe | 18.44 | 10.6% ↑ Up |
Bronze Price Index (USD/KG):
The chart below highlights monthly bronze prices across different regions.
Get Access to Monthly/Quarterly/Yearly Prices, Request Sample
Market Overview Q1 Ending March 2026
Europe: The bronze prices in Europe reached 19.63 USD/KG in March 2026. The upward pricing movement registered between December and March 2026 was 21.5%. The engineering, marine hardware, and industrial machinery production sectors experienced high demand, which led to substantial bronze purchasing and firmly bullish price trends in the European market. The rising costs of upstream copper and tin inputs within regional production units escalated manufacturing costs and sustained upward pressure on European market prices. Insufficient import shipments from critical supply zones created a shortage within the European bronze supply environment and heightened competition between downstream engineering and marine hardware buyers. Industrial manufacturers and distributors who were stocking ahead of expected shortages contributed to increased purchasing interest and maintained the upward price trend.
Market Overview Q4 Ending December 2025
Europe: The bronze prices in Europe reached 16.16 USD/KG in December 2025. The upward pricing movement registered between September and December 2025 was 16.2%. This increased trend was reinforced by robust demand from the machinery, automotive parts, and industrial equipment sectors, as purchasing activity remained consistent throughout the quarter. The cost of producing bronze-based components increased overall due to rising prices of essential raw materials, especially copper and tin. In order to account for increased input costs, suppliers changed their selling prices. The market supply remained adequate despite the price increase, enabling trade operations to proceed without significant interruptions. To support continuous production operations and inventory needs, industrial purchasers continued to make constant purchases. The market momentum was maintained by regular order placements and steady consumption from downstream industries, which contributed to the high pricing environment.
Market Overview Q3 Ending September 2025
Europe: In Europe, bronze prices declined slightly as weaker demand from the construction and industrial machinery sectors moderated procurement. The bronze price index reflected subdued activity in automotive components and electrical applications, with buyers showing caution amid fluctuating raw material costs. Adequate availability of copper and tin feedstocks ensured stable production, while lower export activity added to downward price pressures. Despite resilient demand from certain decorative and architectural uses, overall momentum was insufficient to prevent a minor decline in prices this quarter.
Bronze Price Trend, Market Analysis, and News
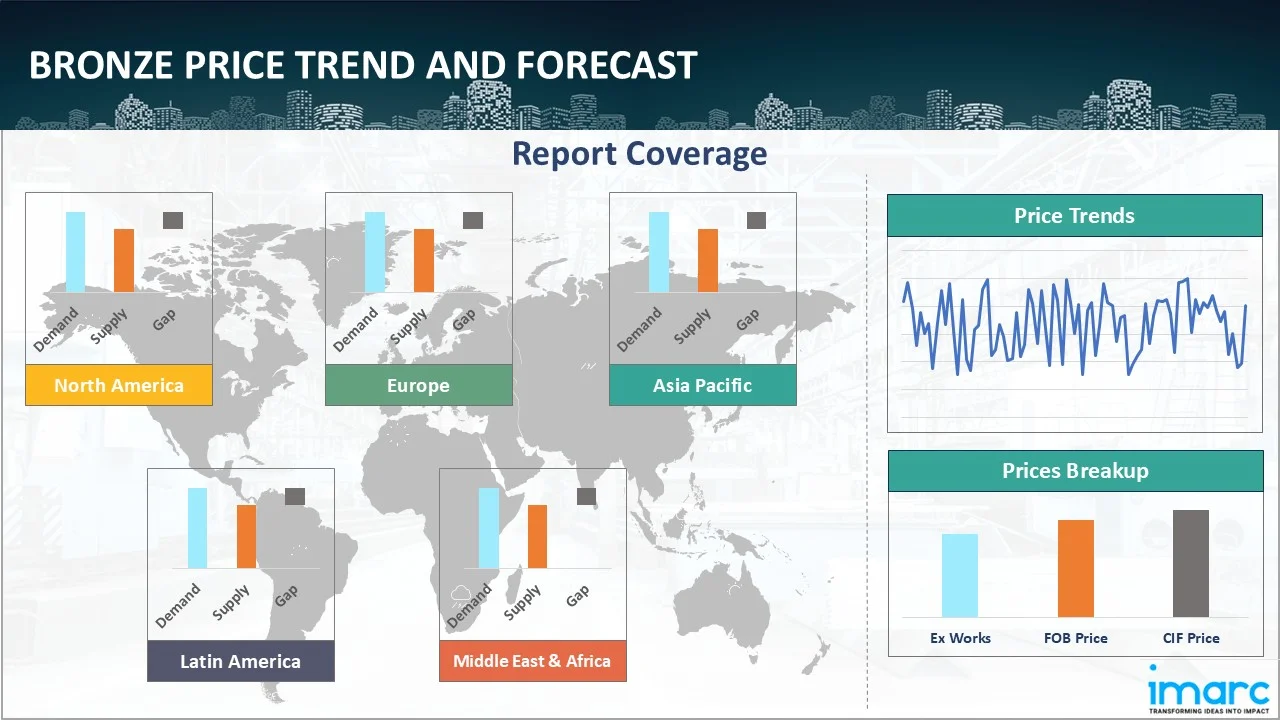
IMARC's latest publication, “Bronze Prices, Trend, Chart, Demand, Market Analysis, News, Historical and Forecast Data Report 2026 Edition,” presents a detailed examination of the bronze market, providing insights into both global and regional trends that are shaping prices. This report delves into the spot price of bronze at major ports and analyzes the composition of prices, including FOB and CIF terms. It also presents detailed bronze prices trend analysis by region, covering North America, Europe, Asia Pacific, Latin America, and Middle East and Africa. The factors affecting bronze pricing, such as the dynamics of supply and demand, geopolitical influences, and sector-specific developments, are thoroughly explored. This comprehensive report helps stakeholders stay informed with the latest market news, regulatory updates, and technological progress, facilitating informed strategic decision-making and forecasting.
Bronze Industry Analysis
The global bronze industry size reached USD 10.95 Billion in 2025. By 2034, IMARC Group expects the market to reach USD 16.21 Billion, at a projected CAGR of 4.45% during 2026-2034. The market is driven by the rising demand from construction, automotive, and marine industries, bronze’s durability, corrosion resistance, and conductivity, and the growing use in electrical components, renewable energy systems, and decorative applications.
Latest developments in the Bronze Industry:
- March 2025: Lebronze Alloys (LBA) strengthened its bronze portfolio in 2025 through two strategic acquisitions. The company acquired Allied Copper Alloys Ltd (ACA), a UK-based service center specializing in high-performance copper and bronze alloys, and AW Fraser Ltd, a renowned New Zealand alloy producer recognized for its precision manufacturing of bronze products.
- October 2024: Germany-based Wieland Group acquired Morgan Bronze Products, a 77-year-old U.S. manufacturer specializing in precision-machined bronze components like bushings and bearings. This move aimed to bolster Wieland's manufacturing capabilities and expand its engineered products business, particularly in North America.
Product Description
Bronze is a metal alloy primarily composed of copper, typically combined with tin, though other elements such as aluminum, phosphorus, manganese, and silicon may also be added to enhance specific properties. Known for its distinctive reddish-brown hue and historical significance, bronze is one of the earliest alloys developed by human civilizations, dating back to the Bronze Age around 3300 BCE. The addition of tin or other metals increases bronze’s hardness, strength, and resistance to corrosion, making it more durable than pure copper.
This versatile alloy exhibits excellent casting properties, making it ideal for producing intricate shapes in art, coins, tools, and machinery parts. Bronze is widely used in industrial applications, including bushings, bearings, valves, and pump components, due to its low metal-on-metal friction. Additionally, it plays a crucial role in marine engineering because of its resistance to seawater corrosion. In the arts, bronze is favored for sculptures and decorative works due to its aesthetic appeal and patina-forming properties.
Report Coverage
| Key Attributes | Details |
|---|---|
| Product Name | Bronze |
| Report Features | Exploration of Historical Trends and Market Outlook, Industry Demand, Industry Supply, Gap Analysis, Challenges, Ammonia Price Analysis, and Segment-Wise Assessment. |
| Currency/Units | US$ (Data can also be provided in local currency) or Metric Tons |
| Region/Countries Covered | The current coverage includes analysis at the global and regional levels only. Based on your requirements, we can also customize the report and provide specific information for the following countries: Asia Pacific: China, India, Indonesia, Pakistan, Bangladesh, Japan, Philippines, Vietnam, Thailand, South Korea, Malaysia, Nepal, Taiwan, Sri Lanka, Hongkong, Singapore, Australia, and New Zealand Europe: Germany, France, United Kingdom, Italy, Spain, Russia, Turkey, Netherlands, Poland, Sweden, Belgium, Austria, Ireland, Switzerland, Norway, Denmark, Romania, Finland, Czech Republic, Portugal and Greece North America: United States and Canada Middle East & Africa: Saudi Arabia, UAE, Israel, Iran, South Africa, Nigeria, Oman, Kuwait, Qatar, Iraq, Egypt, Algeria, and Morocco Latin America: Brazil, Mexico, Argentina, Columbia, Chile, Ecuador, Peru The list of countries presented is not exhaustive. Information on additional countries can be provided if required by the client. |
| Information Covered for Key Suppliers |
|
| Customization Scope | The report can be customized as per the requirements of the customer |
| Report Price and Purchase Option |
Plan A: Monthly Updates - Annual Subscription
Plan B: Quarterly Updates - Annual Subscription
Plan C: Biannually Updates - Annual Subscription
|
| Post-Sale Analyst Support | 360-degree analyst support after report delivery |
| Delivery Format | PDF and Excel through email (We can also provide the editable version of the report in PPT/Word format on special request) |
Key Benefits for Stakeholders:
- IMARC’s report presents a detailed analysis of bronze pricing, covering global and regional trends, spot prices at key ports, and a breakdown of FOB and CIF prices.
- The study examines factors affecting bronze price trend, including input costs, supply-demand shifts, and geopolitical impacts, offering insights for informed decision-making.
- The competitive landscape review equips stakeholders with crucial insights into the latest market news, regulatory changes, and technological advancements, ensuring a well-rounded, strategic overview for forecasting and planning.
- IMARC offers various subscription options, including monthly, quarterly, and biannual updates, allowing clients to stay informed with the latest market trends, ongoing developments, and comprehensive market insights. The bronze price charts ensure our clients remain at the forefront of the industry.
Frequently Asked Questions About the Bronze Price Index Report
The bronze price in May 2026 was 18.44 USD/Kg in Europe.
The bronze pricing data is updated on a monthly basis.
We provide the pricing data primarily in the form of an Excel sheet and a PDF.
Yes, our report includes a forecast for bronze prices.
The regions covered include North America, Europe, Asia Pacific, Middle East, and Latin America. Countries can be customized based on the request (additional charges may be applicable).
Yes, we provide both FOB and CIF prices in our report.
Need more help?
- Speak to our experienced analysts for insights on the current market scenarios.
- Include additional segments and countries to customize the report as per your requirement.
- Gain an unparalleled competitive advantage in your domain by understanding how to utilize the report and positively impacting your operations and revenue.
- For further assistance, please connect with our analysts.
 Request Customization
 Inquire Before Buying
 Speak to an Analyst
 Request Brochure
Benefits of Customization
- Personalize this research
- Triangulate with your data
- Get data as per your format and definition
- Gain a deeper dive into a specific application, geography, customer, or competitor
- Any level of personalization
Get in Touch With Us
UNITED STATES
Phone: +1-201-971-6302
INDIA
Phone: +91-120-433-0800
UNITED KINGDOM
Phone: +44-753-714-6104
Email: [email protected]
Client Testimonials


.webp)


Why Choose Us
IMARC offers trustworthy, data-centric insights into commodity pricing and evolving market trends, enabling businesses to make well-informed decisions in areas such as procurement, strategic planning, and investments. With in-depth knowledge spanning more than 1000 commodities and a vast global presence in over 150 countries, we provide tailored, actionable intelligence designed to meet the specific needs of diverse industries and markets.
1000
+Commodities
150
+Countries Covered
3000
+Clients
20
+Industry
Robust Methodologies & Extensive Resources
IMARC delivers precise commodity pricing insights using proven methodologies and a wealth of data to support strategic decision-making.
Subscription-Based Databases
Our extensive databases provide detailed commodity pricing, import-export trade statistics, and shipment-level tracking for comprehensive market analysis.
Primary Research-Driven Insights
Through direct supplier surveys and expert interviews, we gather real-time market data to enhance pricing accuracy and trend forecasting.
Extensive Secondary Research
We analyze industry reports, trade publications, and market studies to offer tailored intelligence and actionable commodity market insights.
Trusted by 3000+ industry leaders worldwide to drive data-backed decisions. From global manufacturers to government agencies, our clients rely on us for accurate pricing, deep market intelligence, and forward-looking insights.