
Busbar Market Report by Power Rating (High, Medium, Low), Conductor (Copper, Aluminium), End-User (Industrial, Commercial, Residential, Utilities), Industry (Chemicals and Petroleum, Metals and Mining, Manufacturing, and Others), and Region 2026-2034
Global Busbar Market:
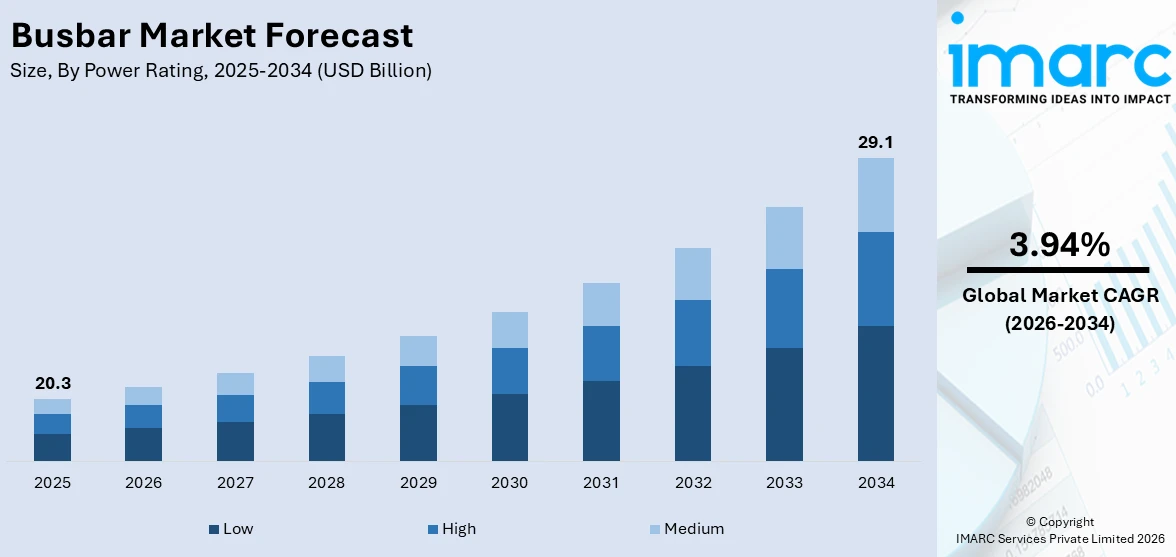
The global busbar market size reached USD 20.3 Billion in 2025. Looking forward, IMARC Group expects the market to reach USD 29.1 Billion by 2034, exhibiting a growth rate (CAGR) of 3.94% during 2026-2034. The rising infrastructure development projects, along with the escalating demand for energy-efficient solutions, are propelling the market.
|
Report Attribute
|
Key Statistics
|
|---|---|
|
Base Year
|
2025 |
|
Forecast Years
|
2026-2034 |
|
Historical Years
|
2020-2025
|
|
Market Size in 2025
|
USD 20.3 Billion |
|
Market Forecast in 2034
|
USD 29.1 Billion |
|
Market Growth Rate 2026-2034
|
3.94% |
Busbar Market Analysis:
- Major Market Drivers: The elevating need for efficient power transmission and distribution systems is one of the primary drivers augmenting the market. Additionally, extensive electricity requirements in several sectors, such as commercial, residential, and industrial, will continue to propel the overall growth of the market in the coming years.
- Key Market Trends: The rising trend of using energy-efficient solutions is stimulating the global market. Besides this, the increasing adoption of busbars for applications, including data centers, power substations, transportation infrastructures, etc., are also acting as significant growth-inducing factors.
- Geographical Trends: Asia Pacific exhibits a clear dominance in the market, owing to the expanding construction sector. Moreover, continuous advancements in electrical infrastructures that make busbars crucial for transmitting electricity effectively are further positively influencing the regional market.
- Competitive Landscape: Some of the prominent players across the global market include Siemens AG, ABB Group, Schneider Electric SE, Eaton Corporation, Inc., Legrand Pvt Ltd., General Electric Company, Mersen Corporate Services SAS, Rittal GmbH & Co. KG, CHINT Group Corporation, Power Products Unlimited, LLC, C&S Electric Ltd., Promet AG, ElvalHalcor SA, Littelfuse, Inc., Southwire Company, LLC, and Oriental Copper Co. Ltd., among many others.
- Challenges and Opportunities: Choosing the right materials for busbars is important to ensure efficiency, performance, and durability. Besides this, fluctuations in material prices and availability, as well as the need for materials with specific electrical and mechanical properties, pose challenges to manufacturers. However, according to the busbar market overview, technological innovations and operational efficiency are projected to fuel the market in the coming years.
To get more information on this market Request Sample
Busbar Market Trends:
Widespread Applications in EVs
With the increasing demand for electric vehicles, busbars are gaining extensive traction among manufacturers as an ideal solution to improve conduction in these vehicles. Moreover, busbars have revolutionized the EV landscape and are integrated inside panel boards, switchgears, and busway enclosures for local high current power distribution. For example, Heju Stamping, one of the professional OEM stamping manufacturers, offers busbars in the electric vehicle industry. Besides this, as power systems have become more complex and faster, the challenges to efficiently integrate busbars in tight-spaced power distribution systems (PDU), battery packs, or battery management systems (BMS) have become increasingly relevant. This, in turn, is stimulating the requirement for greater flexibility in the production of both large and small-footprint busbar interconnection. Raychem RPG produces flexible and multi-layered busbar assemblies meeting the exact requirements of electric vehicles. Additionally, busbars exhibit various advantages in EVs, such as the ability to relocate or add power easily without any downtime, minimal routine maintenance, environmentally friendly, faster, and less costly for expansion or remodeling, etc. This, in turn, is catalyzing the busbar market demand among manufacturers across the globe. For instance, in October 2023, Freudenberg Sealing Technologies developed an impermeable rectangular busbar over mold that aids in preventing damage to an electric vehicle's power electronics. In line with this, in September 2023, Interplex, one of the manufacturers of interconnect and mechanical products, displayed its motor stator busbars for EVs at the Battery Show in Novi, Michigan. Furthermore, with the implementation of busbars in EVs, a solid and sensitive joining procedure, such as ultrasonic welding technology, is needed to ensure conductivity. However, conventional ultrasonic welding usually operates on a pneumatic cylinder, which can have some inconsistencies. Consequently, TECH-SONIC developed a state-of-the-art ultrasonic joining process called CLC or closed-loop control.
Need for Power Distribution Systems
The increasing levels of industrialization are driving the need for reliable and efficient power distribution systems, thereby acting as a significant growth-inducing factor. Busbars play an important role in switchgear systems, serving as the backbone for power management. Within switchgear, they are adopted to connect numerous electrical components, such as transformers, circuit breakers, disconnect switches, etc., to form a unified electrical network. For instance, in April 2024, Signal Hound, one of the manufacturers of precision test equipment, announced the addition of the RFS44 to its expanding product line. Similarly, in April 2024, Schneider Electric, a prominent player in the digital transformation of next-generation automation and energy management, announced the introduction of its new EasySet MV air-insulated indoor switchgear. This sustainable and innovative switchgear offers ease of operation and maintenance to meet electrical distribution needs, which, in turn, is bolstering the busbar market revenue. Furthermore, the introduction of modern switchgear designs by key players is also stimulating the use of busbars that enable seamless power distribution, thereby making them indispensable components. For example, in April 2024, Pickering Interfaces, a leading provider of modular simulation and signal-switching products for electronic testing and verification, introduced high-density PXIe and PXI multiplexer (MUX) modules for high-voltage applications. Apart from this, continuous improvements in the industrial sector are also propelling the adoption of electric busways. These busways utilize busbars as the primary means of distributing electrical power within industrial facilities, buildings, and other large installations. In addition, they consist of conductive metal bars that are generally made of aluminum or copper and designed to carry high-current electricity safely and efficiently. Consequently, the development of novel track busway systems will continue to propel the market over the forecasted period. For instance, in April 2024, Legrand stated that its track busway system is an efficient and flexible alternative to traditional power distribution systems that lack flexibility in adapting to changes.
Regulatory and Safety Standards
Government bodies in various countries are implementing stringent rules in the manufacturing, design, and installation of busbars to ensure the reliability and safety of electrical systems. Numerous standards organizations, including the National Electrical Manufacturers Association (NEMA), the International Electrotechnical Commission (IEC), the American National Standards Institute (ANSI), etc., establish requirements and guidelines for busbar materials, dimensions, and performance. Compliance with these standards assists in mitigating risks, such as overheating, electrical fires, and equipment failure. Besides this, manufacturers, designers, and installers are staying updated, owing to evolving standards and codes, to uphold safety and quality in busbar applications across various industries. This, in turn, is augmenting the busbar market outlook.
Busbar Market Segmentation:
IMARC Group provides an analysis of the key trends in each segment of the market, along with the busbar market forecast at the global and regional levels for 2026-2034. Our report has categorized the market based on the power rating, conductor, end-user, and industry.
Breakup by Power Rating:
- High
- Medium
- Low
Low dominates the market
The report has provided a detailed breakup and analysis of the market based on the power rating. This includes high, medium, and low. According to the report, low represented the largest segment.
The increasing lower power transmission requirements primarily drive the growth in this segmentation. Moreover, low power rating busbars are usually easy to install, compact in size, cost-effective, etc. They are specifically designed to distribute power and handle lower electrical loads within confined spaces efficiently. Besides this, they are often made of aluminum, copper, or laminated materials. Additionally, the inflating popularity of smart automation systems that require low-voltage power supply represents the busbar market's recent opportunities. For example, in January 2021, Tai Sin launched its low-voltage busbar trunking system that finds extensive applications in data centers. Similarly, ABB introduced Neogear, a low-voltage switchgear. The device deploys ABB's laminated bus plate technology, which replaces traditional vertical and horizontal busbar systems.
Breakup by Conductor:
Access the comprehensive market breakdown Request Sample
- Copper
- Aluminium
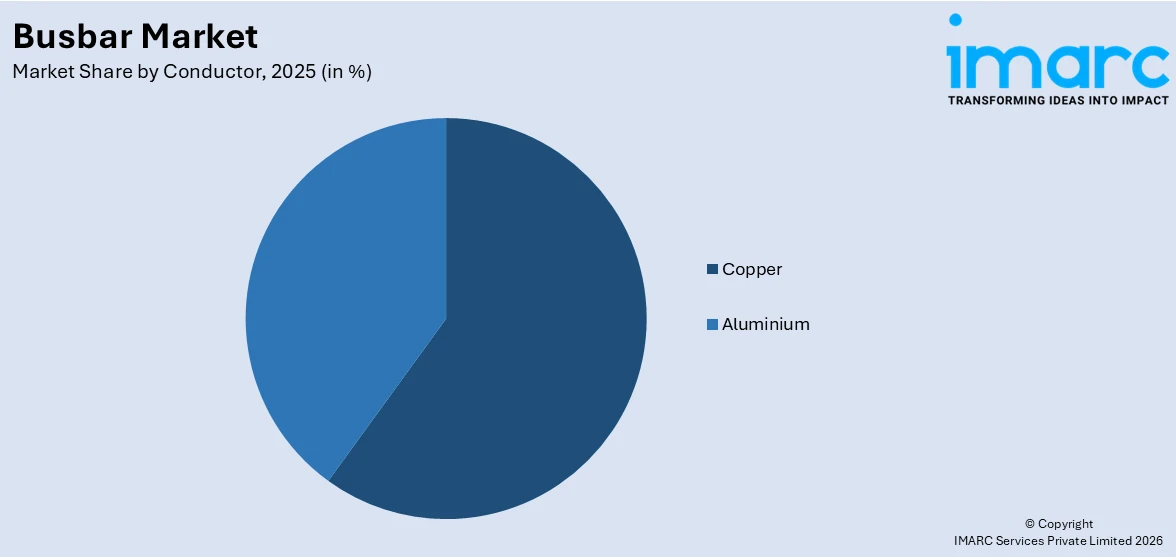
Copper holds the largest share in the market
The report has provided a detailed breakup and analysis of the market based on the conductor. This includes copper and aluminium. According to the report, copper represented the largest segment.
The rising usage of conductive materials, such as copper, owing to its excellent electrical conductivity, is one of the primary factors propelling the market in this segmentation. The low resistivity of busbars made of copper allows for efficient power transmission, thereby reducing energy losses and voltage drops. Consequently, key players, including CUBIC, EMS, Bahra Enclosures, etc., offer flexible copper busbars that are highly durable and can withstand high temperatures, which, in turn, is stimulating the busbar market's recent price.
Breakup by End-User:
- Industrial
- Commercial
- Residential
- Utilities
Utilities hold the largest share in the market
The report has provided a detailed breakup and analysis of the market based on the end user. This includes industrial, commercial, residential, and utilities. According to the report, utilities represented the largest segment.
Utilities rely on busbars to distribute and transmit electrical power from generation sources. These busbars are generally installed in substations and transmission networks to handle high voltages and currents. They play an important role in maintaining an efficient and stable power supply across a wide area, contributing to the overall reliability of the utility grid. As per the busbar market statistics, the growing investments in higher-capacity transmission grids will continue to propel the market in this segmentation over the forecasted period. For instance, in April 2024, Sterlite Power, one of the power transmission developers, concluded a successful fiscal (FY24) by securing the orders of high-performance conductors, which accounted for Rs 2,500 Crore for its Global Products and Services (GPS) business unit in Q4.

Breakup by Industry:
- Chemicals and Petroleum
- Metals and Mining
- Manufacturing
- Others
Chemicals and petroleum hold the largest share in the market
The report has provided a detailed breakup and analysis of the market based on the industry. This includes chemicals and petroleum, metals and mining, manufacturing, and others. According to the report, chemicals and petroleum represented the largest market segment.
The chemicals and petroleum industry generally relies on efficient power distribution systems for their operations. Furthermore, the industry often deals with flammable and hazardous materials, making electrical safety a top priority. Consequently, busbars are gaining extensive traction in the chemical and petroleum industry, as they offer enhanced safety features, including arc flash protection and fault current limiting, reducing the risk of electrical accidents. For example, in February 2023, SIEMENS launched the SIVACON 8PS - LI system, a busbar trunking system, to transmit energy data safely and reliably with plug-and-play functionality.
Breakup by Region:
- Asia Pacific
- North America
- Europe
- Middle East and Africa
- Latin America
Asia pacific exhibits a clear dominance, accounting for the largest busbar market share
The market research report has also provided a comprehensive analysis of all the major regional markets, which include Asia Pacific, North America, Europe, Middle East and Africa, and Latin America. According to the report, Asia pacific accounted for the largest market share.
The escalating demand for electric vehicles in countries, including China, across APAC is augmenting the adoption of EV components, such as busbars. For example, in April 2023, Shell EV Charging Solutions B.V. (Shell) and B.V. formed a strategic cooperation agreement to provide customers with membership access to 275,000 charging points via the Shell roaming network. Moreover, the rising focus among key players on using renewable sources such as wind, solar, and hydroelectric systems is also acting as another significant growth-inducing factor. Besides this, the elevating installations of rooftop solar panels require distribution mechanisms like busbars. For instance, in April 2024, Bluebird Solar, one of the ALMM-listed PV module manufacturers based in India, launched N-Type TOPCon dual glass bifacial solar PV modules for increased energy generation. As individuals across the region are transitioning to a more sustainable energy mix, the demand for busbars in renewable energy installations is expected to grow significantly. For example, Ørsted has inaugurated the Greater Changhua 1 and 2a offshore wind farms in Taiwan. With a total installed capacity of 900 MW, the two offshore wind farms are fully connected to the grid, making them the largest of their kind in the Asia-Pacific region.
Competitive Landscape:
The global busbar market is highly competitive, with several key players vying for market share. They focus on strategies, such as product innovation, mergers and acquisitions, collaborations, and partnerships, to strengthen their market presence and gain a competitive edge. The market also features several regional and local players that cater to specific geographic markets or niche segments. These players often emphasize customization, cost-effectiveness, and local market knowledge to gain a competitive advantage. In addition to established busbar market companies, the busbar market also witnesses the entry of new players, especially in emerging economies, driven by the growing demand for energy infrastructure. The competitive landscape is characterized by continuous innovation and product development, focusing on factors such as higher efficiency, improved safety features, and enhanced environmental sustainability. As the market evolves, competition intensifies, prompting companies to invest in research and development to stay ahead in the global busbar market.
The market research report has provided a comprehensive analysis of the competitive landscape. Detailed profiles of all major companies have also been provided. Some of the key players in the market include:
- Siemens AG
- ABB Group
- Schneider Electric SE
- Eaton Corporation, Inc.
- Legrand Pvt Ltd.
- General Electric Company
- Mersen Corporate Services SAS
- Rittal GmbH & Co. KG
- CHINT Group Corporation
- Power Products Unlimited, LLC
- C&S Electric Ltd.
- Promet AG
- ElvalHalcor SA
- Littelfuse, Inc.
- Southwire Company, LLC
- Oriental Copper Co. Ltd.
(Please note that this is only a partial list of the key players, and the complete list is provided in the report.)
Busbar Market Recent Developments:
- April 2024: Referro Systems, an authorised distributor of Rockwell automation products in South Africa, launched the Cubic range of Cu-Flex flexible copper busbars.
- March 2024: ABB introduced its new range of modular protection devices, FlexLine, to provide faster, easier, and more flexible installation in residential and small commercial buildings. The FlexLine series covers residual current devices (RCDs), miniature circuit breakers (MCBs), and arc fault detection devices (AFDDs), all designed with push-in technology so they can be flexibly combined on one single busbar type.
- February 2024: Vertiv elevated the capacity of its busway, switchgear, and integrated modular solutions (IMS) business by more than 100% since acquiring the PowerBar Gulf and E&I Engineering switchgear, busway, and IMS business in 2021. The company projects to increase its capacity with expansions through the end of 2025.
- February 2024: A group of researchers led by the Centre for Energy, Environmental and Technological Research (CIEMAT) in Spain developed a set of techniques to repair ribbon busbar interruptions in photovoltaic panels.
Busbar Market Report Scope:
| Report Features | Details |
|---|---|
| Base Year of the Analysis | 2025 |
| Historical Period | 2020-2025 |
| Forecast Period | 2026-2034 |
| Units | Billion USD |
| Scope of the Report | Exploration of Historical and Forecast Trends, Industry Catalysts and Challenges, Segment-Wise Historical and Predictive Market Assessment:
|
| Power Ratings Covered | High, Medium, Low |
| Conductors Covered | Copper, Aluminium |
| End-Users Covered | Industrial, Commercial, Residential, Utilities |
| Industries Covered | Chemicals and Petroleum, Metals and Mining, Manufacturing, Others |
| Regions Covered | Asia Pacific, Europe, North America, Latin America, Middle East and Africa |
| Companies Covered | Siemens AG, ABB Group, Schneider Electric SE, Eaton Corporation, Inc., Legrand Pvt Ltd., General Electric Company, Mersen Corporate Services SAS, Rittal GmbH & Co. KG, CHINT Group Corporation, Power Products Unlimited, LLC, C&S Electric Ltd., Promet AG, ElvalHalcor SA, Littelfuse, Inc., Southwire Company, LLC, Oriental Copper Co. Ltd. etc. |
| Customization Scope | 10% Free Customization |
| Post-Sale Analyst Support | 10-12 Weeks |
| Delivery Format | PDF and Excel through Email (We can also provide the editable version of the report in PPT/Word format on special request) |
Key Benefits for Stakeholders:
- IMARC's report offers a comprehensive quantitative analysis of various market segments, historical and current market trends, market forecasts, and dynamics of the busbar market from 2020-2034.
- The research study provides the latest information on the market drivers, challenges, and opportunities in the global busbar market.
- The study maps the leading, as well as the fastest-growing, regional markets.
- Porter's five forces analysis assists stakeholders in assessing the impact of new entrants, competitive rivalry, supplier power, buyer power, and the threat of substitution. It helps stakeholders to analyze the level of competition within the busbar industry and its attractiveness.
- The competitive landscape allows stakeholders to understand their competitive environment and provides an insight into the current positions of key players in the market.
Frequently Asked Questions About the Busbar Market Report
The global busbar market was valued at USD 20.3 Billion in 2025.
We expect the global busbar market to exhibit a CAGR of 3.94% during 2026-2034.
The rising demand for uninterrupted and reliable power supply across the residential, commercial, and industrial sectors is primarily driving the global busbar market growth
The sudden outbreak of the COVID-19 pandemic had led to the implementation of stringent lockdown regulations across several nations resulting in the temporary halt in numerous construction activities for new power infrastructures, thereby limiting the demand for busbar.
Based on the power rating, the global busbar market has been segmented into high, medium, and low. Currently, low power rated busbar accounts for the majority of the total market share.
Based on the conductor, the global busbar market can be categorized into copper and aluminum, where copper currently exhibits a clear dominance in the market.
Based on the end-user, the global busbar market has been divided into industrial, commercial, residential, and utilities. Currently, utilities segment holds the majority of the global market share.
Based on the industry, the global busbar market can be bifurcated into chemicals and petroleum, metals and mining, manufacturing, and others. Among these, the chemicals and petroleum sector currently accounts for the largest market share.
On a regional level, the market has been classified into Asia Pacific, North America, Europe, Middle East and Africa, and Latin America, where Asia Pacific currently dominates the global market.
Some of the major players in the global busbar market include Siemens AG, ABB Group, Schneider Electric SE, Eaton Corporation, Inc., Legrand Pvt Ltd., General Electric Company, Mersen Corporate Services SAS, Rittal GmbH & Co. KG, CHINT Group Corporation, Power Products Unlimited, LLC, C&S Electric Ltd., Promet AG, ElvalHalcor SA, Littelfuse, Inc., Southwire Company, LLC, and Oriental Copper Co. Ltd.
Need more help?
- Speak to our experienced analysts for insights on the current market scenarios.
- Include additional segments and countries to customize the report as per your requirement.
- Gain an unparalleled competitive advantage in your domain by understanding how to utilize the report and positively impacting your operations and revenue.
- For further assistance, please connect with our analysts.
 Request Customization
 Speak to an Analyst
 Request Brochure
 Inquire Before Buying
Benefits of Customization
- Personalize this research
- Triangulate with your data
- Get data as per your format and definition
- Gain a deeper dive into a specific application, geography, customer, or competitor
- Any level of personalization
Get in Touch With Us
UNITED STATES
Phone: +1-201-971-6302
INDIA
Phone: +91-120-433-0800
UNITED KINGDOM
Phone: +44-753-714-6104
Email: [email protected]
Client Testimonials


.webp)


