Canada Children’s Entertainment Centers Market Size, Share, Trends and Forecast by Visitor Demographics, Facility Size, Revenue Source, Activity Area, and Region, 2025-2033
Canada Children’s Entertainment Centers Market Overview:
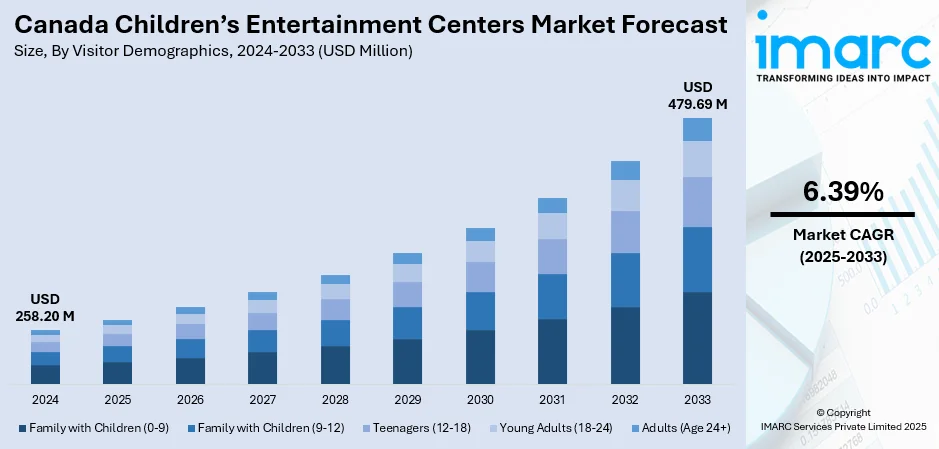
The Canada children’s entertainment centers market size reached USD 258.20 Million in 2024. Looking forward, IMARC Group expects the market to reach USD 479.69 Million by 2033, exhibiting a growth rate (CAGR) of 6.39% during 2025-2033. Rising urban populations, dual-income households seeking leisure activities, indoor climate-controlled environments, demand for edutainment, franchising growth, birthday party hosting, themed play areas, safety-conscious design, mall integrations, and increasing spending on children's recreational experiences are some of the factors contributing to the Canada children’s entertainment centers market share.
|
Report Attribute
|
Key Statistics
|
|---|---|
|
Base Year
|
2024
|
|
Forecast Years
|
2025-2033
|
|
Historical Years
|
2019-2024
|
| Market Size in 2024 | USD 258.20 Million |
| Market Forecast in 2033 | USD 479.69 Million |
| Market Growth Rate 2025-2033 | 6.39% |
Canada Children’s Entertainment Centers Market Trends:
Localized Edutainment Experiences Gaining Ground
Across Canada, children’s entertainment centers are moving beyond pure amusement toward hands-on, localized learning experiences. Operators are collaborating with local artists, indigenous educators, and community groups to create spaces that teach regional culture, nature, and history in fun, interactive ways. Museums and indoor play zones are increasingly adopting this model, integrating storytelling corners, bilingual exhibits (especially English-French), and activities rooted in local heritage. This is particularly evident in areas like Quebec and British Columbia, where cultural identity is a strong part of the local curriculum. These hybrid spaces attract both parents who want value beyond screen-time distraction and schools looking for meaningful outings. Franchises that previously stuck to standard playbooks are now experimenting with themed installations that rotate based on season or civic events. This shift not only brings in repeat visits but also aligns with growing parental preferences for educational play. Even traditional arcade-focused centers are starting to include mini-labs or maker spaces for science-themed weekends, reflecting this broader interest in blending fun with learning. These factors are intensifying the Canada children’s entertainment centers market growth.

To get more information on this market, Request Sample
Private Playpods and Micro-Parties Redefining the Market
Children’s entertainment centers in Canada are seeing a shift toward privacy-driven, customizable experiences. Instead of large, open play zones packed with multiple parties, there’s rising demand for smaller, private “playpods” that offer families exclusive access for set durations. Parents, especially in urban areas like Toronto and Vancouver, are booking boutique-style playrooms with curated decor, music, and themed activities, ranging from dinosaur digs to princess picnics. This model appeals to concerns about overstimulation, safety, and crowding. It also caters to a growing trend: Instagram-worthy birthdays with unique setups and high attention to detail. Many of these spaces operate on advance-only reservations, offer premium snacks or allergy-sensitive menus, and provide staff-led activities to reduce parental stress. Instead of chasing volume, operators are leaning into higher-margin personalized service. Some even offer mobile setups where the entire party theme is delivered to the customer’s home or rented hall. It’s a notable departure from the loud, all-access play centers that dominated the 2000s.
Canada Children’s Entertainment Centers Market Segmentation:
IMARC Group provides an analysis of the key trends in each segment of the market, along with forecasts at the country and regional levels for 2025-2033. Our report has categorized the market based on visitor demographics, facility size, revenue source, and activity area.
Visitor Demographics Insights:
- Family with Children (0-9)
- Family with Children (9-12)
- Teenagers (12-18)
- Young Adults (18-24)
- Adults (Age 24+)
The report has provided a detailed breakup and analysis of the market based on the visitor demographics. This includes family with children (0-9), family with children (9-12), teenagers (12-18), young adults (18-24), and adults (age 24+).
Facility Size Insights:

- Up to 5,000 Sq. Ft.
- 5,001 to 10,000 Sq. Ft.
- 10,001 to 20,000 Sq. Ft.
- 20,001 to 40,000 Sq. Ft.
- 1 to 10 Acres
- 11 to 30 Acres
- Over 30 Acres
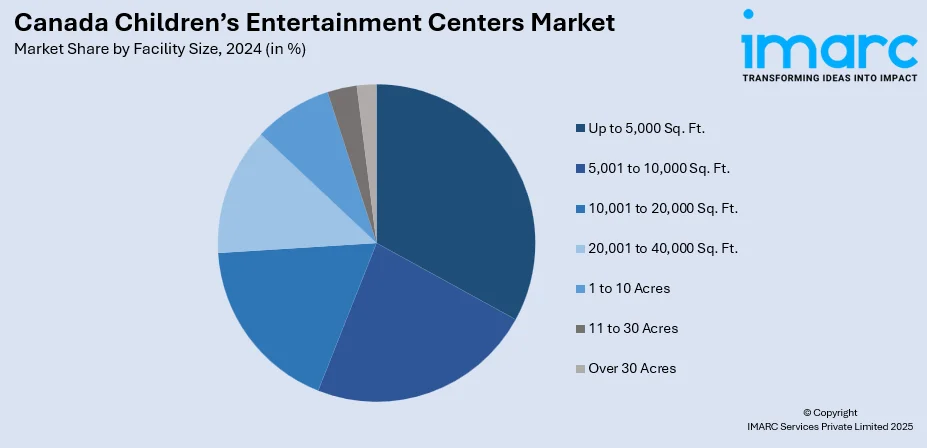
The report has provided a detailed breakup and analysis of the market based on the facility size. This includes up to 5,000 sq. ft., 5,001 to 10,000 sq. ft., 10,001 to 20,000 sq. ft., 20,001 to 40,000 sq. ft., 1 to 10 acres, 11 to 30 acres, and over 30 acres.
Revenue Source Insights:
- Entry Fees and Ticket Sales
- Food and Beverages
- Merchandising
- Advertising
- Others
The report has provided a detailed breakup and analysis of the market based on the revenue source. This includes entry fees and ticket sales, food and beverages, merchandising, advertising, and others.
Activity Area Insights:
- Arcade Studios
- AR and VR Gaming Zone
- Physical Play Activities
- Skill/Competition Games
- Others
A detailed breakup and analysis of the market based on the activity area have also been provided in the report. This includes arcade studios, AR and VR gaming zone, physical play activities, skill/competition games, and others.
Regional Insights:
- Ontario
- Quebec
- Alberta
- British Columbia
- Others
The report has also provided a comprehensive analysis of all the major regional markets, which include Ontario, Quebec, Alberta, British Columbia, and others.
Competitive Landscape:
The market research report has also provided a comprehensive analysis of the competitive landscape. Competitive analysis such as market structure, key player positioning, top winning strategies, competitive dashboard, and company evaluation quadrant has been covered in the report. Also, detailed profiles of all major companies have been provided.
Canada Children’s Entertainment Centers Market News:
- In December 2024, Cineplex launched a new Playdium location at Toronto’s CF Fairview Mall, strengthening Canada’s children’s entertainment market. Positioned beside Cineplex Cinemas, the venue caters to families with advanced gaming experiences, dedicated party spaces, and kid-friendly food. This expansion highlights growing demand for interactive, all-in-one recreational centers tailored to younger audiences, reinforcing Cineplex’s role in shaping modern family entertainment across Canada.
Canada Children’s Entertainment Centers Market Report Coverage:
| Report Features | Details |
|---|---|
| Base Year of the Analysis | 2024 |
| Historical Period | 2019-2024 |
| Forecast Period | 2025-2033 |
| Units | Million USD |
| Scope of the Report |
Exploration of Historical Trends and Market Outlook, Industry Catalysts and Challenges, Segment-Wise Historical and Future Market Assessment:
|
| Visitor Demographics Covered | Family With Children (0-9), Family With Children (9-12), Teenagers (12-18), Young Adults (18-24), Adults (Age 24+) |
| Facility Sizes Covered | Up to 5,000 Sq. Ft., 5,001 to 10,000 Sq. Ft., 10,001 to 20,000 Sq. Ft., 20,001 to 40,000 Sq. Ft., 1 to 10 Acres, 11 to 30 Acres, Over 30 Acres |
| Revenue Sources Covered | Entry Fees and Ticket Sales, Food and Beverages, Merchandising, Advertising, Others |
| Activity Areas Covered | Arcade Studios, AR and VR Gaming Zone, Physical Play Activities, Skill/Competition Games, Others |
| Regions Covered | Ontario, Quebec, Alberta, British Columbia, Others |
| Customization Scope | 10% Free Customization |
| Post-Sale Analyst Support | 10-12 Weeks |
| Delivery Format | PDF and Excel through Email (We can also provide the editable version of the report in PPT/Word format on special request) |
Key Questions Answered in This Report:
- How has the Canada children’s entertainment centers market performed so far and how will it perform in the coming years?
- What is the breakup of the Canada children’s entertainment centers market on the basis of visitor demographics?
- What is the breakup of the Canada children’s entertainment centers market on the basis of facility size?
- What is the breakup of the Canada children’s entertainment centers market on the basis of revenue source?
- What is the breakup of the Canada children’s entertainment centers market on the basis of activity area?
- What is the breakup of the Canada children’s entertainment centers market on the basis of region?
- What are the various stages in the value chain of the Canada children’s entertainment centers market?
- What are the key driving factors and challenges in the Canada children’s entertainment centers market?
- What is the structure of the Canada children’s entertainment centers market and who are the key players?
- What is the degree of competition in the Canada children’s entertainment centers market?
Key Benefits for Stakeholders:
- IMARC’s industry report offers a comprehensive quantitative analysis of various market segments, historical and current market trends, market forecasts, and dynamics of the Canada children’s entertainment centers market from 2019-2033.
- The research report provides the latest information on the market drivers, challenges, and opportunities in the Canada children’s entertainment centers market.
- Porter's five forces analysis assist stakeholders in assessing the impact of new entrants, competitive rivalry, supplier power, buyer power, and the threat of substitution. It helps stakeholders to analyze the level of competition within the Canada children’s entertainment centers industry and its attractiveness.
- Competitive landscape allows stakeholders to understand their competitive environment and provides an insight into the current positions of key players in the market.
Need more help?
- Speak to our experienced analysts for insights on the current market scenarios.
- Include additional segments and countries to customize the report as per your requirement.
- Gain an unparalleled competitive advantage in your domain by understanding how to utilize the report and positively impacting your operations and revenue.
- For further assistance, please connect with our analysts.
 Request Customization
 Speak to an Analyst
 Request Brochure
 Inquire Before Buying


.webp)


.webp)


