
Carbon Dioxide Prices, Trend, Chart, Demand, Market Analysis, News, Historical and Forecast Data Report 2026 Edition
Carbon Dioxide Price Trend, Index and Forecast
Track real-time and historical carbon dioxide prices across global regions. Updated monthly with market insights, drivers, and forecasts.
Carbon Dioxide Prices July 2026
| Region | Price (USD/KG) | Latest Movement |
|---|---|---|
| Europe | 0.29 | -3.3% ↓ Down |
| North America | 0.7 | -1.4% ↓ Down |
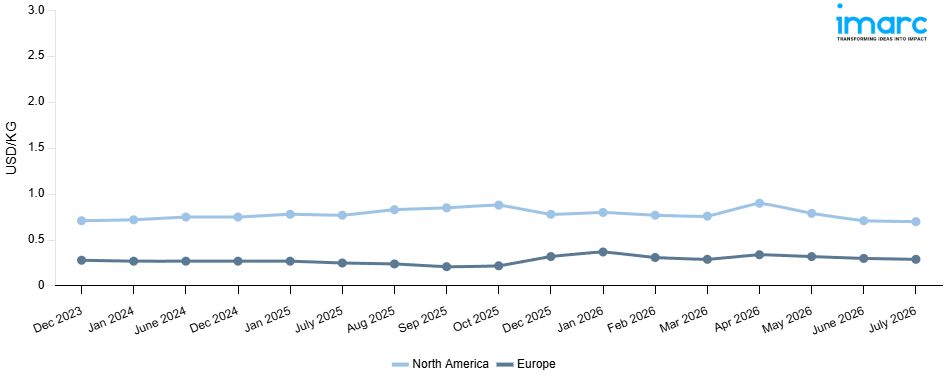
Carbon Dioxide Price Index (USD/KG):
The chart below highlights monthly carbon dioxide prices across different regions.
Get Access to Monthly/Quarterly/Yearly Prices, Request Sample
Market Overview Q1 Ending March 2026
Europe: The carbon dioxide prices in Europe reached 0.29 USD/KG in March 2026. The downward pricing movement registered between December and March 2026 was 9.4%. Weakened demand from the food and beverage carbonation, refrigeration, and industrial gas industries led to bearish market conditions in the respective markets across Europe during the review period. Improved access to carbon dioxide production and capture from ammonia and ethanol plant byproduct streams increased supply volumes, thereby easing downward pricing pressures on the existing regional market prices. Decreasing upstream energy and feedstock costs at key industrial gas production locations reduced manufacturing costs, thereby negatively impacting the cost base for existing prices during the respective period.
North America: The carbon dioxide prices in North America reached 0.76 USD/KG in March 2026. The downward pricing movement registered between December and March 2026 was 2.6%. Marginally softening demand from the food processing, beverage carbonation, and enhanced oil recovery sectors tempered procurement activity and contributed to mild bearish conditions across North American markets throughout the review period. Adequate domestic carbon dioxide production availability from industrial byproduct capture and dedicated production facilities maintained sufficient regional supply conditions and placed modest downward pressure on prevailing market rates. Slightly declining upstream energy and operational costs at key industrial gas production facilities reduced manufacturing expenses and weakened the cost support for existing price levels throughout the quarter.
Market Overview Q4 Ending December 2025
Europe: The carbon dioxide prices in Europe reached 0.32 USD/KG in December 2025. The upward pricing movement registered between September and December 2025 was 52.4%. Reduced ammonia plant running rates and planned maintenance shutdowns at important byproduct carbon dioxide recovery facilities severely limited regional availability, which was the main cause of the exceptional price spike. The supply shortage of captive carbon dioxide worsened amid rising natural gas prices, further inhibiting ammonia production. In the face of very constrained spot market volumes, procurement competitiveness was heightened by strong demand from the food and beverage carbonation, modified environment packaging, and cryogenic freezing industries. Furthermore, the welding and metal fabrication industries' increased consumption increased the pressure on offtake, and major consumers' strategic inventory building in anticipation of sustained supply tightness maintained aggressive purchasing activity, which reinforced the strong bullish pricing momentum throughout the quarter.
North America: The carbon dioxide prices in North America reached 0.78 USD/KG in December 2025. The downward pricing movement registered between September and December 2025 was 8.2%. The notable price decline was attributed to improved supply availability resulting from resumed operations at key ammonia and ethanol production facilities, which significantly increased byproduct carbon dioxide recovery volumes across the region. Weakened demand from the enhanced oil recovery sector, amid softening crude oil prices, further moderated industrial consumption volumes. Additionally, subdued seasonal consumption from the food and beverage carbonation segment following the peak summer period dampened procurement activity. Elevated inventory levels among major industrial gas distributors prompted competitive pricing concessions to stimulate buyer interest, while adequate pipeline and bulk supply availability from diversified sourcing channels limited upward pricing momentum, sustaining bearish market conditions throughout the quarter.
Market Overview Q3 Ending September 2025
Europe: The decline can be attributed to several factors. On the supply side, a steady increase in CO₂ production from industrial sectors, especially in chemical manufacturing, contributed to the price dip. Additionally, the reduction in demand from energy sectors, due to lower consumption during the summer months, led to a drop in prices. Currency fluctuations also played a role in altering the dynamics of international trade within the EU, as a stronger euro facilitated the import of CO₂ from other regions at a lower cost. Moreover, stricter environmental regulations introduced across European nations led to the adoption of more efficient CO₂ capture technologies, further increasing supply and driving prices down.
North America: The rise can be attributed to various factors. On the demand side, the increasing use of CO₂ in enhanced oil recovery (EOR) processes led to a surge in prices. The oil and gas sector in the US and Canada witnessed increased activity in this area, which placed additional pressure on the market for CO₂. Supply constraints were also felt due to disruptions in key production facilities. Furthermore, the continued push for carbon capture and storage (CCS) technology investments in both countries influenced prices, as these processes require additional CO₂ to be stored underground. Currency exchanges, especially the depreciation of the Canadian dollar, further supported the pricing momentum.
Carbon Dioxide Price Trend, Market Analysis, and News
IMARC's latest publication, “Carbon Dioxide Prices, Trend, Chart, Demand, Market Analysis, News, Historical and Forecast Data Report 2026 Edition,” presents a detailed examination of the carbon dioxide market, providing insights into both global and regional trends that are shaping prices. This report delves into the spot price of carbon dioxide at major ports and analyzes the composition of prices, including FOB and CIF terms. It also presents detailed carbon dioxide prices trend analysis by region, covering North America, Europe, Asia Pacific, Latin America, and Middle East and Africa. The factors affecting carbon dioxide pricing, such as the dynamics of supply and demand, geopolitical influences, and sector-specific developments, are thoroughly explored. This comprehensive report helps stakeholders stay informed with the latest market news, regulatory updates, and technological progress, facilitating informed strategic decision-making and forecasting.
Carbon Dioxide Industry Analysis
The global carbon dioxide industry size reached 268.7 Million Tons in 2025. By 2034, IMARC Group expects the market to reach 410.3 Million Tons, at a projected CAGR of 4.67% during 2026-2034. The market is driven by the increased demand for CO₂ in enhanced oil recovery, rising applications in food and beverage industries for carbonation, advancements in carbon capture technologies, and expanding industrial demand in manufacturing processes.
Latest developments in the carbon dioxide industry:
- June 2025: A team of researchers at Rice University discovered a simple method to significantly improve the stability of electrochemical devices that convert carbon dioxide into useful fuels and chemicals. Their study tackled a major issue in CO₂ reduction systems, including salt buildup that clogs gas flow channels and causes premature device failure.
- April 2023: EXXONMOBIL announced its plan to store CO2 from the blue hydrogen complex of LINDE, California, U.S. The project is expected to capture 90% of CO2 emitted from the hydrogen production procedure.
- January 2023: POET announced its plans to construct a new facility at its bioprocessing location in Laddonia. The new facility aims to capture above 200 tons of CO2 per day and produce dry ice.
Product Description
Carbon dioxide, also represented at CO2, is a colorless, odorless gas composed of one carbon atom and two oxygen atoms. It is a naturally occurring compound in the Earth's atmosphere and is a key component of the carbon cycle. CO₂ is formed through various natural processes, including respiration by animals and plants, decomposition of organic matter, and volcanic eruptions. Additionally, human activities such as the burning of fossil fuels (coal, oil, and natural gas), deforestation, and industrial processes contribute significantly to CO₂ emissions. CO₂ has diverse applications across multiple industries. In the beverage industry, it is used for carbonation, providing the characteristic fizz in soft drinks, sparkling water, and alcoholic beverages.
Report Coverage
| Key Attributes | Details |
|---|---|
| Product Name | Carbon Dioxide |
| Report Features | Exploration of Historical Trends and Market Outlook, Industry Demand, Industry Supply, Gap Analysis, Challenges, Carbon Dioxide Price Analysis, and Segment-Wise Assessment. |
| Currency/Units | US$ (Data can also be provided in local currency) or Metric Tons |
| Region/Countries Covered | The current coverage includes analysis at the global and regional levels only. Based on your requirements, we can also customize the report and provide specific information for the following countries: Asia Pacific: China, India, Indonesia, Pakistan, Bangladesh, Japan, Philippines, Vietnam, Thailand, South Korea, Malaysia, Nepal, Taiwan, Sri Lanka, Hongkong, Singapore, Australia, and New Zealand Europe: Germany, France, United Kingdom, Italy, Spain, Russia, Turkey, Netherlands, Poland, Sweden, Belgium, Austria, Ireland, Switzerland, Norway, Denmark, Romania, Finland, Czech Republic, Portugal and Greece North America: United States and Canada Latin America: Brazil, Mexico, Argentina, Columbia, Chile, Ecuador, and Peru Middle East & Africa: Saudi Arabia, UAE, Israel, Iran, South Africa, Nigeria, Oman, Kuwait, Qatar, Iraq, Egypt, Algeria, and Morocco The list of countries presented is not exhaustive. Information on additional countries can be provided if required by the client. |
| Information Covered for Key Suppliers |
|
| Customization Scope | The report can be customized as per the requirements of the customer |
| Report Price and Purchase Option |
Plan A: Monthly Updates - Annual Subscription
Plan B: Quarterly Updates - Annual Subscription
Plan C: Biannually Updates - Annual Subscription
|
| Post-Sale Analyst Support | 360-degree analyst support after report delivery |
| Delivery Format | PDF and Excel through email (We can also provide the editable version of the report in PPT/Word format on special request) |
Key Benefits for Stakeholders:
- IMARC’s report presents a detailed analysis of carbon dioxide pricing, covering global and regional trends, spot prices at key ports, and a breakdown of FOB and CIF prices.
- The study examines factors affecting carbon dioxide price trend, including input costs, supply-demand shifts, and geopolitical impacts, offering insights for informed decision-making.
- The competitive landscape review equips stakeholders with crucial insights into the latest market news, regulatory changes, and technological advancements, ensuring a well-rounded, strategic overview for forecasting and planning.
- IMARC offers various subscription options, including monthly, quarterly, and biannual updates, allowing clients to stay informed with the latest market trends, ongoing developments, and comprehensive market insights. The carbon dioxide price charts ensure our clients remain at the forefront of the industry.
Frequently Asked Questions About the Carbon Dioxide Prices Report
The carbon dioxide prices in July 2026 were 0.29 USD/KG in Europe and 0.7 USD/KG in North America.
The carbon dioxide pricing data is updated on a monthly basis.
We provide the pricing data primarily in the form of an Excel sheet and a PDF.
Yes, our report includes a forecast for carbon dioxide prices.
The regions covered include North America, Europe, Asia Pacific, Middle East, and Latin America. Countries can be customized based on the request (additional charges may be applicable).
Yes, we provide both FOB and CIF prices in our report.
Need more help?
- Speak to our experienced analysts for insights on the current market scenarios.
- Include additional segments and countries to customize the report as per your requirement.
- Gain an unparalleled competitive advantage in your domain by understanding how to utilize the report and positively impacting your operations and revenue.
- For further assistance, please connect with our analysts.
 Request Customization
 Inquire Before Buying
 Speak to an Analyst
 Request Brochure
Benefits of Customization
- Personalize this research
- Triangulate with your data
- Get data as per your format and definition
- Gain a deeper dive into a specific application, geography, customer, or competitor
- Any level of personalization
Get in Touch With Us
UNITED STATES
Phone: +1-201-971-6302
INDIA
Phone: +91-120-433-0800
UNITED KINGDOM
Phone: +44-753-714-6104
Email: [email protected]
Client Testimonials


.webp)


Why Choose Us
IMARC offers trustworthy, data-centric insights into commodity pricing and evolving market trends, enabling businesses to make well-informed decisions in areas such as procurement, strategic planning, and investments. With in-depth knowledge spanning more than 1000 commodities and a vast global presence in over 150 countries, we provide tailored, actionable intelligence designed to meet the specific needs of diverse industries and markets.
1000
+Commodities
150
+Countries Covered
3000
+Clients
20
+Industry
Robust Methodologies & Extensive Resources
IMARC delivers precise commodity pricing insights using proven methodologies and a wealth of data to support strategic decision-making.
Subscription-Based Databases
Our extensive databases provide detailed commodity pricing, import-export trade statistics, and shipment-level tracking for comprehensive market analysis.
Primary Research-Driven Insights
Through direct supplier surveys and expert interviews, we gather real-time market data to enhance pricing accuracy and trend forecasting.
Extensive Secondary Research
We analyze industry reports, trade publications, and market studies to offer tailored intelligence and actionable commodity market insights.
Trusted by 3000+ industry leaders worldwide to drive data-backed decisions. From global manufacturers to government agencies, our clients rely on us for accurate pricing, deep market intelligence, and forward-looking insights.