
Chlorinated Polyethylene Production Cost Analysis Report 2026: Industry Trends, Plant Setup, Machinery, Raw Materials, Investment Opportunities, Cost and Revenue
Chlorinated Polyethylene Production Cost Analysis Report (DPR) Summary:
IMARC Group's comprehensive DPR report, titled "Chlorinated Polyethylene Production Cost Analysis Report 2026: Industry Trends, Plant Setup, Machinery, Raw Materials, Investment Opportunities, Cost and Revenue," provides a complete roadmap for setting up a Chlorinated Polyethylene production unit. The chlorinated polyethylene market is driven by Expanding infrastructure development and increasing consumption of PVC pipes, window profiles, roofing membranes, and cable insulation. The global chlorinated polyethylene market size was valued at USD 745.2 Million in 2025. According to IMARC Group estimates, the market is expected to reach at USD 1219.4 Million by 2034, exhibiting a CAGR of 5.50% from 2026 to 2034.
This feasibility report covers a comprehensive market overview to micro-level information such as unit operations involved, raw material requirements, utility requirements, infrastructure requirements, machinery and technology requirements, manpower requirements, packaging requirements, transportation requirements, etc.
The chlorinated polyethylene production plant setup cost is provided in detail covering project economics, capital investments (CapEx), project funding, operating expenses (OpEx), income and expenditure projections, fixed costs vs. variable costs, direct and indirect costs, expected ROI and net present value (NPV), profit and loss account, financial analysis, etc.
What is Chlorinated Polyethylene ?
Chlorinated Polyethylene (CPE) is a versatile polymer derived from the chlorination of polyethylene, known for excellent weather resistance, flame retardancy, and impact resistance. These properties make it ideal for applications such as wire and cable jacketing, rubber and plastic modifications, and roofing membranes. It is also used in manufacturing industrial hoses, magnetic materials, and adhesives. The chemical stability and flexibility of CPE contribute to its broad acceptance in various industrial and consumer markets.
Key Investment Highlights
- Process Used: HDPE powder preparation, suspension or slurry chlorination, separation and washing, neutralization, drying, and pulverization/packaging.
- End-use Industries: Automotive, construction, wire & cable, plastics and polymers, rubber processing, and industrial manufacturing.
- Applications: Used as an impact modifier and polymer modifier in PVC products, wire and cable insulation, hoses, roofing membranes, automotive components, and specialty rubber products.
Chlorinated Polyethylene Plant Capacity:
The proposed facility is designed with an annual production capacity ranging between 10,000–40,000 MT, enabling economies of scale while maintaining operational flexibility.
Chlorinated Polyethylene Plant Profit Margins:
The project demonstrates healthy profitability potential under normal operating conditions. Gross profit margins typically range between 20–28%, supported by stable demand and value-added applications.
- Gross Profit: 20–28%
- Net Profit: 7–13%
Chlorinated Polyethylene Plant Cost Analysis:
The operating cost structure of a chlorinated polyethylene production plant is primarily driven by raw material consumption, particularly high-density polyethylene HDPE powder, which accounts for approximately 55–65% of total operating expenses (OpEx).
- Raw Materials: 55–65% of OpEx
- Utilities: 12–16% of OpEx
Financial Projection:
The financial projections for the proposed project have been developed based on realistic assumptions related to capital investment, operating costs, production capacity utilization, pricing trends, and demand outlook. These projections provide a comprehensive view of the project’s financial viability, ROI, profitability, and long-term sustainability.
Major Applications:
- Wire and Cable Jacketing: Used for enhanced fire resistance and low smoke emission properties.
- Rubber and Plastic Modifications: Widely utilized in enhancing flexibility and weather resistance.
- Roofing Membranes: Employed in construction for excellent UV resistance and tensile strength.
- Industrial Hoses: Contributes to durability and resistance to oil, chemicals, and extreme temperatures.
Why Chlorinated Polyethylene Production?
- Diverse Application Range: Chlorinated Polyethylene caters to various sectors due to its properties, making it versatile for numerous industrial and consumer applications.
- Advantageous Material Properties: CPE offers benefits like flame retardancy, impact resistance, and excellent weatherability, advantageous over conventional materials.
- Growing Construction Sector: The expansion of the construction industry is driving demand for CPE in applications like roofing membranes and sealants.
- Automotive Industry Growth: Increased automotive production enhances demand for CPE in interior and exterior parts due to its durability and elasticity.
- Economic and Environmental Benefits: CPE's recyclable nature and cost efficiency complement sustainability goals, promoting its adoption across industries.
Transforming Vision into Reality:
This report provides the comprehensive blueprint needed to transform your chlorinated polyethylene production vision into a technologically advanced and highly profitable reality.
Chlorinated Polyethylene Industry Outlook 2026:
The chlorinated polyethylene industry is expected to witness steady growth, driven by rising demand from the construction, automotive, wire and cable, and polymer modification sectors. CPE is widely used as an impact modifier for PVC, a thermoplastic elastomer, and a weather-resistant material due to its excellent chemical resistance, flame retardancy, and durability. In the automotive sector, the growing use of lightweight and durable materials for hoses, seals, and vibration-dampening components is further strengthening demand. According to the report released by NITI Aayog, India's current share in globally traded auto components is approximately 3% or 20 billion Manufacturers are investing in process optimization, product innovation, and high-performance CPE grades to meet evolving industrial requirements and stringent quality standards. Additionally, increasing emphasis on recyclable materials, energy-efficient manufacturing, and sustainable production practices is encouraging technological advancements.
Leading Chlorinated Polyethylene Producers:
Leading producers in the global chlorinated polyethylene industry include several multinational companies with extensive production capacities and diverse application portfolios. Key players include:
- Weifang Yaxing Chemical Co., Ltd.
- Shandong Gaoxin Chemical Co., Ltd.
- Sundow Polymers Co., Ltd.
- Shandong Xuye New Materials Co., Ltd.
- Resonac Holdings Corporation
all of which serve end-use sectors such as automotive, construction, wire & cable, plastics and polymers, rubber processing, and industrial manufacturing.
How to Setup a Chlorinated Polyethylene Production Plant?
Setting up a chlorinated polyethylene production plant requires evaluating several key factors, including technological requirements and quality assurance.
Some of the critical considerations include:
- Detailed Process Flow: The production process is a multi-step operation that involves several unit operations, material handling, and quality checks. Below are the main stages involved in the chlorinated polyethylene production process flow:
- Unit Operations Involved
- Mass Balance and Raw Material Requirements
- Quality Assurance Criteria
- Technical Tests
- Site Selection: The location must offer easy access to key raw materials such as high-density polyethylene HDPE powder. Proximity to target markets will help minimize distribution costs. The site must have robust infrastructure, including reliable transportation, utilities, and waste management systems. Compliance with local zoning laws and environmental regulations must also be ensured.
- Plant Layout Optimization: The layout should be optimized to enhance workflow efficiency, safety, and minimize material handling. Separate areas for raw material storage, production, quality control, and finished goods storage must be designated. Space for future expansion should be incorporated to accommodate business growth.
- Equipment Selection: High-quality, corrosion-resistant machinery tailored for chlorinated polyethylene production must be selected. Essential equipment includes HDPE powder feeding and handling systems, chlorination reactors, chlorine gas handling and dosing systems, slurry preparation tanks, separators or centrifuges, washing and neutralization units, drying systems, pulverizers, dust collection systems, and packaging machines. All machinery must comply with industry standards for safety, efficiency, and reliability.
- Raw Material Sourcing: Reliable suppliers must be secured for raw materials like high-density polyethylene HDPE powder to ensure consistent production quality. Minimizing transportation costs by selecting nearby suppliers is essential. Sustainability and supply chain risks must be assessed, and long-term contracts should be negotiated to stabilize pricing and ensure a steady supply.
- Safety and Environmental Compliance: Safety protocols must be implemented throughout the production process of chlorinated polyethylene Advanced monitoring systems should be installed to detect leaks or deviations in the process. Effluent treatment systems are necessary to minimize environmental impact and ensure compliance with emission standards.
- Quality Assurance Systems: A robust quality management system is crucial in ensuring that Chlorinated Polyethylene meets industry and regulatory standards. Continuous monitoring and testing are essential to assess its chemical stability, mechanical properties, and environmental compliance. By implementing comprehensive tracking mechanisms, manufacturers ensure product reliability and safety, bolstering customer confidence. This system encourages ongoing improvement and innovation, aligning production with industry advancements and sustainability goals.
Project Economics:
Establishing and operating a chlorinated polyethylene production plant involves various cost components, including:
- Capital Investment: The total capital investment depends on plant capacity, technology, and location. This investment covers land acquisition, site preparation, and necessary infrastructure.
- Equipment Costs: Equipment costs, such as those for HDPE powder feeding and handling systems, chlorination reactors, chlorine gas handling and dosing systems, slurry preparation tanks, separators or centrifuges, washing and neutralization units, drying systems, pulverizers, dust collection systems, and packaging machines, represent a significant portion of capital expenditure. The scale of production and automation level will determine the total cost of machinery.
- Raw Material Expenses: Raw Materials, including core ingredients like high-density polyethylene HDPE powder, are a major part of operating costs. Long-term contracts with reliable suppliers will help mitigate price volatility and ensure a consistent supply of materials.
- Infrastructure and Utilities: Costs associated with land acquisition, construction, and utilities (electricity, water, steam) must be considered in the financial plan.
- Operational Costs: Ongoing expenses for labor, maintenance, quality control, and environmental compliance must be accounted for. Optimizing processes and providing staff training can help control these operational costs.
- Financial Planning: A detailed financial analysis, including income projections, expenditures, and break-even points, must be conducted. This analysis aids in securing funding and formulating a clear financial strategy.
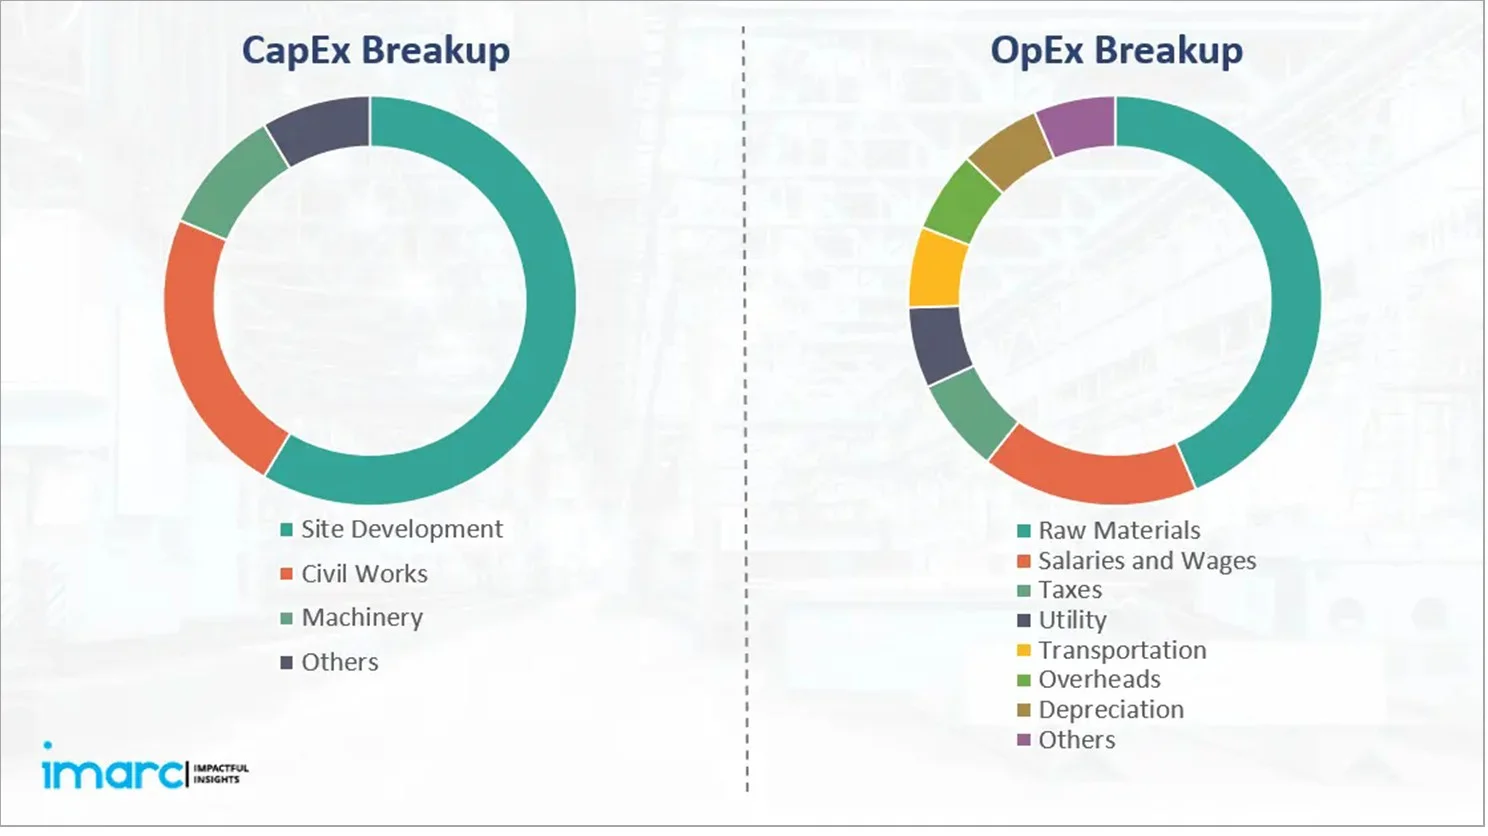
Capital Expenditure (CapEx) and Operational Expenditure (OpEx) Analysis:
Capital Investment (CapEx): Machinery costs account for the largest portion of the total capital expenditure. The cost of land and site development, including charges for land registration, boundary development, and other related expenses, forms a substantial part of the overall investment. This allocation ensures a solid foundation for safe and efficient plant operations.
Operating Expenditure (OpEx): In the first year of operations, the operating cost for the chlorinated polyethylene production plant is projected to be significant, covering raw materials, utilities, depreciation, taxes, packing, transportation, and repairs and maintenance. By the fifth year, the total operational cost is expected to increase substantially due to factors such as inflation, market fluctuations, and potential rises in the cost of key materials. Additional factors, including supply chain disruptions, rising consumer demand, and shifts in the global economy, are expected to contribute to this increase.
Capital Expenditure Breakdown:
| Particulars | Cost (in US$) |
|---|---|
| Land and Site Development Costs | XX |
| Civil Works Costs | XX |
| Machinery Costs | XX |
| Other Capital Costs | XX |
To access CapEx Details, Request Sample
Operational Expenditure Breakdown:
| Particulars | In % |
|---|---|
| Raw Material Cost | 55-65% |
| Utility Cost | 12–16% |
| Transportation Cost | XX |
| Packaging Cost | XX |
| Salaries and Wages | XX |
| Depreciation | XX |
| Taxes | XX |
| Other Expenses | XX |
To access OpEx Details, Request Sample
Profitability Analysis:
| Particulars | Unit | Year 1 | Year 2 | Year 3 | Year 4 | Year 5 | Average |
|---|---|---|---|---|---|---|---|
| Total Income | US$ | XX | XX | XX | XX | XX | XX |
| Total Expenditure | US$ | XX | XX | XX | XX | XX | XX |
| Gross Profit | US$ | XX | XX | XX | XX | XX | XX |
| Gross Margin | % | XX | XX | XX | XX | XX | 20–28% |
| Net Profit | US$ | XX | XX | XX | XX | XX | XX |
| Net Margin | % | XX | XX | XX | XX | XX | 7-13% |
To access Financial Analysis, Request Sample
Latest Industry Developments:
- July 2025: A study published in the Journal of Applied Polymer Science aimed to provide a broader overview of CPE status in the field of materials science and engineering, emphasizing its past innovations, current properties‐based applications, and future developments.
Report Coverage:
| Report Features | Details |
|---|---|
| Product Name | Chlorinated Polyethylene |
| Report Coverage | Detailed Process Flow: Unit Operations Involved, Quality Assurance Criteria, Technical Tests, Mass Balance, and Raw Material Requirements Land, Location and Site Development: Selection Criteria and Significance, Location Analysis, Project Planning and Phasing of Development, Environmental Impact, Land Requirement and Costs Plant Layout: Importance and Essentials, Layout, Factors Influencing Layout Plant Machinery: Machinery Requirements, Machinery Costs, Machinery Suppliers (Provided on Request) Raw Materials: Raw Material Requirements, Raw Material Details and Procurement, Raw Material Costs, Raw Material Suppliers (Provided on Request) Packaging: Packaging Requirements, Packaging Material Details and Procurement, Packaging Costs, Packaging Material Suppliers (Provided on Request) Other Requirements and Costs: Transportation Requirements and Costs, Utility Requirements and Costs, Energy Requirements and Costs, Water Requirements and Costs, Human Resource Requirements and Costs Project Economics: Capital Costs, Techno-Economic Parameters, Income Projections, Expenditure Projections, Product Pricing and Margins, Taxation, Depreciation Financial Analysis: Liquidity Analysis, Profitability Analysis, Payback Period, Net Present Value, Internal Rate of Return, Profit and Loss Account, Uncertainty Analysis, Sensitivity Analysis, Economic Analysis Other Analysis Covered in The Report: Market Trends and Analysis, Market Segmentation, Market Breakup by Region, Price Trends, Competitive Landscape, Regulatory Landscape, Strategic Recommendations, Case Study of a Successful Venture |
| Currency | US$ (Data can also be provided in the local currency) |
| Customization Scope | The report can also be customized based on the requirement of the customer |
| Post-Sale Analyst Support | 10-12 Weeks |
| Delivery Format | PDF and Excel through email (We can also provide the editable version of the report in PPT/Word format on special request) |
Report Customization
While we have aimed to create an all-encompassing chlorinated polyethylene production plant project report, we acknowledge that individual stakeholders may have unique demands. Thus, we offer customized report options that cater to your specific requirements. Our consultants are available to discuss your business requirements, and we can tailor the report's scope accordingly. Some of the common customizations that we are frequently requested to make by our clients include:
- The report can be customized based on the location (country/region) of your plant.
- The plant’s capacity can be customized based on your requirements.
- Plant machinery and costs can be customized based on your requirements.
- Any additions to the current scope can also be provided based on your requirements.
Why Buy IMARC Reports?
- The insights provided in our reports enable stakeholders to make informed business decisions by assessing the feasibility of a business venture.
- Our extensive network of consultants, raw material suppliers, machinery suppliers and subject matter experts spans over 100+ countries across North America, Europe, Asia Pacific, South America, Africa, and the Middle East.
- Our cost modeling team can assist you in understanding the most complex materials. With domain experts across numerous categories, we can assist you in determining how sensitive each component of the cost model is and how it can affect the final cost and prices.
- We keep a constant track of land costs, construction costs, utility costs, and labor costs across 100+ countries and update them regularly.
- Our client base consists of over 3000 organizations, including prominent corporations, governments, and institutions, who rely on us as their trusted business partners. Our clientele varies from small and start-up businesses to Fortune 500 companies.
- Our strong in-house team of engineers, statisticians, modeling experts, chartered accountants, architects, etc. has played a crucial role in constructing, expanding, and optimizing sustainable production plants worldwide.
Need more help?
- Speak to our experienced analysts for insights on the current market scenarios.
- Include additional segments and countries to customize the report as per your requirement.
- Gain an unparalleled competitive advantage in your domain by understanding how to utilize the report and positively impacting your operations and revenue.
- For further assistance, please connect with our analysts.


Factory Setup Services
IMARC Group's factory setup services streamline the entire establishment process, ensuring efficient planning, seamless execution, and optimal operational readiness for your manufacturing facility.


Site Selection Services
IMARC Group's site selection services optimize location choices for businesses, ensuring strategic, cost-effective, and efficient manufacturing operations.


Factory Audit Services
IMARC Group's plant audit services offer comprehensive evaluations of your industrial facility's health, efficiency, and regulatory compliance.


Regulatory Approvals, and Licensing Services
IMARC Group's regulatory approval and licensing services ensure businesses meet all compliance requirements, facilitating smooth and timely market entry.
 Inquire Before Buying
 Speak to an Analyst
 Request Brochure
 Request Customization
Related Reports

Frequently Asked Questions
Capital requirements generally include land acquisition, construction, equipment procurement, installation, pre-operative expenses, and initial working capital. The total amount varies with capacity, technology, and location.
To start a chlorinated polyethylene production business, one needs to conduct a market feasibility study, secure required licenses, arrange funding, select suitable land, procure equipment, recruit skilled labor, and establish a supply chain and distribution network.
Chlorinated polyethylene production requires high-density polyethylene (HDPE) as the base polymer, chlorine gas for chlorination, water as a medium for the slurry process, and additives such as stabilizers and plasticizers for post-processing.
The chlorinated polyethylene factory typically requires chlorination reactors, HDPE feeding and handling systems, cooling and drying units, neutralization tanks, centrifuges, filtration systems, and packaging machines, along with essential safety and control systems.
The main steps generally include:
-
Sourcing of raw materials (HDPE, chlorine gas, additives)
-
Chlorination reaction
-
Quenching and neutralization
-
Washing and filtration
-
Drying and granulation
-
Packaging and storage
Usually, the timeline can range from 12 to 36 months to start a chlorinated polyethylene production plant, depending on factors like plant capacity, procurement of machinery, installation, trial runs, workforce training, and obtaining necessary regulatory approvals.
Challenges may include high capital requirements, securing regulatory approvals, ensuring raw material supply, competition, skilled manpower availability, and managing operational risks.
Typical requirements include business registration, environmental clearances, factory licenses, fire safety certifications, and industry-specific permits. Local/state/national regulations may apply depending on the location.
The top chlorinated polyethylene producers are:
-
Aurora Plastics LLC
-
Hangzhou Keli Chemical Co. Ltd.
-
Jiangsu Tianteng Chemical Industry Co. Ltd.
-
Lianda Corporation
-
Shandong Novista Chemicals Co. Ltd.
-
Shandong Gaoxin Chemical Co. Ltd.
-
Shandong Xiangsheng New Materials Technology Co. Ltd.
-
Shandong Xuye New Materials Co. Ltd.
-
Showa Denko K.K
-
Sundow Polymers Co. Ltd.
-
Weifang Yaxing Chemical Co. Ltd.
Profitability depends on several factors including market demand, production efficiency, pricing strategy, raw material cost management, and operational scale. Profit margins usually improve with capacity expansion and increased capacity utilization rates.
Cost components typically include:
-
Land and Infrastructure
-
Machinery and Equipment
-
Building and Civil Construction
-
Utilities and Installation
-
Working Capital
Break even in a chlorinated polyethylene production business typically range from 3 to 6 years, depending on operational efficiency, raw material costs, plant capacity, production scale, and demand in various sectors. Efficient operations can help shorten the break-even period.
Governments may offer incentives such as capital subsidies, tax exemptions, reduced utility tariffs, export benefits, or interest subsidies to promote manufacturing under various national or regional industrial policies.
Financing can be arranged through term loans, government-backed schemes, private equity, venture capital, equipment leasing, or strategic partnerships. Financial viability assessments help identify optimal funding routes.
Choose your plan
*Please note that the prices mentioned below are starting prices for each bundle type. Kindly contact our team for further details.*
Single User License
- 1 User License, Access on 2 Devices
- PDF Report + Excel Dataset (Password Protected)
- Lifetime Access
- No Printing Rights
- 10% Free Report Customization
- 10–12 Weeks of Analyst Support
Five User License
- Access for 5 Users, 2 Devices per User
- PDF Report + Excel Dataset (Password Protected)
- Lifetime Access
- Dedicated Account Manager
- 12–14 Weeks of Analyst Support
- No Printing Rights
- 15% Free Report Customization
- 25% Discount on Your Next Purchase
Corporate User License
- Unlimited User Access (Within Your Organization)
- PDF Report + Excel Dataset
- Lifetime Access
- Dedicated Account Manager
- 14–20 Weeks of Analyst Support
- No Printing Rights
- 20% Free Report Customization
- 30% Discount on Your Next Purchase
Essential Insights
What's included:
3 reports
- Lifetime Access
- PDF Reports
- Excel Datasets
- 2 Weeks of Free Analyst Support
- 2 User Licenses
- Access on 2 Devices
- Printing Rights
- Complimentary PowerPoint (PPT) Version
- Complimentary License Upgrade
Professional Access
What's included:
5 reports
- Lifetime Access
- PDF Reports
- Excel Datasets
- 8 Weeks of Free Analyst Support
- 2 User Licenses
- Access on 2 Devices
- Printing Rights
- Complimentary PowerPoint (PPT) Version
- Complimentary License Upgrade
Business Advantage
What's included:
8 reports
- Lifetime Access
- PDF Reports
- Excel Datasets
- 14 Weeks of Free Analyst Support
- 2 User Licenses
- Access on 2 Devices
- Printing Rights
- Complimentary PowerPoint (PPT) Version
- Complimentary License Upgrade
Enterprise Intelligence
What's included:
10 reports
- Lifetime Access
- PDF Reports
- Excel Datasets
- 20 Weeks of Free Analyst Support
- 2 User Licenses
- Access on 2 Devices
- Printing Rights
- Complimentary PowerPoint (PPT) Version
- Complimentary License Upgrade