
Chlorine Prices, Trend, Chart, Demand, Market Analysis, News, Historical and Forecast Data Report 2026 Edition
Chlorine Price Trend, Index and Forecast
Track real-time and historical chlorine prices across global regions. Updated monthly with market insights, drivers, and forecasts.
Chlorine Prices June 2026
| Region | Price (USD/KG) | Latest Movement |
|---|---|---|
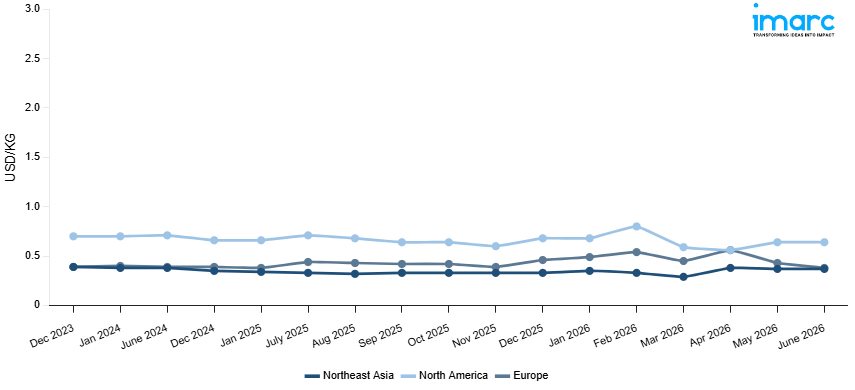
| Northeast Asia | 0.37 | Unchanged |
| Europe | 0.38 | -11.6% ↓ Down |
| North America | 0.64 | Unchanged |
Chlorine Price Index (USD/KG):
The chart below highlights monthly chlorine prices across different regions.
Get Access to Monthly/Quarterly/Yearly Prices, Request Sample
Market Overview Q1 Ending March 2026
Northeast Asia: The chlorine prices in Northeast Asia reached 0.29 USD/KG in March 2026. The downward pricing movement registered between December and March 2026 was 12.1%. Weak demand from the polyvinyl chloride, water treatment, and specialized chemicals manufacturing sectors led to lower purchases and was the key driver of the negative market sentiment prevailing in the chlorine market in the Northeast Asian region. The high production in China from regional chlor alkali plants created an oversupply, increasing competition among suppliers in the region. The decline in the cost of salt and electricity feedstock from the key producers lowered the cost structure and diminished the minimum cost basis of the present regional chlorine price level.
Europe: The chlorine prices in Europe reached 0.45 USD/KG in March 2026. The downward pricing movement registered between December and March 2026 was 2.2%. Marginally softening demand from the polyvinyl chloride, water treatment, and pharmaceutical manufacturing sectors tempered procurement activity and contributed to mild bearish conditions across European markets throughout the review period. Adequate domestic chlor alkali production output from regional manufacturing facilities maintained sufficient supply conditions and placed modest downward pressure on prevailing European chlorine market rates during the quarter. Slightly declining upstream electricity and brine feedstock costs at regional chlor alkali production facilities reduced manufacturing expenses and weakened the cost support for existing price levels.
North America: The chlorine prices in North America reached 0.59 USD/KG in March 2026. The downward pricing movement registered between December and March 2026 was 13.2%. There was a considerable reduction in demand from the polyvinyl chloride industry, water treatment sector, and specialty chemicals industries, which resulted in a significant reduction in purchasing activities and caused a very bearish chlorine market environment in North American markets during the period under review. The abundance of domestic chlor alkali production increased the supply and put more pressure on regional manufacturers in the quarter. The significant decline in upstream energy and brine feedstock prices at domestic chlor alkali production plants reduced production costs and provided a weak pricing foundation for prevailing chlorine prices during the period.
Market Overview Q4 Ending December 2025
Northeast Asia: The chlorine prices in Northeast Asia reached 0.33 USD/KG in December 2025. The upward pricing movement registered between September and December 2025 was 1.0%. The slight price rise indicated a mostly stable market context, with consistent demand from the PVC production, water treatment, and chemical intermediate industries, which maintained baseline purchasing levels over the quarter. Stable costs for upstream electricity and brine feedstock for chlor alkali electrolysis activities provided additional pricing support for local manufacturers. Regulated manufacturing output from key membrane cell plants maintained equilibrium between supply and demand, avoiding market surpluses.
Europe: The chlorine prices in Europe reached 0.46 USD/KG in December 2025. The upward pricing movement registered between September and December 2025 was 9.9%. The notable price appreciation was primarily driven by escalating electricity costs across the region, which significantly elevated operational expenses for chlor alkali plant operators running energy intensive membrane electrolysis processes. Tightened supply conditions resulting from reduced plant operating rates due to unfavorable energy economics further constrained regional availability. Sustained demand from the PVC production, water disinfection, and isocyanate manufacturing sectors maintained robust procurement activity throughout the quarter.
North America: The chlorine prices in North America reached 0.68 USD/KG in December 2025. The upward pricing movement registered between September and December 2025 was 6.3%. The continuous demand from the PVC manufacturing, water treatment, and chemical processing sectors, which continuously maintained high purchasing levels throughout the quarter, was the cause of the persistent price increase. For domestic manufacturers of chlor alkali, high upstream electricity and brine processing prices raised production costs, reinforcing rising pricing patterns. Supply constraints resulting from scheduled maintenance shutdowns at large electrolysis plants increased downstream users' rivalry for purchases.
Market Overview Q3 Ending September 2025
Northeast Asia: In Northeast Asia, chlorine prices strengthened as firm demand from water treatment and PVC manufacturing supported higher procurement activity. The chlorine price index reflected robust consumption in construction-related plastics and sanitation products, while steady orders from pulp and paper industries added further support. Although feedstock salt availability remained stable, higher downstream utilization rates in chemicals and packaging applications tightened regional inventories. Rising logistics costs and seasonal demand in water disinfection also contributed to upward momentum, keeping prices elevated during this quarter.
Europe: In Europe, chlorine prices softened due to sluggish demand from the plastics industry and weakening procurement in industrial chemicals. Ample supply availability, coupled with reduced seasonal activity in water treatment applications, kept the chlorine price index under pressure. Additionally, import competition and moderate energy costs restrained producer margins, preventing any significant upward momentum in regional prices.
North America: In North America, chlorine prices fell amid subdued demand from PVC and solvents, with weaker housing and construction activity curbing buying interest. Domestic production levels remained steady, ensuring abundant supply across the region. The chlorine price index moved lower as muted downstream activity and cautious procurement from buyers discouraged price stability, leaving the market sentiment bearish.
Chlorine Price Trend, Market Analysis, and News
IMARC's latest publication, “Chlorine Prices, Trend, Chart, Demand, Market Analysis, News, Historical and Forecast Data Report 2026 Edition,” presents a detailed examination of the chlorine market, providing insights into both global and regional trends that are shaping prices. This report delves into the spot price of chlorine at major ports and analyzes the composition of prices, including FOB and CIF terms. It also presents detailed chlorine prices trend analysis by region, covering North America, Europe, Asia Pacific, Latin America, and Middle East and Africa. The factors affecting chlorine pricing, such as the dynamics of supply and demand, geopolitical influences, and sector-specific developments, are thoroughly explored. This comprehensive report helps stakeholders stay informed with the latest market news, regulatory updates, and technological progress, facilitating informed strategic decision-making and forecasting.
.webp)
Chlorine Industry Analysis
The global chlorine industry size reached USD 26.40 Billion in 2025. By 2034, IMARC Group expects the market to reach USD 35.02 Billion, at a projected CAGR of 3.19% during 2026-2034. Growth in the chlorine market is fueled by rising demand in PVC production, increasing applications in water treatment and sanitation, and expanding use in industrial chemicals, driven by construction and infrastructure development worldwide.
Latest developments in the Chlorine Industry:
- September 2025: Bondalti Chemicals started operations at a modern chlor-alkali facility in Estarreja, Portugal, using Asahi Kasei’s latest electrolyzer system. The new plant is meant to improve energy efficiency and reduce environmental impact, as part of Bondalti’s decarbonization strategy.
- January 2024: Atul Products Ltd commissioned a caustic-chlorine plant worth INR 1,035 crore along with a 50 MW power facility at its Valsad site. The plant has a capacity of 300 tons per day of caustic-chlorine (200 TPD as lye, 100 TPD as flakes). Much of the chlorine output will supply Atul’s joint venture Monochloroacetic Acid project and other chemical firms in South Gujarat.
Product Description
Chlorine (Cl₂) is a highly reactive halogen and a yellow-green diatomic gas at room temperature, produced primarily through the electrolysis of brine in chlor-alkali processes. It possesses strong oxidizing and disinfecting properties, making it an essential chemical across industries. The majority of chlorine is consumed in the production of polyvinyl chloride (PVC), widely used in construction, automotive, and packaging applications. It also plays a vital role in water purification, sanitation, and disinfection due to its antimicrobial effectiveness. Industrially, chlorine is used in the manufacture of solvents, agrochemicals, pharmaceuticals, and pulp and paper products. Despite its toxicity, strict handling measures and regulatory frameworks ensure its safe application, reinforcing its importance as a fundamental chemical in the global industrial supply chain.
Report Coverage
| Key Attributes | Details |
|---|---|
| Product Name | Chlorine |
| Report Features | Exploration of Historical Trends and Market Outlook, Industry Demand, Industry Supply, Gap Analysis, Challenges, Chlorine Price Analysis, and Segment-Wise Assessment. |
| Currency/Units | US$ (Data can also be provided in local currency) or Metric Tons |
| Region/Countries Covered | The current coverage includes analysis at the global and regional levels only. Based on your requirements, we can also customize the report and provide specific information for the following countries: Asia Pacific: China, India, Indonesia, Pakistan, Bangladesh, Japan, Philippines, Vietnam, Thailand, South Korea, Malaysia, Nepal, Taiwan, Sri Lanka, Hongkong, Singapore, Australia, and New Zealand Europe: Germany, France, United Kingdom, Italy, Spain, Russia, Turkey, Netherlands, Poland, Sweden, Belgium, Austria, Ireland, Switzerland, Norway, Denmark, Romania, Finland, Czech Republic, Portugal and Greece North America: United States and Canada Latin America: Brazil, Mexico, Argentina, Columbia, Chile, Ecuador, and Peru Middle East & Africa: Saudi Arabia, UAE, Israel, Iran, South Africa, Nigeria, Oman, Kuwait, Qatar, Iraq, Egypt, Algeria, and Morocco The list of countries presented is not exhaustive. Information on additional countries can be provided if required by the client. |
| Information Covered for Key Suppliers |
|
| Customization Scope | The report can be customized as per the requirements of the customer |
| Report Price and Purchase Option |
Plan A: Monthly Updates - Annual Subscription
Plan B: Quarterly Updates - Annual Subscription
Plan C: Biannually Updates - Annual Subscription
|
| Post-Sale Analyst Support | 360-degree analyst support after report delivery |
| Delivery Format | PDF and Excel through email (We can also provide the editable version of the report in PPT/Word format on special request) |
Key Benefits for Stakeholders:
- IMARC’s report presents a detailed analysis of chlorine pricing, covering global and regional trends, spot prices at key ports, and a breakdown of FOB and CIF prices.
- The study examines factors affecting chlorine price trend, including input costs, supply-demand shifts, and geopolitical impacts, offering insights for informed decision-making.
- The competitive landscape review equips stakeholders with crucial insights into the latest market news, regulatory changes, and technological advancements, ensuring a well-rounded, strategic overview for forecasting and planning.
- IMARC offers various subscription options, including monthly, quarterly, and biannual updates, allowing clients to stay informed with the latest market trends, ongoing developments, and comprehensive market insights. The chlorine price charts ensure our clients remain at the forefront of the industry.
Frequently Asked Questions About the Chlorine Price Index Report
The chlorine prices in June 2026 were 0.37 USD/Kg in Northeast Asia, 0.38 USD/Kg in Europe, and 0.64 USD/Kg in North America.
The chlorine pricing data is updated on a monthly basis.
We provide the pricing data primarily in the form of an Excel sheet and a PDF.
Yes, our report includes a forecast for chlorine prices.
The regions covered include North America, Europe, Asia Pacific, Middle East, and Latin America. Countries can be customized based on the request (additional charges may be applicable).
Yes, we provide both FOB and CIF prices in our report.
Need more help?
- Speak to our experienced analysts for insights on the current market scenarios.
- Include additional segments and countries to customize the report as per your requirement.
- Gain an unparalleled competitive advantage in your domain by understanding how to utilize the report and positively impacting your operations and revenue.
- For further assistance, please connect with our analysts.
 Request Customization
 Inquire Before Buying
 Speak to an Analyst
 Request Brochure
Benefits of Customization
- Personalize this research
- Triangulate with your data
- Get data as per your format and definition
- Gain a deeper dive into a specific application, geography, customer, or competitor
- Any level of personalization
Get in Touch With Us
UNITED STATES
Phone: +1-201-971-6302
INDIA
Phone: +91-120-433-0800
UNITED KINGDOM
Phone: +44-753-714-6104
Email: [email protected]
Client Testimonials


.webp)


Why Choose Us
IMARC offers trustworthy, data-centric insights into commodity pricing and evolving market trends, enabling businesses to make well-informed decisions in areas such as procurement, strategic planning, and investments. With in-depth knowledge spanning more than 1000 commodities and a vast global presence in over 150 countries, we provide tailored, actionable intelligence designed to meet the specific needs of diverse industries and markets.
1000
+Commodities
150
+Countries Covered
3000
+Clients
20
+Industry
Robust Methodologies & Extensive Resources
IMARC delivers precise commodity pricing insights using proven methodologies and a wealth of data to support strategic decision-making.
Subscription-Based Databases
Our extensive databases provide detailed commodity pricing, import-export trade statistics, and shipment-level tracking for comprehensive market analysis.
Primary Research-Driven Insights
Through direct supplier surveys and expert interviews, we gather real-time market data to enhance pricing accuracy and trend forecasting.
Extensive Secondary Research
We analyze industry reports, trade publications, and market studies to offer tailored intelligence and actionable commodity market insights.
Trusted by 3000+ industry leaders worldwide to drive data-backed decisions. From global manufacturers to government agencies, our clients rely on us for accurate pricing, deep market intelligence, and forward-looking insights.