
Chloroform Prices, Trend, Chart, Demand, Market Analysis, News, Historical and Forecast Data Report 2026 Edition
Chloroform Price Trend, Index and Forecast
Track real-time and historical chloroform prices across global regions. Updated monthly with market insights, drivers, and forecasts.
Chloroform Prices June 2026
| Region | Price (USD/Kg) | Latest Movement |
|---|---|---|
| Northeast Asia | 0.4 | -4.8% ↓ Down |
| Europe | 0.87 | -15.5% ↓ Down |
| North America | 0.92 | -26.4% ↓ Down |
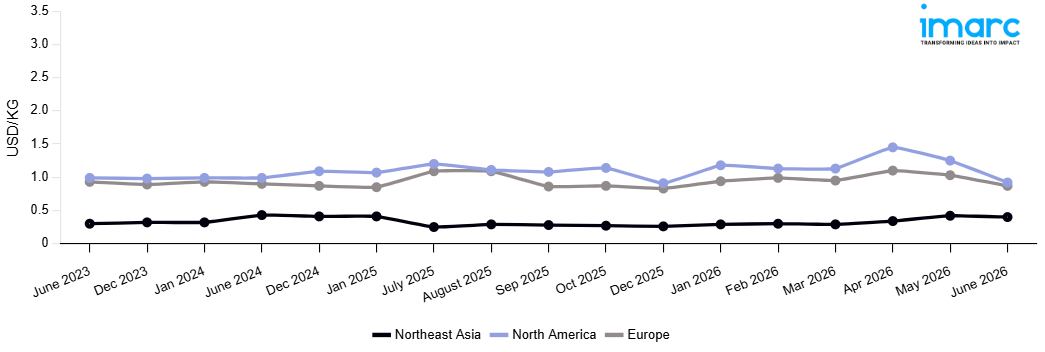
Chloroform Price Index (USD/KG):
The chart below highlights monthly chloroform prices across different regions.
Get Access to Monthly/Quarterly/Yearly Prices, Request Sample
Market Overview Q1 Ending March 2026
Northeast Asia: The chloroform prices in Northeast Asia reached 0.29 USD/KG in March 2026. The upward pricing movement registered between December and March 2026 was 11.5%. The high demand from the pharmaceuticals, refrigerants intermediates, and specialty chemicals manufacturing industries was a key factor in driving robust purchases of chloroform and sustaining a strong positive price environment in Northeast Asia throughout the quarter under review. Higher prices for raw materials, such as methane chlorination and chlorine, at regional plants increased the cost of manufacturing processes and exerted a steady upward pressure on prices in the region’s market environment. The low level of domestic production capacity in the region, owing to planned maintenance shutdowns at chloroform manufacturing plants, tightened supply, leading to increased competition among pharmaceutical and chemical producers in purchasing the product.
Europe: The chloroform prices in Europe reached 0.95 USD/KG in March 2026. The upward pricing movement registered between December and March 2026 was 14.5%. Strong demand from the pharmaceutical intermediate, fluoropolymer, and specialty solvent manufacturing sectors drove robust chloroform procurement activity and reinforced bullish pricing conditions across European markets throughout the review period. Rising upstream chlorine and methane feedstock costs at regional production facilities significantly increased manufacturing expenses and sustained upward pressure on prevailing European market rates during the quarter. Constrained import cargo availability from Asian and North American supplying regions tightened overall European chloroform supply conditions and intensified competition among downstream pharmaceutical and specialty chemical buyers.
North America: The chloroform prices in North America reached 1.13 USD/KG in March 2026. The upward pricing movement registered between December and March 2026 was 24.2%. Healthy purchasing activity for chloroform was observed in North America during the period under review, driven by strong demand from the pharmaceuticals, refrigerants, and specialty chemicals industries. Increased costs of chlorine and methane feedstock at domestic production plants led to higher production costs and provided a strong basis for existing price levels in the North American chloroform market. Reduced domestic chloroform supply due to unscheduled shutdowns at major Gulf Coast plants, limiting supply and increasing competition among downstream buyers.
Market Overview Q4 Ending December 2025
Northeast Asia: The chloroform prices in Northeast Asia reached 0.26 USD/KG in December 2025. The downward pricing movement registered between September and December 2025 was 5.9%. Weaker downstream demand in the HCFC-22 refrigerant, pharmaceutical solvent, and chemical intermediate production sectors, amid muted industrial activity throughout the region, was the main cause of the price reduction. Regional manufacturers' production cost support was further undermined by declining upstream feedstock costs for methanol and chloromethane. Supply side pressure was increased by excess by product output from the manufacturing of chlorinated methane, and competitive discounting techniques to expedite stock clearance were enhanced by high inventory levels among large producers.
Europe: The chloroform prices in Europe reached 0.83 USD/KG in December 2025. The downward pricing movement registered between September and December 2025 was 3.7%. The moderate price decline was primarily attributed to softened demand from the pharmaceutical solvent, PTFE manufacturing, and laboratory reagent sectors amid broader contraction in regional industrial and research activity. Easing upstream methanol and chlorine feedstock costs reduced production cost benchmarks for domestic producers, diminishing baseline pricing support across the supply chain. Adequate supply availability from established chloromethane co production facilities maintained comfortable inventory levels, while regulatory restrictions on certain chloroform applications further dampened consumption volumes.
North America: The chloroform prices in North America reached 0.91 USD/KG in December 2025. The downward pricing movement registered between September and December 2025 was 15.4%. As end market conditions softened and regulatory constraints on the production of ozone depleting substances evolved, the HCFC-22 refrigerant, pharmaceutical solvent, and fluoropolymer intermediate manufacturing sectors saw demand decline sharply, driving significant price reductions. Aggressive downward price revisions were made possible by declining upstream methanol and chlorine feedstock costs, which significantly reduced production cost support for domestic businesses. High stockpile positions among major distributors led to competitive pricing concessions to pique buyer interest, while excess by product output from chlorinated methane facilities placed significant supply side pressure.
Market Overview Q3 Ending September 2025
Northeast Asia: In Northeast Asia, chloroform prices edged lower as downstream demand from pharmaceuticals and agrochemicals remained muted. Ample feedstock availability and steady production rates contributed to a well-supplied market, pushing the chloroform price index down. Export activity also slowed due to weaker international buying interest, while regional industrial activity showed limited momentum. The subdued pace of procurement across chemical intermediates kept market sentiment cautious, resulting in a persistent downward trajectory.
Europe: In Europe, chloroform prices witnessed a significant decline, reflecting one of the sharpest regional adjustments. Ample inventories and lower consumption from the pharmaceutical and solvent sectors pressured the chloroform price index downward. A decline in seasonal demand and subdued construction-related chemical activity compounded bearish sentiment. Additionally, the inflow of competitively priced imports from Asia further intensified supply-side pressures, forcing domestic producers to reduce prices to maintain market share. Weak buying activity across end-use sectors reinforced the steep decline in this quarter.
North America: In North America, chloroform prices softened as consumption from downstream industries remained tepid. The chloroform price index declined amid sufficient domestic production and steady feedstock supply. Demand from pharmaceuticals and refrigerant intermediates was subdued, limiting buying activity. Additionally, competitive import offers placed added pressure on local prices, while industrial demand recovery remained slow. Although declines were less severe compared to Europe, the region still faced weaker procurement activity and cautious distributor behavior, preventing any significant upward momentum in pricing.
Chloroform Price Trend, Market Analysis, and News
IMARC's latest publication, “Chloroform Prices, Trend, Chart, Demand, Market Analysis, News, Historical and Forecast Data Report 2026 Edition,” presents a detailed examination of the chloroform market, providing insights into both global and regional trends that are shaping prices. This report delves into the spot price of chloroform at major ports and analyzes the composition of prices, including FOB and CIF terms. It also presents detailed chloroform prices trend analysis by region, covering North America, Europe, Asia Pacific, Latin America, and Middle East and Africa. The factors affecting chloroform pricing, such as the dynamics of supply and demand, geopolitical influences, and sector-specific developments, are thoroughly explored. This comprehensive report helps stakeholders stay informed with the latest market news, regulatory updates, and technological progress, facilitating informed strategic decision-making and forecasting.
Chloroform Market Analysis
The global chloroform industry size reached USD 7.9 Billion in 2025. By 2034, IMARC Group expects the market to reach USD 10.7 Billion, at a projected CAGR of 3.28% during 2026-2034. Market expansion is supported by rising pharmaceutical production, growing use of chloroform in refrigerant intermediates, and stable demand from agrochemicals and chemical processing, with ongoing industrial applications ensuring steady growth across global regions.
Latest developments in the chloroform industry:
- May 2025: LANXESS, through its subsidiary Saltigo, introduced a new range of sustainable chloroformates at Chemspec Europe 2025, produced using renewable energy and green chlorine technology. Since chloroform is a critical feedstock for chloroformates, this initiative directly impacts the chloroform value chain by driving demand toward lower-carbon derivatives and reinforcing its role in pharmaceutical and agrochemical manufacturing.
- October 2022: Olin Corporation announced that methylene chloride and chloroform production at its Stade, Germany facility would cease by the third quarter of 2023. However, the company will continue to produce the products at its Freeport, Texas facility.
- August 2020: The European Chemical Industry Council (CEFIC) announced the expansion of its activities with a new sector group addressing chloroformates. The new safety and advocacy-driven chloroformates cluster will advance authority understanding and worker safety on this class of toxic and reactive chemical substances used as intermediates in the manufacture of various fine chemicals and as reagents in plastic production. The group is composed of BASF, Framochem/ Vandemark and Saltigo GmbH (LANXESS AG).
Product Description
Chloroform (CHCl₃) is a colorless, volatile, and sweet-smelling organic compound classified as a trihalomethane. It is produced primarily through the chlorination of methane or methyl chloride. Chemically, chloroform is non-flammable and serves as an effective solvent for fats, oils, rubber, alkaloids, and resins. Industrially, it is an essential intermediate in the production of hydrochlorofluorocarbon-22 (HCFC-22) used in refrigerants. The compound also finds applications in pharmaceuticals, agrochemicals, and dyes, where its solvent properties are crucial for manufacturing processes. Despite concerns regarding toxicity and environmental impact, chloroform continues to play a critical role in specialized industrial applications, owing to its solvency, volatility, and chemical reactivity.
Report Coverage
| Key Attributes | Details |
|---|---|
| Product Name | Chloroform |
| Report Features | Exploration of Historical Trends and Market Outlook, Industry Demand, Industry Supply, Gap Analysis, Challenges, Chloroform Price Analysis, and Segment-Wise Assessment. |
| Currency/Units | US$ (Data can also be provided in local currency) or Metric Tons |
| Region/Countries Covered | The current coverage includes analysis at the global and regional levels only. Based on your requirements, we can also customize the report and provide specific information for the following countries: Asia Pacific: China, India, Indonesia, Pakistan, Bangladesh, Japan, Philippines, Vietnam, Thailand, South Korea, Malaysia, Nepal, Taiwan, Sri Lanka, Hongkong, Singapore, Australia, and New Zealand Europe: Germany, France, United Kingdom, Italy, Spain, Russia, Turkey, Netherlands, Poland, Sweden, Belgium, Austria, Ireland, Switzerland, Norway, Denmark, Romania, Finland, Czech Republic, Portugal and Greece North America: United States and Canada Latin America: Brazil, Mexico, Argentina, Columbia, Chile, Ecuador, and Peru Middle East & Africa: Saudi Arabia, UAE, Israel, Iran, South Africa, Nigeria, Oman, Kuwait, Qatar, Iraq, Egypt, Algeria, and Morocco The list of countries presented is not exhaustive. Information on additional countries can be provided if required by the client. |
| Information Covered for Key Suppliers |
|
| Customization Scope | The report can be customized as per the requirements of the customer |
| Report Price and Purchase Option |
Plan A: Monthly Updates - Annual Subscription
Plan B: Quarterly Updates - Annual Subscription
Plan C: Biannually Updates - Annual Subscription
|
| Post-Sale Analyst Support | 360-degree analyst support after report delivery |
| Delivery Format | PDF and Excel through email (We can also provide the editable version of the report in PPT/Word format on special request) |
Key Benefits for Stakeholders:
- IMARC’s report presents a detailed analysis of chloroform pricing, covering global and regional trends, spot prices at key ports, and a breakdown of Ex Works, FOB, and CIF prices.
- The study examines factors affecting chloroform price trend, including raw material costs, supply-demand shifts, geopolitical impacts, and industry developments, offering insights for informed decision-making.
- The competitive landscape review equips stakeholders with crucial insights into the latest market news, regulatory changes, and technological advancements, ensuring a well-rounded, strategic overview for forecasting and planning.
- IMARC offers various subscription options, including monthly, quarterly, and biannual updates, allowing clients to stay informed with the latest market trends, ongoing developments, and comprehensive market insights. The chloroform price charts ensure our clients remain at the forefront of the industry.
Frequently Asked Questions About the Chloroform Prices Report
The chloroform prices in June 2026 were 0.4 USD/KG in Northeast Asia, 0.87 USD/KG in Europe, and 0.92 USD/KG in North America.
The chloroform pricing data is updated on a monthly basis.
We provide the pricing data primarily in the form of an Excel sheet and a PDF.
Yes, our report includes a forecast for chloroform prices.
The regions covered include North America, Europe, Asia Pacific, Middle East, and Latin America. Countries can be customized based on the request (additional charges may be applicable).
Yes, we provide both FOB and CIF prices in our report.
Need more help?
- Speak to our experienced analysts for insights on the current market scenarios.
- Include additional segments and countries to customize the report as per your requirement.
- Gain an unparalleled competitive advantage in your domain by understanding how to utilize the report and positively impacting your operations and revenue.
- For further assistance, please connect with our analysts.
 Request Customization
 Inquire Before Buying
 Speak to an Analyst
 Request Brochure
Benefits of Customization
- Personalize this research
- Triangulate with your data
- Get data as per your format and definition
- Gain a deeper dive into a specific application, geography, customer, or competitor
- Any level of personalization
Get in Touch With Us
UNITED STATES
Phone: +1-201-971-6302
INDIA
Phone: +91-120-433-0800
UNITED KINGDOM
Phone: +44-753-714-6104
Email: [email protected]
Client Testimonials


.webp)


Why Choose Us
IMARC offers trustworthy, data-centric insights into commodity pricing and evolving market trends, enabling businesses to make well-informed decisions in areas such as procurement, strategic planning, and investments. With in-depth knowledge spanning more than 1000 commodities and a vast global presence in over 150 countries, we provide tailored, actionable intelligence designed to meet the specific needs of diverse industries and markets.
1000
+Commodities
150
+Countries Covered
3000
+Clients
20
+Industry
Robust Methodologies & Extensive Resources
IMARC delivers precise commodity pricing insights using proven methodologies and a wealth of data to support strategic decision-making.
Subscription-Based Databases
Our extensive databases provide detailed commodity pricing, import-export trade statistics, and shipment-level tracking for comprehensive market analysis.
Primary Research-Driven Insights
Through direct supplier surveys and expert interviews, we gather real-time market data to enhance pricing accuracy and trend forecasting.
Extensive Secondary Research
We analyze industry reports, trade publications, and market studies to offer tailored intelligence and actionable commodity market insights.
Trusted by 3000+ industry leaders worldwide to drive data-backed decisions. From global manufacturers to government agencies, our clients rely on us for accurate pricing, deep market intelligence, and forward-looking insights.