
Coal Tar Prices, Trend, Chart, Demand, Market Analysis, News, Historical and Forecast Data Report 2025 Edition
Coal Tar Price Trend, Index and Forecast
Track the latest insights on coal tar price trend and forecast with detailed analysis of regional fluctuations and market dynamics across North America, Latin America, Central Europe, Western Europe, Eastern Europe, Middle East, North Africa, West Africa, Central and Southern Africa, Central Asia, Southeast Asia, South Asia, East Asia, and Oceania.
Coal Tar Prices Outlook Q3 2025:
- USA: USD 452/MT
- China: USD 472/MT
- Canada: USD 477/MT
- South Korea: USD 521/MT
- France: USD 518/MT
Coal Tar Price Chart

Get real-time access to monthly/quarterly/yearly prices Request Sample
During the third quarter of 2025, the coal tar prices in the USA reached 452 USD/MT in September. Prices registered a moderate increase relative to the prior quarter, driven mainly by tighter domestic feedstock availability and stronger demand from downstream asphalt and chemical specialties. Buyers adjusted procurement timing to manage inventory risk, which supported spot premiums while term contracts lagged. Freight and inland logistics constraints contributed to upward pressure on landed costs in key refining hubs.
During the third quarter of 2025, the coal tar prices in China reached 472 USD/MT in September. The quarter saw a moderate increase in values as producers curtailed runs to manage margins amid higher crude and coal feedstock replacement costs. Domestic demand from carbon black, pitch and chemical intermediates remained resilient, and restocking ahead of seasonal maintenance cycles amplified buying interest. Export parity tightened for some coastal producers due to regional shipping firming and stronger competing demand in neighboring markets.
During the third quarter of 2025, the coal tar prices in Canada reached 477 USD/MT in September. Prices in Canada recorded a notable increase during the quarter, largely reflecting constrained regional supply following planned maintenance at several conversion plants and limited short-term availability of heavy petroleum residues. Regional logistics and cross-border export dynamics raised delivered costs to certain industrial clusters, prompting buyers to secure earlier shipments.
During the third quarter of 2025, the coal tar prices in South Korea reached 521 USD/MT in September. Prices in South Korea experienced a marginal decline compared with the previous quarter, reflecting a modest easing of feedstock premiums and a short-term correction after earlier run-ups. Downstream demand softened slightly as some petrochemical processors delayed inventory build to assess global export competitiveness. Improved availability of alternative heavy fractions and competitive imports into regional ports reduced immediate upward pressure.
During the third quarter of 2025, the coal tar prices in France reached 518 USD/MT in September. French coal tar prices recorded a mild increase during the quarter as European refining margins improved and domestic producers tempered operations in response to environmental compliance costs. Demand from road paving and specialty binder manufacturers showed steady seasonal uptake, supporting higher local quotations.
Coal Tar Prices Outlook Q2 2025
- USA: USD 442/MT
- China: USD 460/MT
- Canada: USD 462/MT
- South Korea: USD 530/MT
- France: USD 510/MT
During the second quarter of 2025, the coal tar prices in the USA reached 442 USD/MT in June. As per the coal tar price chart, while coal prices fluctuated modestly through Q2, coal tar maintained stability, supported by its industrial niche and demand drivers that did not move in lockstep with thermal coal markets. Besides, summer outage schedules cut coke production days, trimming tar offtake but also reducing supply.
During the second quarter of 2025, the coal tar prices in China reached 460 USD/MT in June. As petroleum coke prices declined sharply, the overall input cost for prebaked anodes dropped, weakening the pricing power of coal tar pitch suppliers. This pushed coal tar pitch prices lower to maintain equilibrium. Besides, coal tar pitch supply was stable and demand did not pick up, causing an oversupply situation relative to demand. This imbalance drove prices further down.
During the second quarter of 2025, coal tar prices in Canada reached 462 USD/MT in June. The reduced coal tar oil exports and imports from the US affected Canada both as a supplier and a buyer, creating price instability and increased sensitivity to regional supply-demand shifts. The elevated US demand for Canadian coal tar oil likely tightened domestic supply, which pushed prices upward in Canada, particularly for domestic consumers.
During the second quarter of 2025, the coal tar prices in South Korea reached 530 USD/MT in June. Coal tar prices in South Korea were influenced by a combination of domestic supply limitations, fluctuating demand from downstream sectors, and global market dynamics. One of the primary drivers was reduced output from domestic coke producers, owing to lower steel production during the quarter. This tightening of supply led to constrained availability of coal tar, pushing prices upward.
During the second quarter of 2025, the coal tar prices in France reached 510 USD/MT in June. Construction and roofing sectors in France maintained predictable consumption levels, offering a supportive base. Besides, high natural gas and electricity costs in Europe elevated production and processing expenditures for coal tar. Moreover, EU sustainability mandates under the European Green Deal and broader regulatory regimes drove investment in cleaner processing and waste handling. That increased operational costs for coal tar producers and processors.
Coal Tar Prices Outlook Q1 2025
- USA: USD 435/MT
- China: USD 470/MT
- Canada: USD 475/MT
- South Korea: USD 550/MT
- France: USD 490/MT
During the first quarter of 2025, the coal tar prices in the USA reached USD 435/MT in March. Prices witnessed moderate fluctuations driven by shifts in domestic steel production and coke oven activity. Regulatory scrutiny around environmental compliance, especially in handling hazardous by-products, also influenced production levels. Meanwhile, demand remained steady from key downstream sectors such as aluminium smelting and graphite electrode manufacturing. The quarter also saw logistical challenges due to winter disruptions in parts of the Midwest, slightly affecting coal tar transportation and regional supply dynamics.
During the first quarter of 2025, the coal tar prices in China reached USD 470/MT in March. Prices remained volatile during the quarter, primarily influenced by declining coking coal costs, reduced steel mill operations, and oversupply in the domestic market. Environmental regulations and weak demand from downstream sectors like aluminium and carbon black further pressured prices. However, intermittent buying interest for restocking supported brief recoveries. Overall, market sentiment stayed cautious, with buyers closely monitoring industrial production and policy signals from the Chinese government regarding infrastructure and heavy industry investment.
During the first quarter of 2025, the coal tar prices in Canada reached USD 475/MT in March. Early in 2025, output problems at large refineries, including interruptions from planned maintenance and fires, resulted in limited supply conditions for the European coal tar market. Demand did not increase dramatically, but it did stay constant, particularly from companies associated with agriculture. Prices were high due to this balance between limited supply and steady demand.
During the first quarter of 2025, the coal tar prices in the South Korea reached USD 550/MT in March. The pricing trend remained relatively stable, reflecting steady demand from domestic aluminium smelting operations, particularly in Quebec, which is home to several large-scale smelters. Canada’s coal tar consumption was also shaped by environmental compliance under federal regulations and shifts in export-import activity, influencing supply chain costs and availability
During the first quarter of 2025, the coal tar prices in the France reached USD 490/MT in March. The market showed steady growth driven by demand from the aluminium smelting and electrode manufacturing sectors. Stringent environmental regulations under REACH (Registration, Evaluation, Authorisation and Restriction of Chemicals) influenced production and usage.
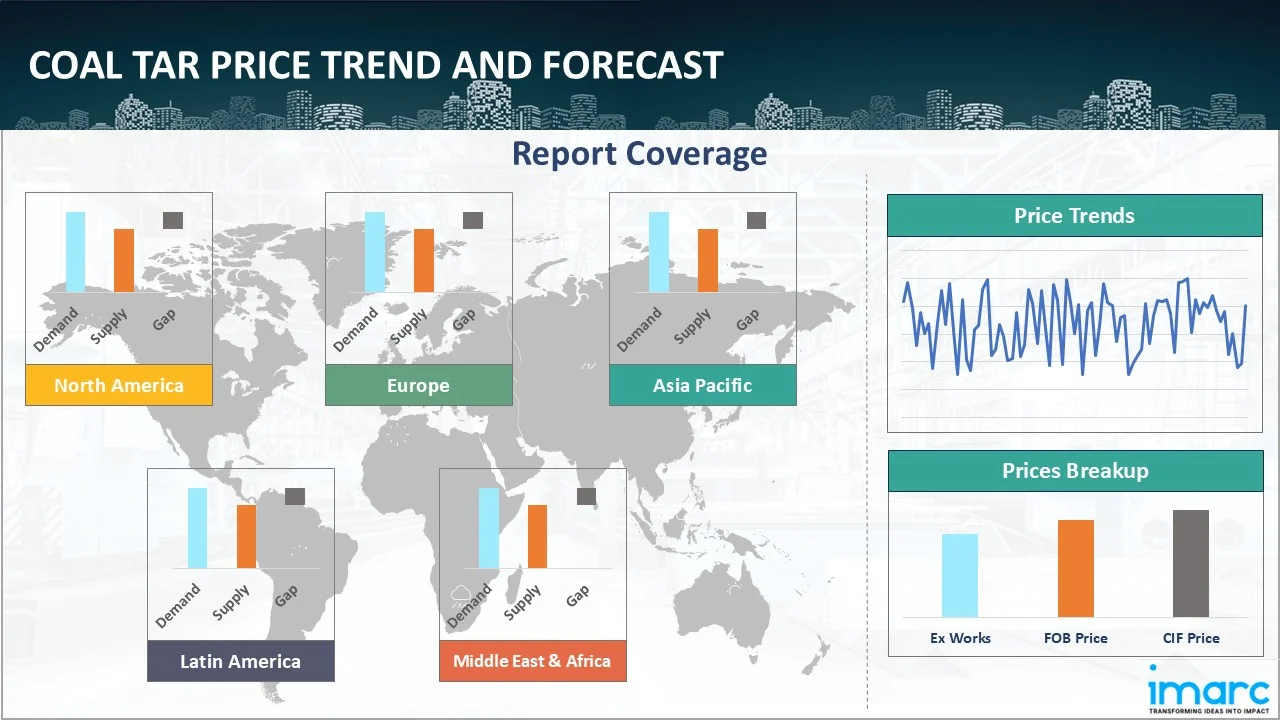
Regional Coverage
The report provides a detailed analysis of the market across different regions, each with unique pricing dynamics influenced by localized market conditions, supply chain intricacies, and geopolitical factors. This includes price trends, price forecast and supply and demand trends for each region, along with spot prices by major ports. The report also provides coverage of FOB and CIF prices, as well as the key factors influencing coal tar prices.
Europe Coal Tar Price Trend
Q3 2025:
The coal tar price index showed firmer pricing driven by constrained refining outputs and elevated feedstock premiums. Supply reductions due to scheduled maintenance and environmental compliance curtailed immediate availability, pushing buyers to compete for remaining cargoes. Domestic industrial demand from roadwork, specialty binders and carbon products remained steady, prompting restocking by processors mindful of short-term tightness. Cross-border trade flows were shaped by freight capacity constraints and port handling delays, which raised landed cost expectations for marginal cargoes.
Q2 2025:
In the second quarter of 2025, coal tar prices in Europe were influenced by a combination of supply-side disruptions and sluggish downstream demand. Tighter feedstock availability from coke oven operators amid decarbonization measures in the steel industry further constrained coal tar supply in the region. On the demand side, consumption from key downstream sectors such as aluminum smelting and graphite electrode manufacturing remained weak. Moreover, the construction and automotive sectors, which influence demand for related downstream chemicals, showed only marginal recovery, offering limited support to market fundamentals. As a result, despite supply constraints, overall market sentiment remained subdued, and coal tar prices exhibited only marginal fluctuations during Q2 2025.
Q1 2025:
As per the coal tar price index, Europe experienced a downward trend, influenced by subdued industrial activity and reduced steel production in key markets such as Germany and the UK. The shift towards cleaner energy sources and a slowdown in coal-based industries placed downward pressure on coal tar availability and pricing. Regulatory measures focused on environmental compliance also influenced operational costs and supply dynamics.
This analysis can be extended to include detailed coal tar price information for a comprehensive list of countries.
| Region | Countries Covered |
|---|---|
| Europe | Germany, France, United Kingdom, Italy, Spain, Russia, Turkey, Netherlands, Poland, Sweden, Belgium, Austria, Ireland, Switzerland, Norway, Denmark, Romania, Finland, Czech Republic, Portugal, and Greece, among other European countries. |
North America Coal Tar Price Trend
Q3 2025:
In the third quarter of 2025, the region experienced upward pressure as domestic feedstock availability tightened and downstream consumption held firm. Refinery yield management and selective conversions reduced volumes of heavy residues available for coal tar production, prompting buyers to secure cargoes earlier. Logistics bottlenecks across key corridors increased delivered costs and incentivized local sourcing where possible. Buyer behavior shifted toward smaller but more frequent purchases to manage working capital, which maintained stronger spot liquidity. Overall, market sentiment was cautiously bullish due to the combined effects of supply discipline and steady industrial demand.
Q2 2025:
As evident by the coal tar price index, the tightening of supply put upward pressure on domestic coal tar oil prices, especially for downstream industries such as aluminum smelting and specialty chemicals. Besides, imports fell sharply in the US, and exports also dropped, which partially offset the supply crunch. Hence, more products stayed within domestic borders than would have otherwise been exported. This blunted the potential for a more dramatic price increase in North America, as domestic producers had fewer international outlets for their excess inventory.
Q1 2025:
North America showed a moderate trend, supported by a recovery in industrial demand and tighter coal tar supply. Increased activity in the aluminium and graphite electrode industries contributed to a firmer pricing environment. Additionally, improvements in feedstock coal availability and a gradual stabilization of inventories helped reduce earlier volatility in the market
Specific coal tar historical data within the United States and Canada can also be provided.
| Region | Countries Covered |
|---|---|
| North America | United States and Canada |
Middle East and Africa Coal Tar Price Trend
Q3 2025:
The report explores the coal tar trends and coal tar price chart in the Middle East and Africa, considering factors like regional industrial growth, the availability of natural resources, and geopolitical tensions that uniquely influence market prices.
Q2 2025:
As per the coal tar price chart, the prices in the Middle East and Africa fluctuated due to a complex interplay of factors, primarily driven by supply chain disruptions, seasonal demand shifts, and geopolitical influences.
| Region | Countries Covered |
|---|---|
| Middle East & Africa | Saudi Arabia, UAE, Israel, Iran, South Africa, Nigeria, Oman, Kuwait, Qatar, Iraq, Egypt, Algeria, and Morocco, among other Middle Eastern and African countries. |
Asia Pacific Coal Tar Price Trend
Q3 2025:
In the third quarter of 2025, the Asia Pacific region displayed mixed demand patterns with selective supply constraints amplifying price signals. Major consuming markets maintained steady industrial offtake for carbon, electrode and binder applications, while some coastal producers reduced runs for margin optimization and environmental reasons. Import flows were sensitive to shipping rates and port congestion, causing variations in landed prices across subregions. Buyers in importing countries adjusted procurement timing to mitigate volatility, leading to stronger spot premiums in markets where domestic output fell short of demand.
Q2 2025:
China is the largest producer and consumer of coal tar pitch in the Asia Pacific region. As such, price movements in China heavily influenced neighboring markets, especially in Southeast Asia, South Asia, and East Asia (e.g., Japan, Korea, India, Vietnam). Coal tar pitch prices in China dropped, setting a new regional pricing reference. Hence, buyers in neighboring countries adjusted expectations downward, pushing for lower prices from domestic and Chinese suppliers alike. This applied deflationary pressure across the regional coal tar pitch market. Moreover, weak downstream demand aligned with falling costs, leading to a supply-demand imbalance and contributing to the regional decline in coal tar pitch prices.
Q1 2025:
In Asia-Pacific, coal tar prices remained under pressure due to rising feedstock costs and weaker demand from downstream industries. Key markets such as China, India, and Southeast Asia witnessed moderate price fluctuations as coal and coke supply adapted to slower industrial activity. Export-driven suppliers faced limited pricing support, despite brief periods of restocking. Overall, the region's coal tar market was marked by continued oversupply and cautious purchasing behaviour, with a gradual recovery anticipated as manufacturing and infrastructure sectors regain momentum.
This coal tar price analysis can be expanded to include a comprehensive list of countries within the region.
| Region | Countries Covered |
|---|---|
| Asia Pacific | China, India, Indonesia, Pakistan, Bangladesh, Japan, Philippines, Vietnam, Thailand, South Korea, Malaysia, Nepal, Taiwan, Sri Lanka, Hongkong, Singapore, Australia, and New Zealand, among other Asian countries. |
Latin America Coal Tar Price Trend
Q3 2025:
Latin America's coal tar market is predominantly influenced by its rich natural reserves, particularly in countries like Chile and Brazil. However, political instability and inconsistent regulatory frameworks can lead to significant volatility in coal tar prices.
Q2 2025:
Infrastructure challenges and logistical inefficiencies often impact the supply chain, affecting the region's ability to meet international demand consistently. Moreover, the coal tar price index, economic fluctuations, and currency devaluation are critical factors that need to be considered when analyzing coal tar pricing trends in this region.
Q1 2025:
Latin America's coal tar market is predominantly influenced by its rich natural reserves, particularly in countries like Chile and Brazil. However, political instability and inconsistent regulatory frameworks can lead to significant volatility in coal tar prices. Infrastructure challenges and logistical inefficiencies often impact the supply chain, affecting the region's ability to meet international demand consistently. Moreover, the coal tar price index, economic fluctuations, and currency devaluation are critical factors that need to be considered when analyzing coal tar pricing trends in this region.
This comprehensive review can be extended to include specific countries within the region.
| Region | Countries Covered |
|---|---|
| Latin America | Brazil, Mexico, Argentina, Columbia, Chile, Ecuador, and Peru, among other Latin America countries. |
Coal Tar Pricing Report, Market Analysis, and News
IMARC's latest publication, “Coal Tar Prices, Trend, Chart, Demand, Market Analysis, News, Historical and Forecast Data Report 2025 Edition,” presents a detailed examination of the coal tar market, providing insights into both global and regional trends that are shaping prices. This report delves into the spot price of coal tar at major ports and analyzes the composition of prices, including FOB and CIF terms. It also presents detailed coal tar prices trend analysis by region, covering North America, Europe, Asia Pacific, Latin America, and Middle East and Africa. The factors affecting coal tar pricing, such as the dynamics of supply and demand, geopolitical influences, and sector-specific developments, are thoroughly explored. This comprehensive report helps stakeholders stay informed with the latest market news, regulatory updates, and technological progress, facilitating informed strategic decision-making and forecasting.
Coal Tar Industry Analysis
The global coal tar market size reached USD 17.09 Billion in 2025. By 2034, IMARC Group expects the market to reach USD 24.70 Billion, at a projected CAGR of 4.18% during 2026-2034. The market is primarily driven by the sustained demand from road construction and specialty binder applications, stable industrial consumption for carbon and electrode manufacture, feedstock constraints at some refineries, and logistical dynamics affecting landed costs.
Latest News and Developments:
- January 2025: Rain CII Carbon (Vizag) Ltd., a subsidiary of Rain Carbon Inc., began developing a coal tar distillation and pitch-upgrading facility in Anakapalli, Andhra Pradesh SEZ. The project is expected to support India’s aluminum, graphite, and battery industries, with all environmental approvals secured.
Product Description
Coal tar is a thick, black, and viscous liquid obtained as a byproduct during the carbonization of coal in coke ovens under high temperatures in the absence of air. It is a complex chemical mixture containing aromatic hydrocarbons, phenols, polycyclic aromatic hydrocarbons (PAHs), and various heterocyclic compounds.
Coal tar is widely used across multiple industries due to its unique chemical properties. Industrially, it is processed into coal-tar pitch, which is utilized in roofing, paving, and aluminum smelting. It also serves as a base for manufacturing dyes, resins, synthetic fibers, and other chemical intermediates. In the pharmaceutical sector, coal tar is used in low concentrations to treat skin conditions such as psoriasis, eczema, and seborrheic dermatitis due to its anti-inflammatory and anti-itch properties.
However, with proper handling protocols in place, coal tar remains a strategically important material, valued for its broad industrial applications and consistent performance across key sectors.
Report Coverage
| Key Attributes | Details |
|---|---|
| Product Name | Coal Tar |
| Report Features | Exploration of Historical Trends and Market Outlook, Industry Demand, Industry Supply, Gap Analysis, Challenges, Ammonium Perchlorate Price Analysis, and Segment-Wise Assessment. |
| Currency/Units | US$ (Data can also be provided in local currency) or Metric Tons |
| Region/Countries Covered | The current coverage includes analysis at the global and regional levels only. Based on your requirements, we can also customize the report and provide specific information for the following countries: Asia Pacific: China, India, Indonesia, Pakistan, Bangladesh, Japan, Philippines, Vietnam, Thailand, South Korea, Malaysia, Nepal, Taiwan, Sri Lanka, Hongkong, Singapore, Australia, and New Zealand* Europe: Germany, France, United Kingdom, Italy, Spain, Russia, Turkey, Netherlands, Poland, Sweden, Belgium, Austria, Ireland, Switzerland, Norway, Denmark, Romania, Finland, Czech Republic, Portugal and Greece* North America: United States and Canada Latin America: Brazil, Mexico, Argentina, Columbia, Chile, Ecuador, and Peru* Middle East & Africa: Saudi Arabia, UAE, Israel, Iran, South Africa, Nigeria, Oman, Kuwait, Qatar, Iraq, Egypt, Algeria, and Morocco* *The list of countries presented is not exhaustive. Information on additional countries can be provided if required by the client. |
| Information Covered for Key Suppliers |
|
| Customization Scope | The report can be customized as per the requirements of the customer |
| Report Price and Purchase Option |
Plan A: Monthly Updates - Annual Subscription
Plan B: Quarterly Updates - Annual Subscription
Plan C: Biannually Updates - Annual Subscription
|
| Post-Sale Analyst Support | 360-degree analyst support after report delivery |
| Delivery Format | PDF and Excel through email (We can also provide the editable version of the report in PPT/Word format on special request) |
Key Benefits for Stakeholders:
- IMARC’s report presents a detailed analysis of coal tar pricing, covering global and regional trends, spot prices at key ports, and a breakdown of FOB and CIF prices.
- The study examines factors affecting coal tar price trend, including input costs, supply-demand shifts, and geopolitical impacts, offering insights for informed decision-making.
- The competitive landscape review equips stakeholders with crucial insights into the latest market news, regulatory changes, and technological advancements, ensuring a well-rounded, strategic overview for forecasting and planning.
- IMARC offers various subscription options, including monthly, quarterly, and biannual updates, allowing clients to stay informed with the latest market trends, ongoing developments, and comprehensive market insights. The coal tar price charts ensure our clients remain at the forefront of the industry.
Need more help?
- Speak to our experienced analysts for insights on the current market scenarios.
- Include additional segments and countries to customize the report as per your requirement.
- Gain an unparalleled competitive advantage in your domain by understanding how to utilize the report and positively impacting your operations and revenue.
- For further assistance, please connect with our analysts.
 Request Customization
 Inquire Before Buying
 Speak to an Analyst
 Request Brochure
Benefits of Customization
- Personalize this research
- Triangulate with your data
- Get data as per your format and definition
- Gain a deeper dive into a specific application, geography, customer, or competitor
- Any level of personalization
Get in Touch With Us
UNITED STATES
Phone: +1-201-971-6302
INDIA
Phone: +91-120-433-0800
UNITED KINGDOM
Phone: +44-753-714-6104
Email: sales@imarcgroup.com
Client Testimonials


.webp)


Why Choose Us
IMARC offers trustworthy, data-centric insights into commodity pricing and evolving market trends, enabling businesses to make well-informed decisions in areas such as procurement, strategic planning, and investments. With in-depth knowledge spanning more than 1000 commodities and a vast global presence in over 150 countries, we provide tailored, actionable intelligence designed to meet the specific needs of diverse industries and markets.
1000
+Commodities
150
+Countries Covered
3000
+Clients
20
+Industry
Robust Methodologies & Extensive Resources
IMARC delivers precise commodity pricing insights using proven methodologies and a wealth of data to support strategic decision-making.
Subscription-Based Databases
Our extensive databases provide detailed commodity pricing, import-export trade statistics, and shipment-level tracking for comprehensive market analysis.
Primary Research-Driven Insights
Through direct supplier surveys and expert interviews, we gather real-time market data to enhance pricing accuracy and trend forecasting.
Extensive Secondary Research
We analyze industry reports, trade publications, and market studies to offer tailored intelligence and actionable commodity market insights.
Trusted by 3000+ industry leaders worldwide to drive data-backed decisions. From global manufacturers to government agencies, our clients rely on us for accurate pricing, deep market intelligence, and forward-looking insights.