COD Market Report by Species (Atlantic Cod Fish, Pacific Cod Fish, Greenland Cod Fish, and Others), Source (Farmed, Wild Capture), Product Type (Fresh, Canned, Frozen, and Others), Distribution Channel (Institutional, Retail), and Region 2025-2033
Cod Market Size:
The global COD market size reached USD 11.4 Billion in 2024. Looking forward, IMARC Group expects the market to reach USD 16.5 Billion by 2033, exhibiting a growth rate (CAGR) of 4.22% during 2025-2033. The increasing seafood protein demand, employment of sustainable fishing practices, rising product popularity through different culinary traditions around the world, nutritional benefits such as a high content of omega-3 fatty acids associated with its consumption, and the hike in aquaculture production activities to meet global consumption are influencing the market growth.
|
Report Attribute
|
Key Statistics
|
|---|---|
|
Base Year
|
2024
|
|
Forecast Years
|
2025-2033
|
|
Historical Years
|
2019-2024
|
|
Market Size in 2024
|
USD 11.4 Billion |
|
Market Forecast in 2033
|
USD 16.5 Billion |
| Market Growth Rate 2025-2033 | 4.22% |
Cod Market Analysis:
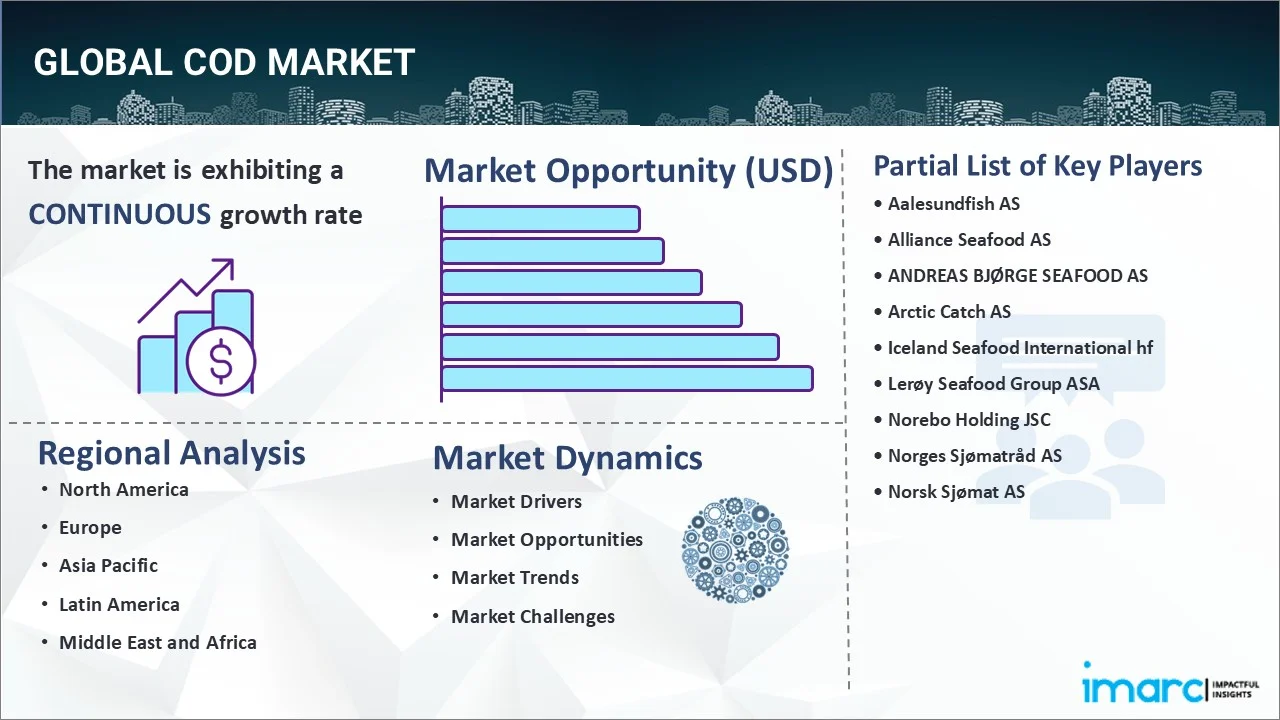
- Major Market Drivers: The largescale consumer demand for seafood protein due to its associated health benefits such as high omega-3 content and extensive uses in different cuisines around the globe is one of the key factors driving cod market demand. Besides this, sustainability practices and certifications such as the Marine Stewardship Council (MSC) that provide assurance to consumers about responsible methods of fishing and ethical sourcing are further boosting the market growth.
- Key Market Trends: Innovative advancements in methods of fishing and processing, backed by effective technology that supports quality from catch to consumer are aiding in market expansion. Moreover, rising consumer inclination towards frozen cod products due to convenience, longer shelf life, and the ability to meet demand during any time of the year irrespective of seasonal fluctuations in fresh fish stocks is another one of the crucial cod market trends.
- Geographical Trends: The intake of cod still stays highest in North America and Europe. This is because of the rich traditions of the local cuisine and due to specific requests from local consumers seeking sustainable seafood. Besides that, these regions also have superior distribution networks that ensure an efficient supply of fresh and frozen cod products within the respective markets.
- Competitive Landscape: Some of the major market players in the cod industry include Aalesundfish AS, Alliance Seafood AS, ANDREAS BJØRGE SEAFOOD AS, Arctic Catch AS, Iceland Seafood International hf, Lerøy Seafood Group ASA, Norebo Holding JSC, Norges Sjømatråd AS, and Norsk Sjømat AS among many others.
- Challenges and Opportunities: Presently, major issues concerning the sustainability of fisheries, environmental conditions, and institutional pressures pose challenging situations for the cod market. However, the cod market business opportunity lies in more sustainable fishing methods, technological innovation, and market differentiation through certification and consumer education about responsible seafood choice.

Cod Market Trends:
The adoption of sustainable practices
Sustainability has become a critical factor within this burgeoning industry. Overfishing and environmental concerns throughout history have now led to very strict regulatory measures in order to ensure sustainability in the fishing industry. Cod stocks have been depleted in several areas due to overfishing in the past, thus introducing quotas, catch limits, and rigorous managerial controls. Measures are been taken to ensure a healthy fish population, the conservation of marine ecosystems, and the long-term viability of fisheries. In addition to this, retailers are also now giving more priority to sustainably sourced cod that are certified by organizations like the MSC. This ensures responsible sea fishing practices and boosts cod market revenue.
Ongoing technological advancements in fishing and processing
Consistent technological innovation in the cod industry has impacted new fishing techniques and processes. Inventions of sonar technology, satellite tracking systems, and better designs of fishing vessels have operationalized activities effectively and efficiently. These help fishermen pinpoint the places where stocks are found more accurately, thus reducing bycatch and lessening the extent of impact on the environment. Moreover, improvements in onboard processing and storage facilities help ensure the optimum handling and preservation of cod to give maximum quality from catch to market. Superior processing techniques enabling the production of value-added products such as fillets, portions, and ready-to-cook items according to varied consumer preferences and culinary uses are contributing to the cod market size.
Evolving consumer preferences
Changing consumer preferences and diets are major driving forces behind the global cod market. Increasing product demand can be attributed to its mild flavor and firm flesh, which makes it easy to incorporate in a great variety of cuisines. In countries with high per capita seafood consumption, such as North America and European nations, cod holds a prominent position in the market, particularly due to its protein content and omega-3 fatty acids. With present health trends reaching toward protein-rich and healthy foods, cod fits perfectly into these expectations and recommended daily allowances for overall good health. Other than that, emerging trends towards innovative cultural and culinary practices, spurring the demand for certain product variants, e.g., salted cod for special traditional recipes like bacalhau in Portugal or fish and chips in the United Kingdom are propelling the market growth.
Cod Market Segmentation:
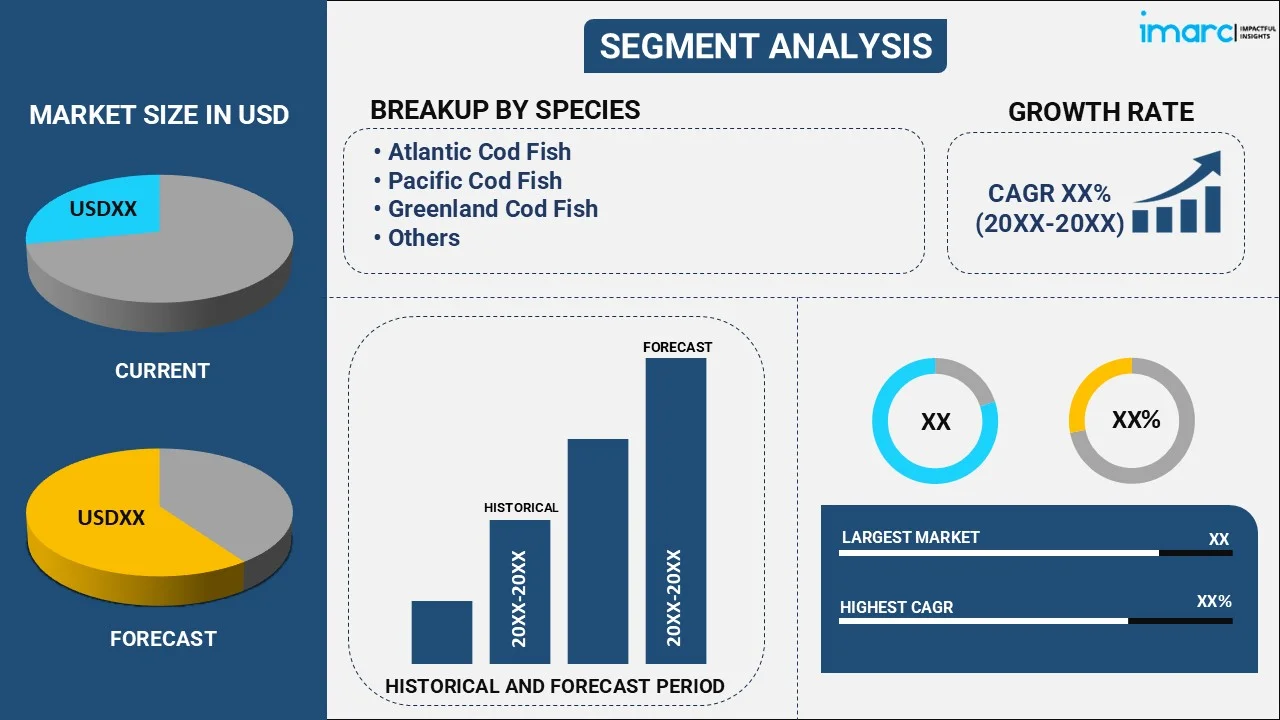
IMARC Group provides an analysis of the key trends in each segment of the market, along with forecasts at the global, regional, and country levels for 2025-2033. Our report has categorized the market based on species, source, product type, and distribution channel.
Breakup by Species:

- Atlantic Cod Fish
- Pacific Cod Fish
- Greenland Cod Fish
- Others
Atlantic cod fish accounts for the majority of the market share
The report has provided a detailed breakup and analysis of the market based on the species. This includes Atlantic, Pacific, Greenland, and other cod fishes. According to the report, Atlantic cod fish represented the largest segment.
The demand for Atlantic cod fish is also bolstered by its historical significance in regional cuisines and cultural traditions across Europe and North America. Renowned for its mild, flaky texture and versatile culinary applications, Atlantic cod remains a staple in dishes like fish and chips, bacalhau, and traditional stews. Its longstanding popularity in these cuisines contributes to sustained consumer demand, particularly in restaurants and retail markets catering to traditional and contemporary tastes alike. Moreover, this species' reputation as a lean source of protein rich in vitamins and minerals continues to appeal to health-conscious consumers seeking nutritious seafood options, thus strengthening the cod market growth.
Breakup by Source:
- Farmed
- Wild Capture
Wild capture holds the largest share of the industry
A detailed breakup and analysis of the market based on the source have also been provided in the report. This includes farmed and wild capture. According to the report, wild capture accounted for the largest market share.
The demand for wild-caught cod is primarily driven by consumer preference for natural and sustainably sourced seafood products. Unlike farmed fish, wild-caught cod is perceived as having a more authentic flavor and texture, appealing to consumers seeking a closer connection to the ocean and traditional fishing practices. Additionally, wild-caught cod is often associated with higher quality due to its natural diet and environment, which contributes to its nutritional profile and taste. Sustainable fishing certifications, such as those provided by the Marine Stewardship Council (MSC), further validate the environmental responsibility of wild-caught cod fisheries, assuring consumers of ethical and eco-friendly sourcing practices. This transparency in sourcing resonates with conscientious consumers who prioritize environmental conservation and ethical considerations in their seafood choices, thereby driving the demand for wild-caught cod in the global market.
Breakup by Product Type:
- Fresh
- Canned
- Frozen
- Others
Frozen represents the leading market segment
The report has provided a detailed breakup and analysis of the market based on the product type. This includes fresh, canned, frozen, and others. According to the report, frozen represented the largest segment.
Frozen cod offers convenience and extended shelf life, making it a practical choice for retailers and consumers alike. This preservation method ensures that cod retains its freshness and nutritional value while being transported over long distances, meeting global demand efficiently. Frozen cod also supports year-round availability, overcoming seasonal fluctuations in fresh fish supply and demand. Moreover, advancements in freezing technology maintain the texture and flavor of cod fillets and portions, appealing to consumers who prioritize quality and convenience in their culinary preparations. The versatility of frozen cod in various cooking applications, from baking and grilling to preparing fish stews and curries, further enhances its market appeal. These attributes make it a preferred choice for consumers looking for convenient, high-quality seafood options that can be easily integrated into diverse recipes and meal plans, thereby positively impacting the cod market outlook.
Breakup by Distribution Channel:
- Institutional
- Retail
- Direct Sales
- Supermarkets and Hypermarkets
- Online Stores
- Others
Institutional exhibits a clear dominance in the market
A detailed breakup and analysis of the market based on the distribution channel have also been provided in the report. This includes institutional and retail (direct sales, supermarkets and hypermarkets, online stores, and others). According to the report, institutional accounted for the largest market share.
The demand for cod through institutional distribution channels is driven by the food service industry's extensive use of seafood in catering, restaurants, and institutional kitchens. Cod's versatility in culinary applications, from fish and chips to gourmet seafood dishes, makes it a favored choice among chefs and food service professionals looking to offer diverse menu options. Institutional buyers, such as hotels, hospitals, and schools, value cod for its nutritional benefits, including high protein content and omega-3 fatty acids, which align with dietary guidelines and consumer preferences for healthy eating. Bulk purchasing of cod through institutional channels ensures consistent supply and cost-efficiency for large-scale food preparation. Additionally, suppliers and distributors catering to institutional markets prioritize quality assurance and food safety standards to meet stringent regulatory requirements and ensure customer satisfaction, thus bolstering the cod market share.
Breakup by Consuming Region:

- North America
- United States
- Canada
- Asia Pacific
- China
- South Korea
- Japan
- Others
- Europe
- Portugal
- United Kingdom
- Germany
- Sweden
- Spain
- France
- Others
- Latin America
- Brazil
- Chile
- Others
- Middle East and Africa
- UAE
- Saudi Arabia
- Others
North America dominates the market
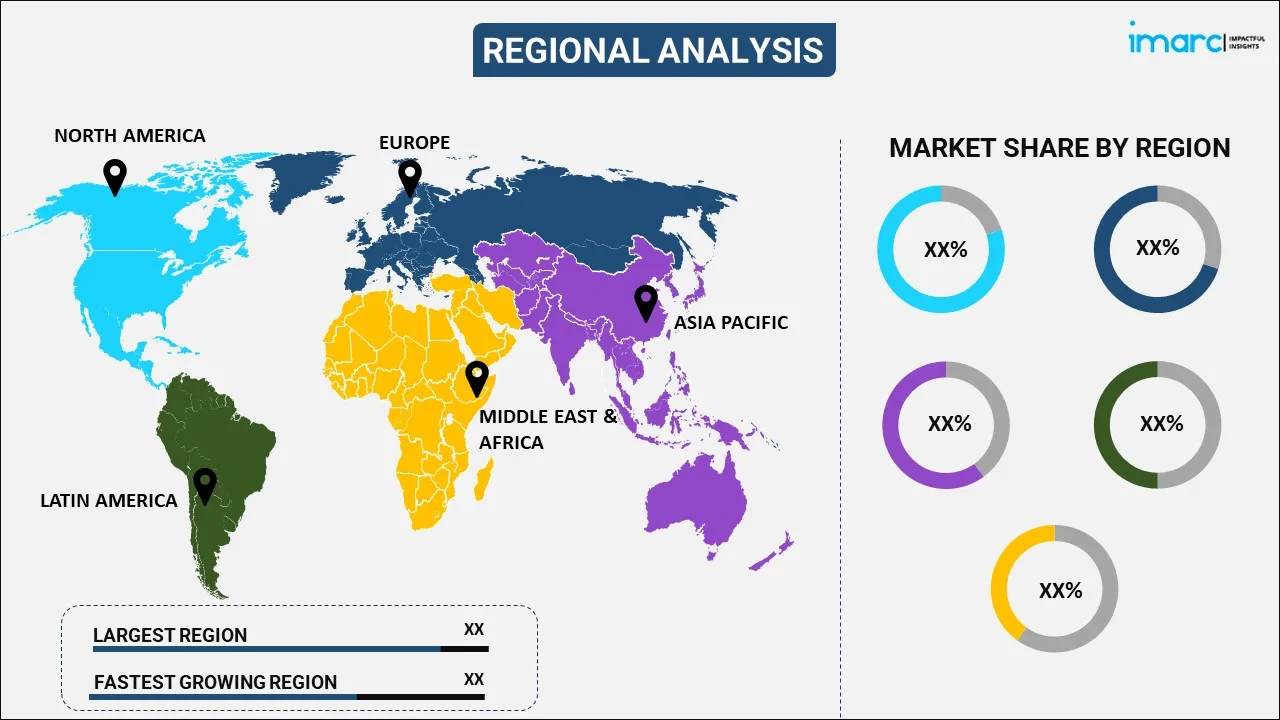
The report has also provided a comprehensive analysis of all the major regional markets, which include North America (the United States and Canada); Asia Pacific (China, South Korea, Japan, and others); Europe (Portugal, the United Kingdom, Germany, Sweden, Spain, France, and others); Latin America (Brazil, Chile, and others); and the Middle East and Africa (UAE, Saudi Arabia, and others). According to the report, North America represents the largest regional market for cod.
The cod market forecast reveals that demand in North America is primarily driven by its longstanding popularity in traditional dishes such as fish and chips and New England clam chowder, reflecting cultural preferences deeply rooted in regional culinary traditions. Additionally, the perception of cod as a lean protein source rich in essential nutrients like vitamin D and omega-3 fatty acids appeals to health-conscious consumers seeking nutritious dietary options. The versatility of cod in various cooking methods, from grilling and baking to frying and poaching, further enhances its appeal across diverse consumer demographics. Moreover, the availability of sustainably sourced cod, certified by organizations like the Marine Stewardship Council (MSC), resonates with environmentally aware consumers who prioritize responsible seafood choices. These factors, combined with efficient distribution networks and robust consumer demand, contribute to the sustained and growing popularity of cod in North America's seafood market.
Competitive Landscape:
- The market research report has also provided a comprehensive analysis of the competitive landscape in the market. Detailed profiles of all major companies have also been provided. Some of the major market players in the cod industry include Aalesundfish AS, Alliance Seafood AS, ANDREAS BJØRGE SEAFOOD AS, Arctic Catch AS, Iceland Seafood International hf, Lerøy Seafood Group ASA, Norebo Holding JSC, Norges Sjømatråd AS, Norsk Sjømat AS, etc.
(Please note that this is only a partial list of the key players, and the complete list is provided in the report.)
- The global cod market features a competitive landscape shaped by a mix of factors including regional fishing quotas, sustainability practices, technological advancements, and consumer preferences. Major players in the market include both large-scale fishing fleets and smaller, specialized fisheries, each vying to meet demand while adhering to regulatory guidelines aimed at preserving cod stocks. Sustainable fishing certifications, such as those from the MSC, play a crucial role in distinguishing products and influencing consumer choices. Technological innovations in fishing gear and processing techniques improve efficiency and product quality, giving companies a competitive edge in meeting stringent market standards. Additionally, the market is influenced by fluctuations in supply due to environmental factors and fishing regulations, which can impact pricing and availability.
Cod Market News:
-
In February 2023, SeaPak Shrimp & Seafood Co. introduced a new coastal-inspired Coconut Cod product, featuring wild-caught cod coated in crispy coconut breading. The product offers a nutty, slightly sweet coconut burst with the buttery, savory taste of wild-caught cod, making it a new family favorite.
Cod Market Report Scope:
| Report Features | Details |
|---|---|
| Base Year of the Analysis | 2024 |
| Historical Period | 2019-2024 |
| Forecast Period | 2025-2033 |
| Units | Billion USD, Million Tons |
| Scope of the Report | Exploration of Historical Trends and Market Outlook, Industry Catalysts and Challenges, Segment-Wise Historical and Future Market Assessment:
|
| Species Covered | Atlantic Cod Fish, Pacific Cod Fish, Greenland Cod Fish, Others |
| Sources Covered | Farmed, Wild Capture |
| Product Types Covered | Fresh, Canned, Frozen, Others |
| Distribution Channels Covered |
|
| Consuming Regions Covered | Asia Pacific, Europe, North America, Latin America, Middle East and Africa |
| Countries Covered | United States, Canada, Germany, France, United Kingdom, Portugal, Spain, Sweden, China, Japan, South Korea, Brazil, Chile, UAE, Saudi Arabia |
| Companies Covered | Aalesundfish AS, Alliance Seafood AS, ANDREAS BJØRGE SEAFOOD AS, Arctic Catch AS, Iceland Seafood International hf, Lerøy Seafood Group ASA, Norebo Holding JSC, Norges Sjømatråd AS, Norsk Sjømat AS, etc. |
| Customization Scope | 10% Free Customization |
| Post-Sale Analyst Support | 10-12 Weeks |
| Delivery Format | PDF and Excel through Email (We can also provide the editable version of the report in PPT/Word format on special request) |
Key Benefits for Stakeholders:
- IMARC’s industry report offers a comprehensive quantitative analysis of various market segments, historical and current market trends, market forecasts, and dynamics of the cod market from 2019-2033.
- The research report provides the latest information on the market drivers, challenges, and opportunities in the global cod market.
- The study maps the leading, as well as the fastest-growing, regional markets. It further enables stakeholders to identify the key country-level markets within each region.
- Porter's five forces analysis assists stakeholders in assessing the impact of new entrants, competitive rivalry, supplier power, buyer power, and the threat of substitution. It helps stakeholders to analyze the level of competition within the cod industry and its attractiveness.
- The competitive landscape allows stakeholders to understand their competitive environment and provides insight into the current positions of key players in the market.
Key Questions Answered in This Report
The global COD market was valued at USD 11.4 Billion in 2024.
We expect the global COD market to exhibit a CAGR of 4.22% during 2025-2033.
The rising adoption of a protein-rich diet by individuals, along with the increasing demand for cod fish, as it aids in lowering cholesterol levels, boosting immunity, controlling blood pressure, improving brain functioning, etc., is primarily driving the global COD market.
The sudden outbreak of the COVID-19 pandemic has led to the changing consumer inclination from conventional brick-and-mortar distribution channels towards online retail platforms for the purchase of COD.
Based on the species, the global COD market has been divided into Atlantic cod fish, Pacific cod fish, Greenland cod fish, and others. Among these, Atlantic cod fish currently exhibits a clear dominance in the market.
Based on the source, the global COD market can be categorized into farmed and wild capture. Currently, wild capture accounts for the majority of the global market share.
Based on the product type, the global COD market has been segregated into fresh, canned, frozen, and others. Among these, frozen currently exhibits a clear dominance in the market.
Based on the distribution channel, the global COD market can be bifurcated into institutional and retail. Currently, institutional holds the largest market share.
On a regional level, the market has been classified into North America, Asia Pacific, Europe, Latin America, and Middle East and Africa, where North America currently dominates the global market.
Some of the major players in the global COD market include Aalesundfish AS, Alliance Seafood AS, ANDREAS BJØRGE SEAFOOD AS, Arctic Catch AS, Iceland Seafood International hf, Lerøy Seafood Group ASA, Norebo Holding JSC, Norges Sjømatråd AS, and Norsk Sjømat AS.
Need more help?
- Speak to our experienced analysts for insights on the current market scenarios.
- Include additional segments and countries to customize the report as per your requirement.
- Gain an unparalleled competitive advantage in your domain by understanding how to utilize the report and positively impacting your operations and revenue.
- For further assistance, please connect with our analysts.
 Request Customization
 Speak to an Analyst
 Request Brochure
 Inquire Before Buying


.webp)


.webp)


