
Copper Prices, Trend, Chart, Demand, Market Analysis, News, Historical and Forecast Data Report 2026 Edition
Copper Price Trend, Index and Forecast
Track real-time and historical copper prices across global regions. Updated monthly with market insights, drivers, and forecasts.
Copper Prices June 2026
| Region | Price (USD/Kg) | Latest Movement |
|---|---|---|
| Northeast Asia | 14.69 | -0.6% ↓ Down |
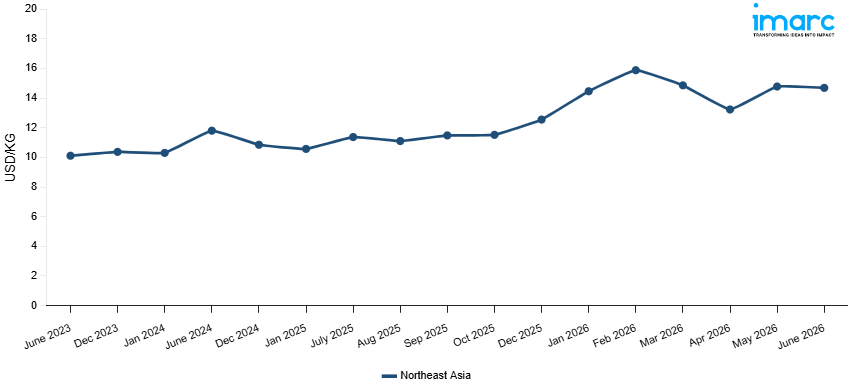
Copper Price Index (USD/KG):
The chart below highlights monthly copper prices across different regions.
Get Access to Monthly/Quarterly/Yearly Prices, Request Sample
Market Overview Q4 Ending December 2025
Northeast Asia: The copper prices in Northeast Asia reached 12.55 USD/KG in December 2025. The upward pricing movement registered between September and December 2025 was 9.4%. Strong demand from the electrical wire, electronics, and renewable energy sectors was the primary driver of the notable price increase. Procurement efforts were bolstered by the region's rapid expansion of the power grid and the lengthy manufacturing schedules for electric vehicles. The market's access to refined copper was further constrained by limited concentration availability and by stricter supply constraints stemming from a global decline in mine output. Higher upstream smelting and refining costs increased production costs for regional processors, fueling the upward trend. Strong offtake fundamentals were maintained by increased demand from the building and air conditioning manufacturing sectors, and procurement competition intensified as downstream fabricators accumulated strategic inventories in anticipation of ongoing supply constraints, leading to noticeable price momentum across the board.
Market Overview Q3 Ending September 2025
Northeast Asia: Northeast Asia experienced an upward pricing momentum driven by accelerated Chinese demand that surged above five-year consumption ranges, primarily fueled by infrastructure expansion and renewable energy investments. Supply deficits persisted as demand outpaced refined copper production, with electrical grid projects and rural electrification programs intensifying consumption requirements. The renewable energy transition significantly amplified copper requirements, particularly for solar and wind installations that demand substantially more copper per megawatt than conventional power generation systems. Strategic inventory drawdowns and sustained industrial activity across manufacturing sectors contributed to tightening supply conditions, while emerging applications in artificial intelligence infrastructure and energy storage systems provided additional demand support, reinforcing the upward pricing trajectory throughout the region.
Copper Price Trend, Market Analysis, and News
IMARC's latest publication, “Copper Prices, Trend, Chart, Demand, Market Analysis, News, Historical and Forecast Data Report 2026 Edition,” presents a detailed examination of the copper market, providing insights into both global and regional trends that are shaping prices. This report delves into the spot price of copper at major ports and analyzes the composition of prices, including FOB and CIF terms. It also presents detailed copper prices trend analysis by region, covering North America, Europe, Asia Pacific, Latin America, and Middle East and Africa. The factors affecting copper pricing, such as the dynamics of supply and demand, geopolitical influences, and sector-specific developments, are thoroughly explored. This comprehensive report helps stakeholders stay informed with the latest market news, regulatory updates, and technological progress, facilitating informed strategic decision-making and forecasting.
.webp)
Copper Industry Analysis
The global copper industry size reached 29.9 Million Tons in 2025. By 2034, IMARC Group expects the market to reach 46.7 Million Tons, at a projected CAGR of 4.93% during 2026-2034. The market is experiencing robust growth driven by accelerating demand from renewable energy infrastructure, with solar and wind installations requiring substantially more copper per megawatt than conventional power generation, alongside surging electric vehicle adoption that demands four times more copper than traditional automobiles.
Latest developments in the Copper Industry:
- April 2025: Met-Ed, a subsidiary of FirstEnergy Corp., announced that it is upgrading the energy delivery system in north-western York County, Pennsylvania. The project focuses on upgrading over a mile of aging copper wire on a local power line by replacing it with larger-diameter wire. This new wire is expected to carry more electricity, improving service reliability for approximately 300 Met-Ed customers in the Dillsburg area and supporting the community’s increasing energy demands.
- February 2025: UltraTech Cement announced its entry into the wires and cables segment, marking a strategic expansion beyond cement. The company revealed plans to invest INR 1,800 crore to establish a manufacturing plant near Bharuch in Gujarat.
- January 2025: Sajjan Jindal's JSW company announced its debut into the copper market, signing a Mine Operator and Developer (MDO) deal for two mining blocks in Jharkhand. The project entails operationalizing two mines and establishing a copper concentrator facility, which will increase supplies for pipe manufacture.
- January 2025: JX Advanced Metals Corporation launched 100% recycled high-performance copper alloys, including copper titanium and Corson alloys, as part of its "Cu again" project. These alloys, made from recycled materials, are used in devices such as smartphones, EVs, and generative AI data centers.
Product Description
Copper is a reddish-brown metallic element widely known for its exceptional electrical and thermal conductivity, ranking as the third most consumed industrial metal globally after iron and aluminum. Its defining property encompasses superior conductivity combined with excellent malleability and corrosion resistance. Primary industrial applications include electrical wiring and power transmission infrastructure, construction plumbing and roofing systems, telecommunications networks, and automotive components. The renewable energy transition has amplified copper's strategic importance, with electric vehicles requiring four times more copper than conventional automobiles, and solar installations demanding extensive copper for interconnections. Copper enhances product performance through unmatched electrical efficiency, thermal management capabilities, antimicrobial properties for healthcare applications, and recyclability supporting circular economy initiatives across diverse manufacturing and infrastructure sectors.
Report Coverage
| Key Attributes | Details |
|---|---|
| Product Name | Copper |
| Report Features | Exploration of Historical Trends and Market Outlook, Industry Demand, Industry Supply, Gap Analysis, Challenges, Copper Price Analysis, and Segment-Wise Assessment. |
| Currency/Units | US$ (Data can also be provided in local currency) or Metric Tons |
| Region/Countries Covered | The current coverage includes analysis at the global and regional levels only. Based on your requirements, we can also customize the report and provide specific information for the following countries: Asia Pacific: China, India, Indonesia, Pakistan, Bangladesh, Japan, Philippines, Vietnam, Thailand, South Korea, Malaysia, Nepal, Taiwan, Sri Lanka, Hongkong, Singapore, Australia, and New Zealand* Europe: Germany, France, United Kingdom, Italy, Spain, Russia, Turkey, Netherlands, Poland, Sweden, Belgium, Austria, Ireland, Switzerland, Norway, Denmark, Romania, Finland, Czech Republic, Portugal and Greece* North America: United States and Canada Latin America: Brazil, Mexico, Argentina, Columbia, Chile, Ecuador, and Peru* Middle East & Africa: Saudi Arabia, UAE, Israel, Iran, South Africa, Nigeria, Oman, Kuwait, Qatar, Iraq, Egypt, Algeria, and Morocco* *The list of countries presented is not exhaustive. Information on additional countries can be provided if required by the client. |
| Information Covered for Key Suppliers |
|
| Customization Scope | The report can be customized as per the requirements of the customer |
| Report Price and Purchase Option |
Plan A: Monthly Updates - Annual Subscription
Plan B: Quarterly Updates - Annual Subscription
Plan C: Biannually Updates - Annual Subscription
|
| Post-Sale Analyst Support | 360-degree analyst support after report delivery |
| Delivery Format | PDF and Excel through email (We can also provide the editable version of the report in PPT/Word format on special request) |
Key Benefits for Stakeholders:
- IMARC’s report presents a detailed analysis of copper pricing, covering global and regional trends, spot prices at key ports, and a breakdown of ex-works, FOB, and CIF prices.
- The study examines factors affecting copper price trend, including supply-demand shifts and geopolitical impacts, offering insights for informed decision-making.
- The competitive landscape review equips stakeholders with crucial insights into the latest market news, regulatory changes, and technological advancements, ensuring a well-rounded, strategic overview for forecasting and planning.
- IMARC offers various subscription options, including monthly, quarterly, and biannual updates, allowing clients to stay informed with the latest market trends, ongoing developments, and comprehensive market insights. The copper price charts ensure our clients remain at the forefront of the industry.
Frequently Asked Questions About the Copper Price Trend Report
The copper prices in June 2026 were 14.69 USD/KG in Northeast Asia.
The copper pricing data is updated on a monthly basis.
We provide the pricing data primarily in the form of an Excel sheet and a PDF.
Yes, our report includes a forecast for copper prices.
The regions covered include North America, Europe, Asia Pacific, Middle East, and Latin America. Countries can be customized based on the request (additional charges may be applicable).
Yes, we provide both FOB and CIF prices in our report.
Need more help?
- Speak to our experienced analysts for insights on the current market scenarios.
- Include additional segments and countries to customize the report as per your requirement.
- Gain an unparalleled competitive advantage in your domain by understanding how to utilize the report and positively impacting your operations and revenue.
- For further assistance, please connect with our analysts.
 Request Customization
 Inquire Before Buying
 Speak to an Analyst
 Request Brochure
Benefits of Customization
- Personalize this research
- Triangulate with your data
- Get data as per your format and definition
- Gain a deeper dive into a specific application, geography, customer, or competitor
- Any level of personalization
Get in Touch With Us
UNITED STATES
Phone: +1-201-971-6302
INDIA
Phone: +91-120-433-0800
UNITED KINGDOM
Phone: +44-753-714-6104
Email: [email protected]
Client Testimonials


.webp)


Why Choose Us
IMARC offers trustworthy, data-centric insights into commodity pricing and evolving market trends, enabling businesses to make well-informed decisions in areas such as procurement, strategic planning, and investments. With in-depth knowledge spanning more than 1000 commodities and a vast global presence in over 150 countries, we provide tailored, actionable intelligence designed to meet the specific needs of diverse industries and markets.
1000
+Commodities
150
+Countries Covered
3000
+Clients
20
+Industry
Robust Methodologies & Extensive Resources
IMARC delivers precise commodity pricing insights using proven methodologies and a wealth of data to support strategic decision-making.
Subscription-Based Databases
Our extensive databases provide detailed commodity pricing, import-export trade statistics, and shipment-level tracking for comprehensive market analysis.
Primary Research-Driven Insights
Through direct supplier surveys and expert interviews, we gather real-time market data to enhance pricing accuracy and trend forecasting.
Extensive Secondary Research
We analyze industry reports, trade publications, and market studies to offer tailored intelligence and actionable commodity market insights.
Trusted by 3000+ industry leaders worldwide to drive data-backed decisions. From global manufacturers to government agencies, our clients rely on us for accurate pricing, deep market intelligence, and forward-looking insights.