
Data Monetization Market Size, Share, Trends and Forecast by Method, Organization Size, End Use, and Region, 2026-2034
Data Monetization Market Size:
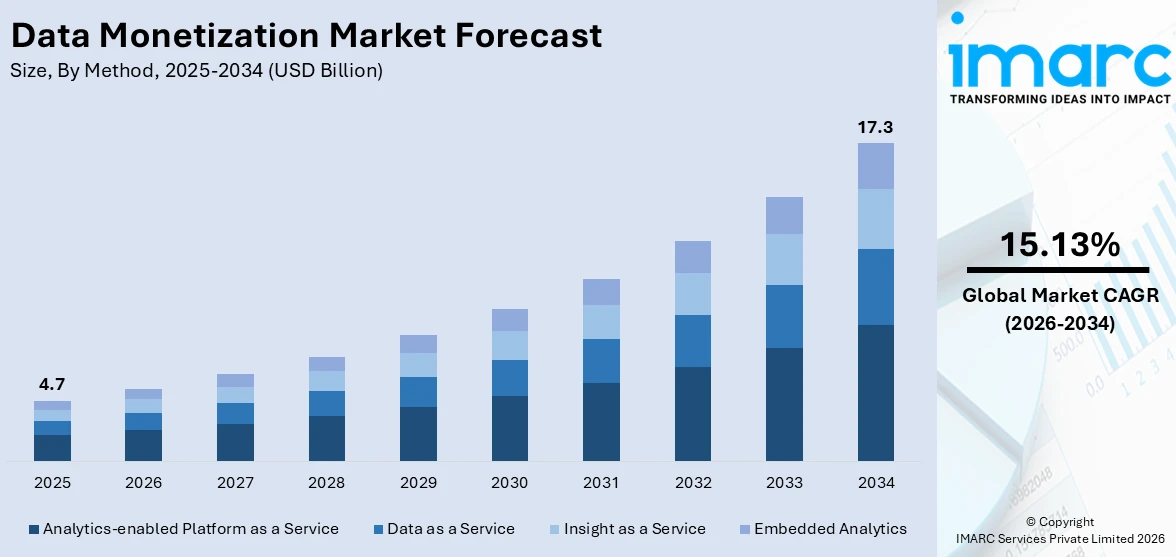
The global data monetization market size reached USD 4.7 Billion in 2025. Looking forward, IMARC Group expects the market to reach USD 17.3 Billion by 2034, exhibiting a growth rate (CAGR) of 15.13% during 2026-2034. The market is experiencing steady growth driven by the generation of considerable amounts of data, consumer interactions, and digital touchpoints in organizations, increasing need for data-driven decision-making, and rapid progress in data processing, storage, and analytics technologies.
|
Report Attribute
|
Key Statistics
|
|---|---|
|
Base Year
|
2025
|
|
Forecast Years
|
2026-2034
|
|
Historical Years
|
2020-2025
|
|
Market Size in 2025
|
USD 4.7 Billion |
|
Market Forecast in 2034
|
USD 17.3 Billion |
| Market Growth Rate 2026-2034 | 15.13% |
Data Monetization Market Analysis:
- Market Growth and Size: The market is witnessing robust growth, driven by the increasing importance of data-driven decision-making across various industries. The growing volume of data generated and the need for businesses to derive value from their data assets are also offering a favorable market outlook.
- Technological Advancements: Rapid technological innovations, such as artificial intelligence (AI) and machine learning (ML), are playing a pivotal role in enabling more efficient data monetization strategies. These technologies help in extracting actionable insights from data, enhancing its value.
- Industry Applications: Data monetization finds applications across diverse industries, including finance, healthcare, retail, and telecommunications. It allows businesses to unlock the potential of their data for better decision-making and revenue generation.
- Geographical Trends: North America leads the market, driven by its advanced technological infrastructure. However, Asia Pacific is emerging as a fast-growing market, driven by the adoption of advanced analytics.
- Competitive Landscape: Key players in the market are innovating to offer comprehensive solutions and stay ahead in the competitive landscape. They are investing in advanced analytics, AI, and machine learning (ML) technologies to provide more powerful insights from data, enabling businesses to make better decisions.
- Challenges and Opportunities: While the market faces challenges, such as data security concerns, data quality issues, and the need for skilled data professionals, it also encounters opportunities in leveraging untapped data sources and expanding into emerging markets.
- Future Outlook: The future of the data monetization market looks promising, with the increasing demand for tailored data monetization solutions for specific industries, such as healthcare, finance, and retail. These specialized solutions will address industry-specific challenges and opportunities.
To get more information on this market Request Sample
Data Monetization Market Trends:
Growing volume of data
Organizations are generating vast amounts of data through their operations, consumer interactions, and digital touchpoints. This data encompasses structured and unstructured information, offering valuable insights that can be harnessed for strategic decision-making and revenue generation. As businesses are accumulating more data, they are increasingly motivated to find ways to derive value from it. Data monetization provides a means to not only leverage this data for internal purposes but also to create additional revenue streams by sharing or selling data to other organizations. The proliferation of Internet of Things (IoT) devices, social media interactions, e-commerce transactions, and digital services is contributing significantly to the data explosion. This trend is expected to continue as technology becomes more integrated into daily life, further catalyzing the demand for data monetization solutions and strategies.
Need for data-driven decision-making
The increasing need for data-driven decision-making is bolstering the growth of the market. In the competitive business landscape, organizations recognize that data is an asset that can guide strategic choices, optimize processes, and improve overall performance. Data-driven decision-making empowers businesses to base their strategies and actions on factual insights. This approach enhances the accuracy and effectiveness of decision-making processes, leading to better outcomes in areas, such as product development, marketing campaigns, and resource allocation. As businesses are seeking to gain a competitive edge and remain agile in fast-paced markets, the demand for data-driven insights is growing. Data monetization enables organizations to leverage their data assets to gain actionable insights, identify trends, and make informed decisions in real-time.
Technological advancements
Rapid progress in data processing, storage, and analytics technologies is opening new possibilities for organizations to extract value from their data assets. The advent of artificial intelligence (AI) and machine learning (ML) is revolutionizing data analysis. These technologies enable businesses to uncover hidden insights, predict future trends, and automate decision-making processes, which enhance the monetization potential of data. Big data platforms and cloud computing are making it more feasible for organizations to store and manage vast amounts of data cost-effectively. This scalability allows businesses to accumulate and leverage data on a larger scale, driving the need for data monetization strategies.
Increasing awareness of data value
The growing awareness among the masses about the value of data is offering a favorable market outlook. Organizations across various industries are increasingly recognizing that data is not just a byproduct of their operations but an asset with the potential to generate revenue and insights. This awareness stems from success stories where companies are monetizing their data, either through direct sales or by using it to enhance their products and services. Additionally, educational efforts, industry reports, and conferences focused on data monetization are contributing to spreading awareness.
Data Monetization Industry Segmentation:
IMARC Group provides an analysis of the key trends in each segment of the market, along with forecasts at the global, regional, and country levels for 2026-2034. Our report has categorized the market based on method, organization size, and end use.
Breakup by Method:
- Data as a Service
- Insight as a Service
- Analytics-enabled Platform as a Service
- Embedded Analytics
Analytics-enabled platform as a service account for the majority of the market share
The report has provided a detailed breakup and analysis of the market based on the method. This includes data as a service, insight as a service, analytics-enabled platform as a service, and embedded analytics. According to the report, analytics-enabled platform as a service represented the largest segment.
Analytics-enabled platform as a service encompasses cloud-based platforms that offer a comprehensive suite of analytics tools and services. These platforms enable organizations to perform advanced data analysis, create data models, and develop custom applications to address specific business needs. PaaS providers often support both data integration and visualization, allowing businesses to streamline their data processes and gain valuable insights. This segment is favored by enterprises seeking a versatile and scalable analytics solution.
Data as a service involves the provision of raw data to organizations for various purposes, such as analysis, research, or integration into their systems. This segment caters to businesses that require access to external data sources to enrich their internal datasets. DaaS providers offer a wide range of data types, including demographic, market, and industry-specific data, to assist organizations in making data-driven decisions and enhancing their operations.
Insight as a service focuses on delivering actionable insights derived from data to organizations. This segment goes beyond providing raw data and offers pre-packaged or customized insights, often in the form of reports or dashboards. IaaS providers use advanced analytics and algorithms to extract meaningful conclusions from data, helping businesses identify trends, opportunities, and potential challenges.
Embedded analytics involves integrating analytical capabilities directly into existing software applications or business processes. This segment caters to organizations that want to enhance their products or services with data-driven features. Embedded analytics allows users to interact with data and gain insights seamlessly within their familiar work environments.
Breakup by Organization Size:
- Large Enterprises
- Small and Medium Enterprises
Large enterprises hold the largest share in the industry
A detailed breakup and analysis of the market based on the organization size have also been provided in the report. This includes large enterprises and small and medium enterprises. According to the report, large enterprises accounted for the largest market share.
Large enterprises have extensive data resources, advanced infrastructure, and dedicated teams to manage and leverage their data assets effectively. They often invest heavily in data monetization strategies, as they have the financial resources and scalability to implement comprehensive data analytics solutions. They use data monetization to drive operational efficiency, gain competitive advantages, and explore new revenue streams. Additionally, compliance and data governance are critical concerns for large enterprises, making data monetization solutions that ensure data security and regulatory compliance highly valuable.
Small and medium enterprises represent another significant segment in the data monetization market. While SMEs may have limited data resources compared to their larger counterparts, they are increasingly recognizing the importance of data-driven decision-making and revenue generation. Many SMEs are adopting data monetization strategies to remain competitive in their respective industries.
Breakup by End Use:
Access the comprehensive market breakdown Request Sample
- BFSI
- E-commerce and Retail
- IT and Telecommunications
- Manufacturing
- Healthcare
- Energy and Utilities
- Others
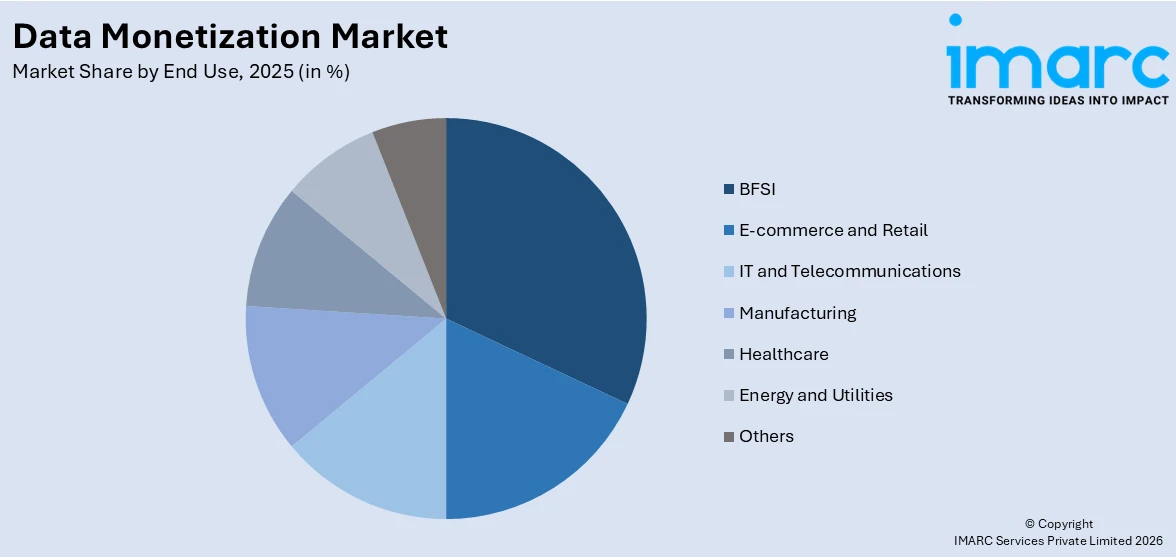
BFSI represents the leading market segment
The report has provided a detailed breakup and analysis of the market based on the end use. This includes BFSI, e-commerce and retail, IT and telecommunications, manufacturing, healthcare, energy and utilities, and others. According to the report, BFSI represented the largest segment as financial institutions deal with vast volumes of sensitive data, making data monetization crucial for enhancing consumer experiences, managing risks, and optimizing operations. In BFSI, data monetization enables personalized financial services, fraud detection, credit risk assessment, and compliance with regulatory requirements. The substantial data assets and high demand for data analytics make it a prime candidate for data monetization solutions.
E-commerce and retail constitute another significant segment in the data monetization market. These industries rely heavily on consumer data to personalize marketing, improve product recommendations, and optimize supply chain and inventory management. Data monetization in this sector enables businesses to boost sales, enhance consumer loyalty, and refine their pricing and promotional strategies.
The IT and telecommunications sector is a key player in the data monetization market. It generates vast amounts of data through network operations, customer interactions, and IoT devices. Data monetization solutions in this segment assist in network optimization, predictive maintenance, and improving the quality of services.
Manufacturing is an emerging segment in the data monetization market. Manufacturers are increasingly adopting data-driven approaches to enhance production efficiency, monitor equipment health, and predict maintenance needs.
The healthcare industry is recognizing the potential of data monetization to transform patient care, drug development, and healthcare operations. Data monetization in healthcare includes personalized treatment plans, predictive analytics for disease management, and optimizing resource allocation in healthcare facilities.

Breakup by Region:
- North America
- United States
- Canada
- Asia-Pacific
- China
- Japan
- India
- South Korea
- Australia
- Indonesia
- Others
- Europe
- Germany
- France
- United Kingdom
- Italy
- Spain
- Russia
- Others
- Latin America
- Brazil
- Mexico
- Others
- Middle East and Africa
North America leads the market, accounting for the largest data monetization market share
The market research report has also provided a comprehensive analysis of all the major regional markets, which include North America (the United States and Canada); Asia Pacific (China, Japan, India, South Korea, Australia, Indonesia, and others); Europe (Germany, France, the United Kingdom, Italy, Spain, Russia, and others); Latin America (Brazil, Mexico, and others); and the Middle East and Africa. According to the report, North America accounted for the largest market share due to its advanced technological infrastructure, robust data privacy regulations, and a high level of awareness regarding the value of data. Organizations in North America, particularly in the United States, leverage data monetization to gain competitive advantages, improve consumer experiences, and drive innovations. The presence of numerous tech giants and a thriving startup ecosystem is catalyzing the demand for data monetization solutions and services in this region.
The Asia Pacific region is witnessing rapid growth in the data monetization market. Increasing digitization, a burgeoning e-commerce sector, and the adoption of advanced analytics are driving data monetization initiatives across various industries. Countries like China and India are becoming significant players in the market due to their large populations and growing tech-savvy consumer bases.
Europe represents a substantial segment in the data monetization market, characterized by a strong focus on data protection and privacy regulations, such as GDPR. European businesses are adopting data monetization to comply with these regulations while unlocking the potential of their data.
Latin America is emerging as a notable segment in the data monetization market. The expanding digital economy and increasing internet penetration are driving the demand for data monetization solutions. Latin American businesses are leveraging data monetization to improve marketing strategies, consumer targeting, and operational efficiency.
The Middle East and Africa represent a growing segment in the data monetization market. While this region is relatively nascent in terms of data monetization adoption compared to others, it is witnessing increased interest and investment in data-driven initiatives.
Leading Key Players in the Data Monetization Industry:
Key players in the market are innovating to offer comprehensive solutions and stay ahead in the competitive landscape. They are investing in advanced analytics, AI, and machine learning (ML) technologies to provide more powerful insights from data, enabling businesses to make better decisions. These companies are expanding their data monetization platforms to accommodate diverse data sources, both structured and unstructured, and offer real-time analytics capabilities. Additionally, they focus on data security and compliance, developing robust data governance frameworks to address privacy concerns and regulatory requirements. Collaborations and partnerships with other technology providers and industry-specific players are also common strategies to enhance their offerings and expand their reach in various sectors, such as finance, healthcare, and retail.
The market research report has provided a comprehensive analysis of the competitive landscape. Detailed profiles of all major companies have also been provided. Some of the key players in the market include:
- 1010DATA (Advance Communication Corp.)
- Accenture Plc
- Adastra Corporation
- Comviva (Tech Mahindra)
- Infosys Limited
- International Business Machines Corporation
- Monetize Solutions Inc.
- Optiva Inc.
- Paxata Inc. (Datarobot Inc.)
- Reltio
- SAP SE
- Thales Group
- TIBCO Software Inc.
(Please note that this is only a partial list of the key players, and the complete list is provided in the report.)
Latest News:
- January 26, 2022: Optiva Inc., a leading provider of mission-critical, cloud-native monetization and revenue management software, announced a multi-year strategic partnership with Google Cloud to help telecom operators and service providers accelerate their digital transformations and journey to the cloud, private and public, and deployment on the edge. Through this collaboration with Google Cloud, Optiva customers can purchase its flagship products, Optiva BSS Platform and Optiva Charging Engine, via Google Cloud Marketplace as a SaaS solution.
- August, 2021: Adastra, a leading Global Data and Analytics solutions provider, and PaymentComponents, a global leader in B2B payments and fintech solutions, entered into a strategic alliance to enable open banking and payments capabilities in Canada and the USA.
- December 18, 2023: International Business Machines Corporation announced that it has entered into a definitive agreement with Software AG, a company majority owned by Silver Lake, to purchase StreamSets and webMethods, Software AG's Super integration platform-as-a-service (iPaaS) enterprise technology platforms. The acquisition of StreamSets and webMethods is further evidence of IBM's deep focus and investment in AI and hybrid cloud.
Data Monetization Market Report Scope:
| Report Features | Details |
|---|---|
| Base Year of the Analysis | 2025 |
| Historical Period | 2020-2025 |
| Forecast Period | 2026-2034 |
| Units | Billion USD |
| Scope of the Report | Exploration of Historical Trends and Market Outlook, Industry Catalysts and Challenges, Segment-Wise Historical and Future Market Assessment:
|
| Methods Covered | Data as a Service, Insight as a Service, Analytics-Enabled Platform as a Service, Embedded Analytics |
| Organization Sizes Covered | Large Enterprises, Small and Medium Enterprises |
| End Uses Covered | BFSI, E-Commerce and Retail, IT and Telecommunications, Manufacturing, Healthcare, Energy and Utilities, Others |
| Regions Covered | Asia Pacific, Europe, North America, Latin America, Middle East and Africa |
| Countries Covered | United States, Canada, Germany, France, United Kingdom, Italy, Spain, Russia, China, Japan, India, South Korea, Australia, Indonesia, Brazil, Mexico |
| Companies Covered | 1010DATA (Advance Communication Corp.), Accenture Plc, Adastra Corporation, Comviva (Tech Mahindra), Infosys Limited, International Business Machines Corporation, Monetize Solutions Inc., Optiva Inc., Paxata Inc. (Datarobot Inc.), Reltio, SAP SE, Thales Group, TIBCO Software Inc., etc. |
| Customization Scope | 10% Free Customization |
| Post-Sale Analyst Support | 10-12 Weeks |
| Delivery Format | PDF and Excel through Email (We can also provide the editable version of the report in PPT/Word format on special request) |
Key Benefits for Stakeholders:
- IMARC’s industry report offers a comprehensive quantitative analysis of various market segments, historical and current market trends, market forecasts, and dynamics of the data monetization market from 2020-2034.
- The research report provides the latest information on the market drivers, challenges, and opportunities in the global data monetization market.
- The study maps the leading, as well as the fastest-growing, regional markets. It further enables stakeholders to identify the key country-level markets within each region.
- Porter's five forces analysis assists stakeholders in assessing the impact of new entrants, competitive rivalry, supplier power, buyer power, and the threat of substitution. It helps stakeholders to analyze the level of competition within the data monetization industry and its attractiveness.
- The competitive landscape allows stakeholders to understand their competitive environment and provides insight into the current positions of key players in the market.
Frequently Asked Questions About the Data Monetization Market Report
The global data monetization market was valued at USD 4.7 Billion in 2025.
We expect the global data monetization market to exhibit a CAGR of 15.13% during 2026-2034.
The sudden outbreak of the COVID-19 pandemic has led to the growing deployment of data monetization over the physical storage mediums across several organizations for huge computing and storage power, during remote working scenario.
The rising adoption of data monetization in boosting profitability, reducing operating costs, improving customer experience, optimizing the use of data, etc., is primarily driving the global data monetization market.
Based on the method, the global data monetization market can be categorized into data as a service, insight as a service, analytics-enabled platform as a service, and embedded analytics. Among these, analytics-enabled platform as a service currently accounts for the majority of the global market share.
Based on the organization size, the global data monetization market has been segregated into large enterprises and small and medium enterprises, where large enterprises currently hold the largest market share.
Based on the end use, the global data monetization market can be bifurcated into BFSI, E-commerce and retail, IT and telecommunications, manufacturing, healthcare, energy and utilities, and others. Currently, the BFSI sector exhibits a clear dominance in the market.
On a regional level, the market has been classified into North America, Asia-Pacific, Europe, Latin America, and Middle East and Africa, where North America currently dominates the global market.
Some of the major players in the global data monetization market include 1010DATA (Advance Communication Corp.), Accenture Plc, Adastra Corporation, Comviva (Tech Mahindra), Infosys Limited, International Business Machines Corporation, Monetize Solutions Inc., Optiva Inc., Paxata Inc. (Datarobot Inc.), Reltio, SAP SE, Thales Group, and TIBCO Software Inc.
Need more help?
- Speak to our experienced analysts for insights on the current market scenarios.
- Include additional segments and countries to customize the report as per your requirement.
- Gain an unparalleled competitive advantage in your domain by understanding how to utilize the report and positively impacting your operations and revenue.
- For further assistance, please connect with our analysts.
 Request Customization
 Speak to an Analyst
 Request Brochure
 Inquire Before Buying
Benefits of Customization
- Personalize this research
- Triangulate with your data
- Get data as per your format and definition
- Gain a deeper dive into a specific application, geography, customer, or competitor
- Any level of personalization
Get in Touch With Us
UNITED STATES
Phone: +1-201-971-6302
INDIA
Phone: +91-120-433-0800
UNITED KINGDOM
Phone: +44-753-714-6104
Email: [email protected]
Client Testimonials


.webp)


