COVID-19 The pandemic continues to cause unprecedented disruption across industries worldwide. Get detailed insights regarding the impact of COVID-19 on the market.
De-Icing Agents Market: Global Industry Trends, Share, Size, Growth, Opportunity and Forecast 2021-2026
The global De-icing agents market grew at a CAGR of around 4% during 2015-2020. Looking forward, IMARC Group expects the market to continue its moderate growth during 2021-2026. Keeping in mind the uncertainties of COVID-19, we are continuously tracking and evaluating the direct as well as the indirect influence of the pandemic. These insights are included in the report as a major market contributor.
De-icing refers to the process of removing ice, frost, or snow from a surface. De-icing agents are the substances that prevent ice formation by lowering the freezing point of water or solvent and assist in cleansing. These agents primarily include potassium chloride, calcium chloride, calcium magnesium acetates, sodium chloride, surfactants (wetting agents), UV-sensitive dye, etc. De-icing agents are extensively adopted for aircraft, roads, railways, etc.
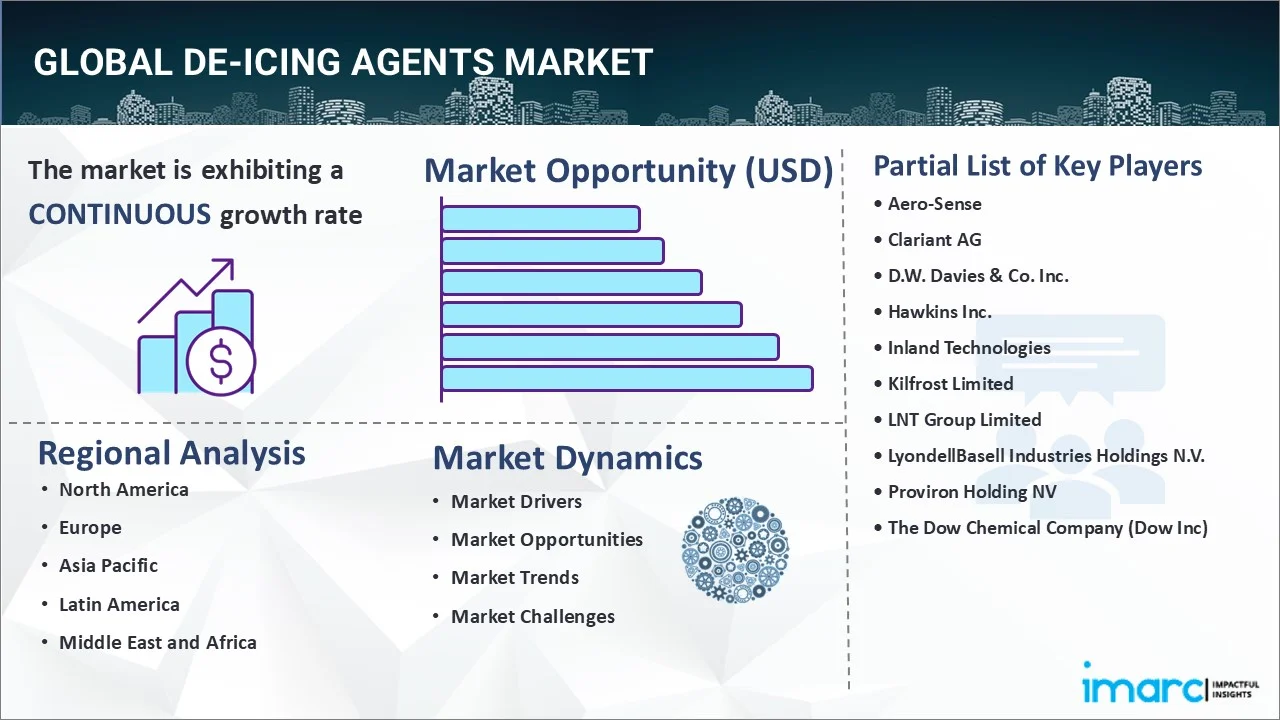
The rising levels of ecological imbalance leading to winter precipitation and extremely cold weather conditions are propelling the adoption of De-icing agents for removing excessive snow and ice. Furthermore, the growing number of road accidents due to skids and collisions on frozen surfaces is also driving the need for De-icing agents. Apart from this, the expanding aviation industry is further augmenting the utilization of De-icing agents for reducing icing hazards. The increasing emphasis on enhancing passenger safety by ensuring safe landing and take-off operations, particularly during the winter season, is also bolstering the global market. Moreover, the growing adoption of numerous maintenance programs in the railway sector for removing accumulated ice to improve friction on rail tracks is further propelling the demand for De-icing agents. Besides this, the emergence of numerous sustainable De-icing solutions, including hot water, tempered steam, forced air, electro-expulsive separation, and electro-mechanical expulsion De-icing systems, is also fueling the global market. Furthermore, the increasing environmental concerns towards the negative impact of chemical-based De-icing agents are augmenting the need for eco-friendly product variants.
Key Market Segmentation:
IMARC Group provides an analysis of the key trends in each sub-segment of the global De-icing agents market, along with forecasts at the global, regional and country level from 2021-2026. Our report has categorized the market based on product type, form and application.
Breakup by Product Type:
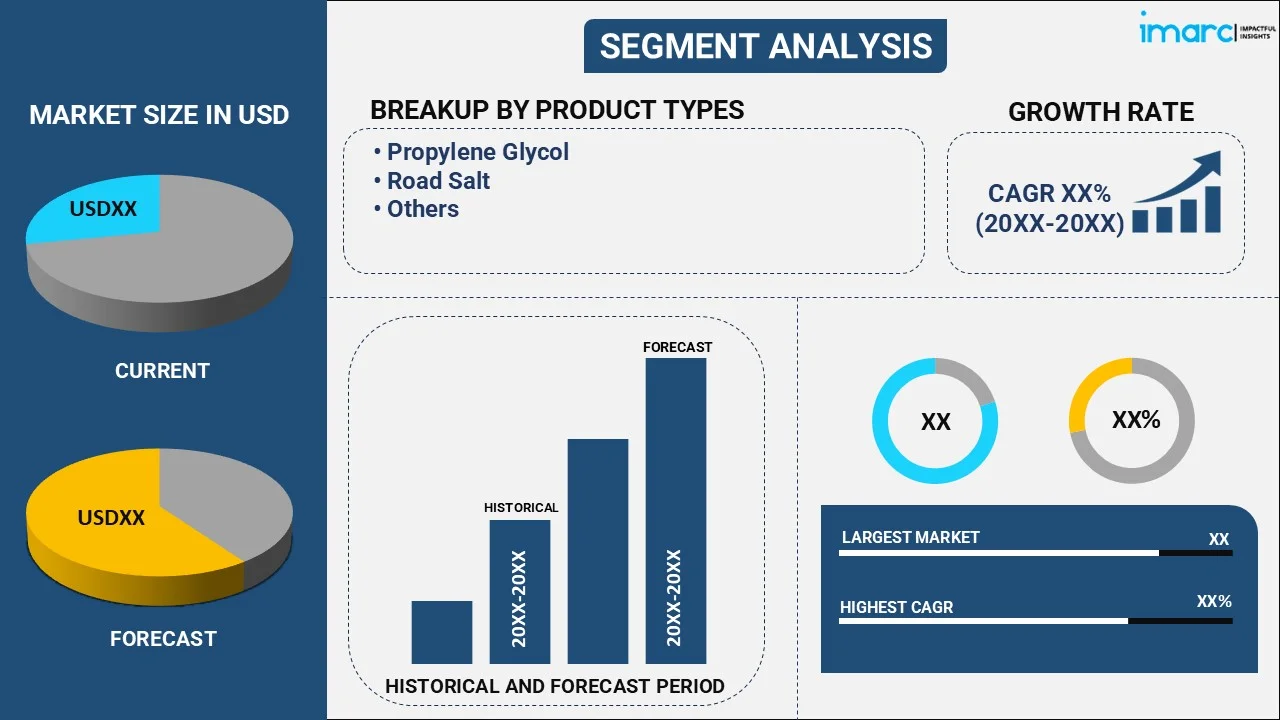
Propylene Glycol
Road Salt
Sodium Chloride
Calcium Chloride
Magnesium Chloride
Potassium Chloride
Other
Breakup by Form:
Solid
Liquid
Breakup by Application:
Airway
Highway
Others
Breakup by Region:
North America
United States
Canada
Asia-Pacific
China
Japan
India
South Korea
Australia
Indonesia
Others
Europe
Germany
France
United Kingdom
Italy
Spain
Russia
Others
Latin America
Brazil
Mexico
Others
Middle East and Africa
Turkey
Saudi Arabia
Others
Competitive Landscape:
The report has also analysed the competitive landscape of the market with some of the key players being Aero-Sense, Clariant AG, D.W. Davies & Co. Inc., Hawkins Inc., Inland Technologies, Kilfrost Limited, LNT Group Limited, LyondellBasell Industries Holdings N.V., Proviron Holding NV and The Dow Chemical Company (Dow Inc).
Report Coverage:
Report Features
Details
Base Year of the Analysis
2020
Historical Period
2015-2020
Forecast Period
2021-2026
Units
US$ Million
Segment Coverage
Product Type, Form, Application, Region
Region Covered
Asia Pacific, Europe, North America, Latin America, Middle East and Africa
Countries Covered
United States, Canada, Germany, France, United Kingdom, Italy, Spain, Russia, China, Japan, India, South Korea, Australia, Indonesia, Brazil, Mexico, Turkey, Saudi Arabia
Companies Covered
Aero-Sense, Clariant AG, D.W. Davies & Co. Inc., Hawkins Inc., Inland Technologies, Kilfrost Limited, LNT Group Limited, LyondellBasell Industries Holdings N.V., Proviron Holding NV and The Dow Chemical Company (Dow Inc)
Customization Scope
10% Free Customization
Report Price and Purchase Option
Post-Sale Analyst Support
10-12 Weeks
Delivery Format
PDF and Excel through Email (We can also provide the editable version of the report in PPT/Word format on special request)
Key Questions Answered in This Report:
How has the global De-icing agents market performed so far and how will it perform in the coming years?
What has been the impact of COVID-19 on the global De-icing agents market?
What are the key regional markets?
What is the breakup of the market based on the product type?
What is the breakup of the market based on the form?
What is the breakup of the market based on the application?
What are the various stages in the value chain of the industry?
What are the key driving factors and challenges in the industry?
What is the structure of the global De-icing agents market and who are the key players?
What is the degree of competition in the industry?
1 Preface
2 Scope and Methodology
2.1 Objectives of the Study
2.2 Stakeholders
2.3 Data Sources
2.3.1 Primary Sources
2.3.2 Secondary Sources
2.4 Market Estimation
2.4.1 Bottom-Up Approach
2.4.2 Top-Down Approach
2.5 Forecasting Methodology 3 Executive Summary
4 Introduction
4.1 Overview
4.2 Key Industry Trends 5 Global De-Icing Agents Market
5.1 Market Overview
5.2 Market Performance
5.3 Impact of COVID-19
5.4 Market Forecast 6 Market Breakup by Product Type
6.1 Propylene Glycol
6.1.1 Market Trends
6.1.2 Market Forecast
6.2 Road Salt
6.2.1 Market Trends
6.2.2 Market Breakup by Road Salt Type
6.2.2.1 Sodium Chloride
6.2.2.1.1 Market Trends
6.2.2.1.2 Market Forecast
6.2.2.2 Calcium Chloride
6.2.2.2.1 Market Trends
6.2.2.2.2 Market Forecast
6.2.2.3 Magnesium Chloride
6.2.2.3.1 Market Trends
6.2.2.3.2 Market Forecast
6.2.2.4 Potassium Chloride
6.2.2.4.1 Market Trends
6.2.2.4.2 Market Forecast
6.2.3 Market Forecast
6.3 Others
6.3.1 Market Trends
6.3.2 Market Forecast 7 Market Breakup by Form
7.1 Solid
7.1.1 Market Trends
7.1.2 Market Forecast
7.2 Liquid
7.2.1 Market Trends
7.2.2 Market Forecast 8 Market Breakup by Application
8.1 Airway
8.1.1 Market Trends
8.1.2 Market Forecast
8.2 Highway
8.2.1 Market Trends
8.2.2 Market Forecast
8.3 Others
8.3.1 Market Trends
8.3.2 Market Forecast 9 Market Breakup by Region
9.1 North America
9.1.1 United States
9.1.1.1 Market Trends
9.1.1.2 Market Forecast
9.1.2 Canada
9.1.2.1 Market Trends
9.1.2.2 Market Forecast
9.2 Asia-Pacific
9.2.1 China
9.2.1.1 Market Trends
9.2.1.2 Market Forecast
9.2.2 Japan
9.2.2.1 Market Trends
9.2.2.2 Market Forecast
9.2.3 India
9.2.3.1 Market Trends
9.2.3.2 Market Forecast
9.2.4 South Korea
9.2.4.1 Market Trends
9.2.4.2 Market Forecast
9.2.5 Australia
9.2.5.1 Market Trends
9.2.5.2 Market Forecast
9.2.6 Indonesia
9.2.6.1 Market Trends
9.2.6.2 Market Forecast
9.2.7 Others
9.2.7.1 Market Trends
9.2.7.2 Market Forecast
9.3 Europe
9.3.1 Germany
9.3.1.1 Market Trends
9.3.1.2 Market Forecast
9.3.2 France
9.3.2.1 Market Trends
9.3.2.2 Market Forecast
9.3.3 United Kingdom
9.3.3.1 Market Trends
9.3.3.2 Market Forecast
9.3.4 Italy
9.3.4.1 Market Trends
9.3.4.2 Market Forecast
9.3.5 Spain
9.3.5.1 Market Trends
9.3.5.2 Market Forecast
9.3.6 Russia
9.3.6.1 Market Trends
9.3.6.2 Market Forecast
9.3.7 Others
9.3.7.1 Market Trends
9.3.7.2 Market Forecast
9.4 Latin America
9.4.1 Brazil
9.4.1.1 Market Trends
9.4.1.2 Market Forecast
9.4.2 Mexico
9.4.2.1 Market Trends
9.4.2.2 Market Forecast
9.4.3 Others
9.4.3.1 Market Trends
9.4.3.2 Market Forecast
9.5 Middle East and Africa
9.5.1 Turkey
9.5.1.1 Market Trends
9.5.1.2 Market Forecast
9.5.2 Saudi Arabia
9.5.2.1 Market Trends
9.5.2.2 Market Forecast
9.5.3 Others
9.5.3.1 Market Trends
9.5.3.2 Market Forecast 10 SWOT Analysis
10.1 Overview
10.2 Strengths
10.3 Weaknesses
10.4 Opportunities
10.5 Threats 11 Value Chain Analysis
12 Porters Five Forces Analysis
12.1 Overview
12.2 Bargaining Power of Buyers
12.3 Bargaining Power of Suppliers
12.4 Degree of Competition
12.5 Threat of New Entrants
12.6 Threat of Substitutes 13 Price Analysis
14 Competitive Landscape
14.1 Market Structure
14.2 Key Players
14.3 Profiles of Key Players
14.3.1 Aero-Sense
14.3.1.1 Company Overview
14.3.1.2 Product Portfolio
14.3.2 Clariant AG
14.3.2.1 Company Overview
14.3.2.2 Product Portfolio
14.3.2.3 Financials
14.3.3 D.W. Davies & Co. Inc.
14.3.3.1 Company Overview
14.3.3.2 Product Portfolio
14.3.4 Hawkins Inc.
14.3.4.1 Company Overview
14.3.4.2 Product Portfolio
14.3.4.3 Financials
14.3.4.4 SWOT Analysis
14.3.5 Inland Technologies
14.3.5.1 Company Overview
14.3.5.2 Product Portfolio
14.3.6 Kilfrost Limited
14.3.6.1 Company Overview
14.3.6.2 Product Portfolio
14.3.7 LNT Group Limited
14.3.7.1 Company Overview
14.3.7.2 Product Portfolio
14.3.8 LyondellBasell Industries Holdings N.V.
14.3.8.1 Company Overview
14.3.8.2 Product Portfolio
14.3.8.3 Financials
14.3.8.4 SWOT Analysis
14.3.9 Proviron Holding NV
14.3.9.1 Company Overview
14.3.9.2 Product Portfolio
14.3.9.3 Financials
14.3.10 The Dow Chemical Company (Dow Inc)
14.3.10.1 Company Overview
14.3.10.2 Product Portfolio
14.3.10.3 Financials
List of Figures
Figure 1: Global: De-Icing Agents Market: Major Drivers and Challenges
Figure 2: Global: De-Icing Agents Market: Sales Value (in Million US$), 2015-2020
Figure 3: Global: De-Icing Agents Market: Breakup by Product Type (in %), 2020
Figure 4: Global: De-Icing Agents Market: Breakup by Form (in %), 2020
Figure 5: Global: De-Icing Agents Market: Breakup by Application (in %), 2020
Figure 6: Global: De-Icing Agents Market: Breakup by Region (in %), 2020
Figure 7: Global: De-Icing Agents Market Forecast: Sales Value (in Million US$), 2021-2026
Figure 8: Global: De-Icing Agents (Propylene Glycol) Market: Sales Value (in Million US$), 2015 & 2020
Figure 9: Global: De-Icing Agents (Propylene Glycol) Market Forecast: Sales Value (in Million US$), 2021-2026
Figure 10: Global: De-Icing Agents (Road Salt) Market: Sales Value (in Million US$), 2015 & 2020
Figure 11: Global: De-Icing Agents (Road Salt) Market: Breakup by Road Salt Type (in %), 2020
Figure 12: Global: De-Icing Agents (Sodium Chloride) Market: Sales Value (in Million US$), 2015 & 2020
Figure 13: Global: De-Icing Agents (Sodium Chloride) Market Forecast: Sales Value (in Million US$), 2021-2026
Figure 14: Global: De-Icing Agents (Calcium Chloride) Market: Sales Value (in Million US$), 2015 & 2020
Figure 15: Global: De-Icing Agents (Calcium Chloride) Market Forecast: Sales Value (in Million US$), 2021-2026
Figure 16: Global: De-Icing Agents (Magnesium Chloride) Market: Sales Value (in Million US$), 2015 & 2020
Figure 17: Global: De-Icing Agents (Magnesium Chloride) Market Forecast: Sales Value (in Million US$), 2021-2026
Figure 18: Global: De-Icing Agents (Potassium Chloride) Market: Sales Value (in Million US$), 2015 & 2020
Figure 19: Global: De-Icing Agents (Potassium Chloride) Market Forecast: Sales Value (in Million US$), 2021-2026
Figure 20: Global: De-Icing Agents (Road Salt) Market Forecast: Sales Value (in Million US$), 2021-2026
Figure 21: Global: De-Icing Agents (Other Products) Market: Sales Value (in Million US$), 2015 & 2020
Figure 22: Global: De-Icing Agents (Other Products) Market Forecast: Sales Value (in Million US$), 2021-2026
Figure 23: Global: De-Icing Agents (Solid) Market: Sales Value (in Million US$), 2015 & 2020
Figure 24: Global: De-Icing Agents (Solid) Market Forecast: Sales Value (in Million US$), 2021-2026
Figure 25: Global: De-Icing Agents (Liquid) Market: Sales Value (in Million US$), 2015 & 2020
Figure 26: Global: De-Icing Agents (Liquid) Market Forecast: Sales Value (in Million US$), 2021-2026
Figure 27: Global: De-Icing Agents (Airway) Market: Sales Value (in Million US$), 2015 & 2020
Figure 28: Global: De-Icing Agents (Airway) Market Forecast: Sales Value (in Million US$), 2021-2026
Figure 29: Global: De-Icing Agents (Highway) Market: Sales Value (in Million US$), 2015 & 2020
Figure 30: Global: De-Icing Agents (Highway) Market Forecast: Sales Value (in Million US$), 2021-2026
Figure 31: Global: De-Icing Agents (Other Applications) Market: Sales Value (in Million US$), 2015 & 2020
Figure 32: Global: De-Icing Agents (Other Applications) Market Forecast: Sales Value (in Million US$), 2021-2026
Figure 33: North America: De-Icing Agents Market: Sales Value (in Million US$), 2015 & 2020
Figure 34: North America: De-Icing Agents Market Forecast: Sales Value (in Million US$), 2021-2026
Figure 35: United States: De-Icing Agents Market: Sales Value (in Million US$), 2015 & 2020
Figure 36: United States: De-Icing Agents Market Forecast: Sales Value (in Million US$), 2021-2026
Figure 37: Canada: De-Icing Agents Market: Sales Value (in Million US$), 2015 & 2020
Figure 38: Canada: De-Icing Agents Market Forecast: Sales Value (in Million US$), 2021-2026
Figure 39: Asia Pacific: De-Icing Agents Market: Sales Value (in Million US$), 2015 & 2020
Figure 40: Asia Pacific: De-Icing Agents Market Forecast: Sales Value (in Million US$), 2021-2026
Figure 41: China: De-Icing Agents Market: Sales Value (in Million US$), 2015 & 2020
Figure 42: China: De-Icing Agents Market Forecast: Sales Value (in Million US$), 2021-2026
Figure 43: Japan: De-Icing Agents Market: Sales Value (in Million US$), 2015 & 2020
Figure 44: Japan: De-Icing Agents Market Forecast: Sales Value (in Million US$), 2021-2026
Figure 45: India: De-Icing Agents Market: Sales Value (in Million US$), 2015 & 2020
Figure 46: India: De-Icing Agents Market Forecast: Sales Value (in Million US$), 2021-2026
Figure 47: South Korea: De-Icing Agents Market: Sales Value (in Million US$), 2015 & 2020
Figure 48: South Korea: De-Icing Agents Market Forecast: Sales Value (in Million US$), 2021-2026
Figure 49: Australia: De-Icing Agents Market: Sales Value (in Million US$), 2015 & 2020
Figure 50: Australia: De-Icing Agents Market Forecast: Sales Value (in Million US$), 2021-2026
Figure 51: Indonesia: De-Icing Agents Market: Sales Value (in Million US$), 2015 & 2020
Figure 52: Indonesia: De-Icing Agents Market Forecast: Sales Value (in Million US$), 2021-2026
Figure 53: Others: De-Icing Agents Market: Sales Value (in Million US$), 2015 & 2020
Figure 54: Others: De-Icing Agents Market Forecast: Sales Value (in Million US$), 2021-2026
Figure 55: Europe: De-Icing Agents Market: Sales Value (in Million US$), 2015 & 2020
Figure 56: Europe: De-Icing Agents Market Forecast: Sales Value (in Million US$), 2021-2026
Figure 57: Germany: De-Icing Agents Market: Sales Value (in Million US$), 2015 & 2020
Figure 58: Germany: De-Icing Agents Market Forecast: Sales Value (in Million US$), 2021-2026
Figure 59: France: De-Icing Agents Market: Sales Value (in Million US$), 2015 & 2020
Figure 60: France: De-Icing Agents Market Forecast: Sales Value (in Million US$), 2021-2026
Figure 61: United Kingdom: De-Icing Agents Market: Sales Value (in Million US$), 2015 & 2020
Figure 62: United Kingdom: De-Icing Agents Market Forecast: Sales Value (in Million US$), 2021-2026
Figure 63: Italy: De-Icing Agents Market: Sales Value (in Million US$), 2015 & 2020
Figure 64: Italy: De-Icing Agents Market Forecast: Sales Value (in Million US$), 2021-2026
Figure 65: Spain: De-Icing Agents Market: Sales Value (in Million US$), 2015 & 2020
Figure 66: Spain: De-Icing Agents Market Forecast: Sales Value (in Million US$), 2021-2026
Figure 67: Russia: De-Icing Agents Market: Sales Value (in Million US$), 2015 & 2020
Figure 68: Russia: De-Icing Agents Market Forecast: Sales Value (in Million US$), 2021-2026
Figure 69: Others: De-Icing Agents Market: Sales Value (in Million US$), 2015 & 2020
Figure 70: Others: De-Icing Agents Market Forecast: Sales Value (in Million US$), 2021-2026
Figure 71: Latin America: De-Icing Agents Market: Sales Value (in Million US$), 2015 & 2020
Figure 72: Latin America: De-Icing Agents Market Forecast: Sales Value (in Million US$), 2021-2026
Figure 73: Brazil: De-Icing Agents Market: Sales Value (in Million US$), 2015 & 2020
Figure 74: Brazil: De-Icing Agents Market Forecast: Sales Value (in Million US$), 2021-2026
Figure 75: Mexico: De-Icing Agents Market: Sales Value (in Million US$), 2015 & 2020
Figure 76: Mexico: De-Icing Agents Market Forecast: Sales Value (in Million US$), 2021-2026
Figure 77: Others: De-Icing Agents Market: Sales Value (in Million US$), 2015 & 2020
Figure 78: Others: De-Icing Agents Market Forecast: Sales Value (in Million US$), 2021-2026
Figure 79: Middle East and Africa: De-Icing Agents Market: Sales Value (in Million US$), 2015 & 2020
Figure 80: Middle East and Africa: De-Icing Agents Market Forecast: Sales Value (in Million US$), 2021-2026
Figure 81: Turkey: De-Icing Agents Market: Sales Value (in Million US$), 2015 & 2020
Figure 82: Turkey: De-icing Agents Market Forecast: Sales Value (in Million US$), 2021-2026
Figure 83: Saudi Arabia: De-icing Agents Market: Sales Value (in Million US$), 2015 & 2020
Figure 84: Saudi Arabia: De-Icing Agents Market Forecast: Sales Value (in Million US$), 2021-2026
Figure 85: Others: De-Icing Agents Market: Sales Value (in Million US$), 2015 & 2020
Figure 86: Others: De-Icing Agents Market Forecast: Sales Value (in Million US$), 2021-2026
Figure 87: Global: De-Icing Agents Industry: SWOT Analysis
Figure 88: Global: De-Icing Agents Industry: Value Chain Analysis
Figure 89: Global: De-Icing Agents Industry: Porter’s Five Forces Analysis
List of Tables
Table 1: Global: De-Icing Agents Market: Key Industry Highlights, 2020 and 2026
Table 2: Global: De-Icing Agents Market Forecast: Breakup by Product Type (in Million US$), 2021-2026
Table 3: Global: De-Icing Agents Market Forecast: Breakup by Form (in Million US$), 2021-2026
Table 4: Global: De-Icing Agents Market Forecast: Breakup by Application (in Million US$), 2021-2026
Table 5: Global: De-Icing Agents Market Forecast: Breakup by Region (in Million US$), 2021-2026
Table 6: Global: De-Icing Agents Market: Competitive Structure
Table 7: Global: De-Icing Agents Market: Key Players
Need more help?
Speak to our experienced analysts for insights on the current market scenarios.
Include additional segments and countries to customize the report as per your requirement.
Gain an unparalleled competitive advantage in your domain by understanding how to utilize the report and positively impacting your operations and revenue.
For further assistance, please connect with our analysts.
All content published on the Site including text, designs, logos, graphics, data, materials, etc. (“Content”) are the sole property of IMARC Group or their respective licensors and are protected by the regional and international copyright laws. Learn More
This site uses cookies (including third-party cookies) to record user’s preferences which help us to
enhance our services. For further information review our Privacy Policy.