
Dextrose Prices, Trend, Chart, Demand, Market Analysis, News, Historical and Forecast Data Report 2026 Edition
Dextrose Price Trend, Index and Forecast
Track the latest insights on dextrose price trend and forecast with detailed analysis of regional fluctuations and market dynamics across North America, Latin America, Central Europe, Western Europe, Eastern Europe, Middle East, North Africa, West Africa, Central and Southern Africa, Central Asia, Southeast Asia, South Asia, East Asia, and Oceania.
Dextrose Prices Outlook Q3 2026
- USA: USD 580/MT
- China: USD 502/MT
- Germany: USD 680/MT
- South Korea: USD 565/MT
- South Africa: USD 642/MT
Dextrose Price Chart
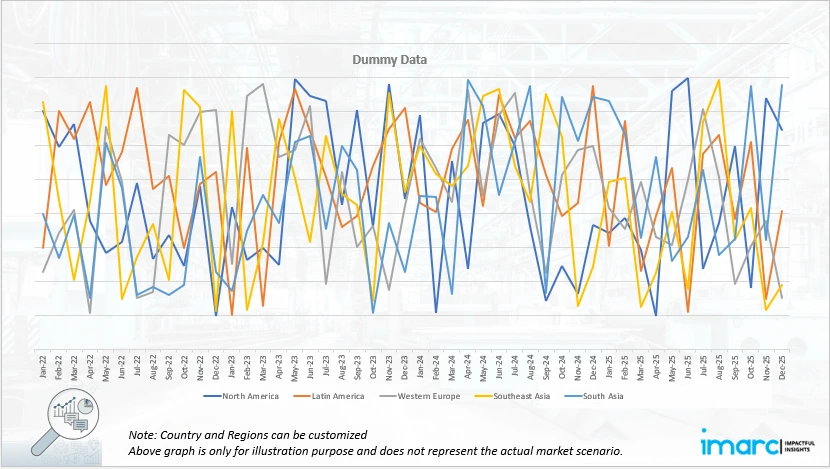
Get real-time access to monthly/quarterly/yearly prices Request Sample
During the third quarter of 2026, the dextrose prices in the USA reached 580 USD/MT in September. Prices moved upward as steady demand from bakery, confectionery and beverage manufacturers absorbed available domestic supply through the quarter. Firmer costs for corn starch feedstock at integrated wet millers added pressure to offer levels. Buyers in the pharmaceutical and fermentation sectors maintained active procurement of refined grades, keeping prompt availability tight.
During the third quarter of 2026, the dextrose prices in China reached 502 USD/MT in September. Prices moved upward as steady export demand absorbed surplus output from the country's large starch processing base through the quarter. Ample corn and cassava starch availability kept domestic supply comfortable relative to other origins. Firm demand from fermentation plants and confectionery producers supported consistent offtake across major consuming provinces.
During the third quarter of 2026, the dextrose prices in Germany reached 680 USD/MT in September. Prices advanced as European buyers faced firmer replacement costs alongside steady demand from confectionery, bakery and pharmaceutical manufacturers. Tight availability of prompt material supported firmer producer offers through the quarter. Freight and inland transport charges between import terminals and consuming regions added further pressure to delivered prices.
During the third quarter of 2026, the dextrose prices in South Korea reached 565 USD/MT in September. Prices moved higher as import dependent buyers faced firmer replacement costs from major supplying origins during the quarter. Steady demand from food and beverage processors and fermentation plants kept offtake consistent through the period. Limited domestic production kept the market reliant on imported material, reinforcing the impact of overseas price movements on local offers.
During the third quarter of 2026, the dextrose prices in South Africa reached 642 USD/MT in September. Prices moved upward as steady demand from beverage, confectionery and bakery processors absorbed available supply during the quarter. Firmer costs for imported material supported higher offer levels across the domestic market. Limited local refining capacity kept the market reliant on imported volumes, reinforcing the impact of overseas price movements on local offers.
Dextrose Prices Outlook Q2 2026
- USA: USD 534/MT
- China: USD 478/MT
- Germany: USD 630/MT
- South Korea: USD 527/MT
- South Africa: USD 598/MT
During the second quarter of 2026, the dextrose prices in the USA reached 534 USD/MT in June. Prices showed a mild downward movement over the quarter, largely shaped by stable corn syrup availability and steady processing activity across starch based sweetener units. Demand from food and beverage manufacturers remained consistent, but procurement cycles were relatively balanced, which limited upward pressure.
During the second quarter of 2026, the dextrose prices in China reached 478 USD/MT in June. Prices reflected a mild decline driven by adequate domestic starch supply and steady operating rates across key processing plants. Production conditions remained consistent, supported by stable raw material availability from corn based feedstock channels. Domestic demand from food processing and pharmaceutical applications stayed steady but did not show strong expansion momentum.
During the second quarter of 2026, the dextrose prices in Germany reached 630 USD/MT in June. Prices recorded an upward movement supported by tighter regional supply conditions and steady consumption from food, beverage, and pharmaceutical sectors. Import dependency played a role in shaping procurement costs, as buyers faced higher landed expenses from external suppliers. Energy and operational costs in processing units also influenced overall pricing sentiment.
During the second quarter of 2026, the dextrose prices in South Korea reached 527 USD/MT in June. Prices showed a slight decline driven by balanced import availability and stable domestic demand conditions. Supply inflow from regional trading partners remained steady, ensuring adequate market coverage for industrial buyers. Food and beverage manufacturers maintained regular procurement patterns, but purchasing intensity remained moderate. Pharmaceutical usage stayed consistent, supporting baseline consumption levels.
During the second quarter of 2026, the dextrose prices in South Africa reached 598 USD/MT in June. Prices declined moderately due to stable import inflows and sufficient stock availability across major distribution channels. Demand from food processing sectors remained steady, though purchasing activity was largely aligned with immediate consumption needs. Logistics and import parity conditions influenced overall landed costs, but supply continuity from trading partners helped maintain market balance.
Dextrose Prices Outlook Q1 2026
- USA: USD 537/MT
- China: USD 479/MT
- Germany: USD 616/MT
- South Korea: USD 528/MT
- South Africa: USD 605/MT
During the first quarter of 2026, the dextrose prices in the USA reached 537 USD/MT in March. The market experienced a slight decline due to sufficient corn feedstock availability and moderated demand from food processing industries. Production activity remained stable, ensuring adequate supply levels across the domestic market. Additionally, stable transportation and processing costs provided limited upward pressure on prices.
During the first quarter of 2026, the dextrose prices in China reached 479 USD/MT in March. The market observed a marginal decline influenced by steady domestic production and soft demand from the downstream food and beverage sectors. Corn availability remained sufficient, supporting uninterrupted manufacturing activity and stable supply levels. Export activity showed limited improvement, which contributed to comfortable inventory positions across the market.
During the first quarter of 2026, the dextrose prices in Germany reached 616 USD/MT in March. The market recorded a moderate increase, supported by firm demand from the pharmaceutical and food manufacturing industries. Additionally, elevated energy and processing costs supported upward pricing momentum. Import flows remained balanced, contributing to stable inventory conditions and reinforcing gradual price increases across the quarter.
During the first quarter of 2026, the dextrose prices in South Korea reached 528 USD/MT in March. The market experienced a steady upward trend driven by stable demand from food processing and pharmaceutical applications. Additionally, logistics expenses and stable operational costs contributed to the upward movement in prices. Market sentiment remained firm throughout the quarter due to balanced consumption and controlled supply availability.
During the first quarter of 2026, the dextrose prices in South Africa reached 605 USD/MT in March. The market observed a noticeable decline due to sufficient import availability and moderated demand from food and beverage industries. Inventory levels remained stable, reducing pressure on supply conditions. Additionally, stable logistics and operational expenses provided limited assistance to pricing trends, resulting in a gradual decline throughout the quarter.
Dextrose Prices Outlook Q2 2025
- USA: USD 611/MT
- China: USD 503/MT
- Germany: USD 674 /MT
- South Korea: USD 533 /MT
- South Africa: USD 606 /MT
During the second quarter of 2025, the dextrose prices in the USA reached 611 USD/MT in June. In the USA, dextrose prices in Q2 2025 were influenced by fluctuations in corn feedstock availability due to delayed spring planting and adverse weather in key agricultural regions. Operational disruptions at some corn wet milling facilities impacted production consistency. Additionally, steady demand from the food and pharmaceutical sectors sustained procurement levels. Transportation costs remained elevated due to fuel price volatility and regional trucking capacity constraints.
During the second quarter of 2025, dextrose prices in China reached 503 USD/MT in June. In China, dextrose pricing was affected by increased demand from the food processing and pharmaceutical sectors, particularly amid restocking activity. Corn procurement costs fluctuated due to inconsistent domestic harvest output and regional logistics bottlenecks. Environmental regulations led to intermittent shutdowns at several starch processing units, affecting production levels. Moreover, rising energy tariffs and higher labor costs exerted additional pressure on manufacturing expenses.
During the second quarter of 2025, the dextrose prices in Germany reached 674 USD/MT in June. In Germany, dextrose prices were impacted by constrained supply of corn derivatives from both domestic and Eastern European sources, influenced by weather variability and logistics congestion. The demand from the confectionery, beverage, and pharmaceutical sectors remained firm. Additionally, producers faced cost pressures due to elevated energy prices and compliance expenses related to environmental and food safety regulations, which contributed to higher processing and distribution costs.
During the second quarter of 2025, the dextrose prices in South Korea reached 533 USD/MT in June. In South Korea, dextrose pricing trends were shaped by rising import costs for corn-based inputs, as the country relies heavily on overseas supply. Supply chain delays and currency depreciation added to procurement expenses. Demand from the pharmaceutical and food formulation sectors remained stable. Manufacturers also contended with increased utility rates and packaging material costs, contributing to overall production cost escalations across the supply chain.
During the second quarter of 2025, the dextrose prices in South Africa reached 606 USD/MT in June. In South Africa, dextrose prices in Q2 2025 were influenced by limited local corn supply and high dependency on imported corn starch derivatives. Transportation delays at key ports and fluctuations in freight rates disrupted inbound shipments. The food and beverage sector maintained steady consumption levels, while power outages and load-shedding events disrupted local manufacturing operations, raising production inefficiencies and driving up processing costs.
Dextrose Prices Outlook Q1 2025
- USA: USD 598/MT
- China: USD 512/MT
- Germany: USD 651/MT
- South Korea: USD 527/MT
- South Africa: USD 615/MT
During the first quarter of 2025, the dextrose prices in the USA reached 598 USD/MT in March. Dextrose prices in the USA faced mild fluctuations in Q1 2025, influenced by corn market dynamics, freight costs, and sectoral demand variation. Strong demand from the food and beverage sector, along with pharmaceutical applications, provided pricing support. However, improved domestic corn supply and reduced input cost pressure helped stabilize prices. Port congestion early in the quarter briefly elevated logistics costs, but later normalization kept pricing largely steady, and the pharmaceutical sector remained stable, maintaining balanced market dynamics.
During the first quarter of 2025, dextrose prices in China reached 512 USD/MT in March. In China, dextrose prices declined modestly in Q1 2025 due to high production levels and sluggish downstream demand. Oversupply conditions persisted despite temporary slowdowns during the Lunar New Year. Weaker consumption from the confectionery and personal care sectors, coupled with cautious export activity, added to downward pressure. Soft domestic corn prices and easing energy costs further reduced production expenses, making Chinese exports more competitive.
During the first quarter of 2025, the dextrose prices in Germany reached 651 USD/MT in March. Germany’s dextrose prices trended upward in Q1 2025, driven by elevated energy costs, supply chain constraints, and stable demand from the pharmaceutical and food processing sectors. Delays in raw material imports and port congestion at key logistics hubs contributed to supply-side pressure. Additionally, environmental regulations increased operational costs for processors. Despite soft consumer spending, steady industrial usage supported firm pricing throughout the quarter.
During the first quarter of 2025, the dextrose prices in South Korea reached 527 USD/MT in March. Dextrose prices in South Korea experienced moderate increases during Q1 2025, driven by elevated feedstock corn import costs and steady demand from the pharmaceutical and food sectors. Weaker local currency and persistent freight rate volatility added to import pressure, especially from key suppliers in the U.S. and China. While domestic manufacturing remained stable, high energy and operational costs limited producers’ pricing flexibility. Demand from health-related segments supported firm market sentiment throughout the quarter.
During the first quarter of 2025, the dextrose prices in South Africa reached 615 USD/MT in March. In South Africa, dextrose prices remained elevated in Q1 2025 due to strong reliance on imports and domestic supply constraints. Currency depreciation and rising global shipping rates significantly impacted landed costs. Demand from the food and beverage industries stayed steady, but pharmaceutical demand was uneven. Frequent logistical disruptions, including port congestion and transport delays, added further strain. These combined factors sustained a firm pricing environment despite modest consumption growth.

Regional Coverage
The report provides a detailed analysis of the market across different regions, each with unique pricing dynamics influenced by localized market conditions, supply chain intricacies, and geopolitical factors. This includes price trends, price forecast and supply and demand trends for each region, along with spot prices by major ports. The report also provides coverage of FOB and CIF prices, as well as the key factors influencing dextrose prices.
Europe Dextrose Price Trend
Q3 2026:
The dextrose price index in Europe moved upward through the quarter, supported by firmer replacement costs and steady downstream demand across the region. Germany, a leading consuming market in the region, recorded consistent offtake from confectionery, bakery and pharmaceutical manufacturers as prompt availability stayed tight. European buyers depend heavily on imported material, so firmer freight rates and port handling charges pushed landed values higher. Currency movements against supplying origins added further uncertainty to procurement costs for regional buyers. Distributors across the region maintained conservative inventories, which limited the volume of prompt material available to non contract buyers. Logistics constraints and periodic congestion at major ports restricted the timely movement of cargo and encouraged forward purchasing.
Q2 2026:
In Europe, the dextrose price index showed firm conditions, supported by tighter supply availability and steady downstream demand from food and pharmaceutical applications. Supply flow from domestic and nearby external sources remained constrained, which reduced flexibility in spot availability for buyers. At the same time, consistent consumption from processed food manufacturers and pharmaceutical formulators kept baseline demand steady. Procurement costs remained elevated due to import reliance and stable industrial consumption patterns across key consuming hubs.
Q1 2026:
The dextrose price index in Europe showed a moderate upward trend supported by steady demand from the pharmaceutical and food processing sectors. Regional manufacturers maintained consistent production activity, ensuring balanced product availability across major European markets. At the same time, demand from pharmaceutical companies and processed food manufacturers remained firm, supporting regular procurement activity throughout the quarter. Supply conditions remained controlled due to disciplined inventory management and stable raw material availability.
Q2 2025:
As per the dextrose price index in Europe, dextrose prices in Q2 2025 were influenced by reduced availability of corn feedstock from domestic and Eastern European suppliers, driven by weather-related disruptions and logistics congestion. The demand from the food, pharmaceutical, and nutraceutical sectors remained consistent. Elevated energy prices and regulatory compliance costs increased production expenses. Additionally, transportation inefficiencies across the continent contributed to higher distribution costs for both bulk and packaged dextrose.
Q1 2025:
In Q1 2025, Germany’s dextrose market experienced a mixed pricing trend, beginning with a decline due to oversupply, high inventories, and increased competition from Asian exporters. Weak demand from the pharmaceuticals and food sectors, along with easing logistics and lower freight rates, further pressured prices through February. However, March brought a sharp rebound as labor strikes and port congestion, particularly in Hamburg, disrupted supply. Buyers from key sectors rushed to secure inventories, shifting market dynamics in favor of suppliers. The quarter closed with heightened price volatility, driven by fluctuating demand and recurring supply chain disruptions.
This analysis can be extended to include detailed dextrose price information for a comprehensive list of countries.
| Region | Countries Covered |
|---|---|
| Europe | Germany, France, United Kingdom, Italy, Spain, Russia, Turkey, Netherlands, Poland, Sweden, Belgium, Austria, Ireland, Switzerland, Norway, Denmark, Romania, Finland, Czech Republic, Portugal, and Greece, among other European countries. |
North America Dextrose Price Trend
Q3 2026:
The dextrose price index in North America moved upward during the quarter, driven by tighter prompt availability and steady demand from food and pharmaceutical manufacturers. The USA, the leading producing and consuming market in the region, saw bakery, confectionery and beverage producers maintain active procurement of available material. Firmer corn starch feedstock costs at integrated wet millers supported higher offer levels across the supply chain. Import dependent buyers faced firmer replacement costs as overseas suppliers limited prompt availability during the quarter. Distributors maintained lean inventories, which restricted the volume of material available to buyers seeking immediate deliveries.
Q2 2026:
In North America, the dextrose price index reflected mild softness due to stable corn processing output and consistent supply chain flow. Production units operated at steady rates, ensuring smooth availability of starch based sweetener output across the market. Food manufacturing demand remained steady but did not create strong incremental demand pressure beyond routine consumption cycles. Export activity remained limited, which contributed to comfortable domestic supply levels. This balanced availability reduced urgency in spot purchases and kept transaction activity moderate.
Q1 2026:
The dextrose price index in North America reflected a slight decline influenced by sufficient corn feedstock supply and moderated demand from downstream industries. Stable corn availability supported uninterrupted production activity, ensuring adequate supply levels across the regional market. Consumption from the beverage, food processing, and industrial sectors remained steady but did not show significant growth momentum. Inventory conditions remained balanced, reducing urgency among buyers and limiting aggressive procurement activity. Market participants followed cautious purchasing strategies and focused on maintaining controlled stock levels.
Q2 2025:
As per the dextrose price index, in North America, the market was affected by fluctuating corn yields due to delayed planting in major agricultural zones and variable weather conditions. The food processing, beverage, and fermentation sectors maintained steady demand. Maintenance-related slowdowns at several wet milling plants impacted output. Rising labor costs, fuel price volatility, and regional freight bottlenecks further increased costs across the supply and delivery chain.
Q1 2025:
In Q1 2025, U.S. dextrose prices experienced marked volatility, driven by shifting supply-demand dynamics and external market pressures. January saw a price decline due to weak demand, ample inventories, and port-related logistical challenges. February brought a sharp price rebound, fueled by tighter domestic supply, rising export demand from Asia and Latin America, and increased import costs due to tariffs. By March, prices declined again as inventory levels remained high, logistics improved, and buyer sentiment weakened. Competitive pricing by U.S. suppliers and falling freight rates added to the bearish tone. Overall, the quarter reflected economic uncertainty and external market instability.
Specific dextrose historical data within the United States and Canada can also be provided.
| Region | Countries Covered |
|---|---|
| North America | United States and Canada |
Middle East and Africa Dextrose Price Trend
Q3 2026:
The dextrose price index in the Middle East and Africa moved upward through the quarter, supported by steady regional demand and firmer imported replacement costs. South Africa, a leading market in the region, recorded consistent offtake from beverage, confectionery and bakery processors as prompt availability stayed tight. Firmer costs for imported material supported higher offer levels across the quarter. Gulf distribution hubs remained the principal channel for cargoes moving into surrounding consuming markets. Imported volumes faced firmer landed costs as overseas suppliers limited prompt availability. Logistics charges between ports and inland distribution centers added further pressure to delivered values.
Q2 2026:
In Middle East and Africa, pricing conditions were shaped by import dependency and logistics linked landed cost variations. Supply availability remained adequate through trading partners, although inflows varied across different entry points in the region. Demand patterns remained uneven across industrial users and food sector consumers, leading to inconsistent procurement intensity. Buyers largely focused on short term requirements, reflecting cautious market behavior. Freight costs and shipment timing influenced delivered pricing structures across key markets.
Q1 2026:
The study examines the price patterns of dextrose throughout the Middle East and Africa, taking into account variables that specifically affect market prices, such as regional industrial expansion, the availability of natural resources, and geopolitical conflicts.
Q2 2025:
As per the dextrose price chart, in the Middle East and Africa, dextrose pricing was driven by a high reliance on imported corn derivatives, with elevated international freight rates and port congestion contributing to cost escalations. Local manufacturing faced interruptions due to power supply issues and infrastructure limitations. Demand from the food, beverage, and personal care sectors remained firm, while volatile exchange rates further compounded procurement and distribution expenses across the region.
Q1 2025:
In Q1 2025, South Africa’s dextrose market experienced price volatility shaped by global supply dynamics, currency movements, and shifting demand. January saw a price decline due to strong supply and competition from Asian exporters, allowing buyers to secure favorable contracts despite import delays. February brought a sharp price rise, driven by global supply shortages, Lunar New Year disruptions, and increased demand from the food, pharmaceutical, and cosmetic sectors. In March, prices eased again as inventories remained high, logistics stabilized, and the Rand strengthened. With subdued global demand and cautious procurement, dextrose prices ended the quarter under pressure, with limited room for upward momentum.
In addition to region-wise data, information on dextrose prices for countries can also be provided.
| Region | Countries Covered |
|---|---|
| Middle East and Africa | Saudi Arabia, UAE, Israel, Iran, South Africa, Nigeria, Oman, Kuwait, Qatar, Iraq, Egypt, Algeria, and Morocco, among other Middle Eastern and African countries. |
Asia Pacific Dextrose Price Trend
Q3 2026:
The dextrose price index in Asia Pacific moved upward through the quarter, supported by firm export demand and steady processing activity across the region. China, the leading producing market in the region, saw steady domestic and overseas demand from fermentation plants and food processors absorb surplus output from its large wet milling base. South Korea recorded firmer landed values as import dependent buyers faced higher replacement costs from major supplying origins. Confectionery, bakery and beverage manufacturers across the region maintained steady procurement despite the firmer pricing environment. Firmer corn and cassava starch feedstock costs at regional producers supported higher offer levels through the quarter.
Q2 2026:
In Asia Pacific, dextrose prices witnessed a slight downward bias driven by sufficient regional supply and steady starch processing operations. Production levels across key manufacturing bases ensured consistent product availability in domestic and export markets. Demand from food, beverage, and pharmaceutical sectors remained consistent but lacked strong expansion momentum. Export competitiveness among regional suppliers supported steady trade flows, preventing sharp price movements. Inventory positions across distributors remained comfortable, reducing urgency for restocking. Spot market activity stayed moderate as buyers aligned purchases with near term consumption needs.
Q1 2026:
In the Asia Pacific region, dextrose prices showed mixed trends influenced by stable production activity and varying downstream demand conditions. Sufficient corn availability supported continuous manufacturing operations across key producing countries, ensuring balanced supply levels in the market. Demand from the food processing, beverage, and pharmaceutical industries remained stable, although consumption patterns varied among regional economies. Export activity remained moderate, contributing to controlled inventory conditions across the supply chain. Buyers adopted cautious purchasing strategies and focused on maintaining adequate stock levels without aggressive procurement.
Q2 2025:
In the Asia Pacific region, dextrose prices were shaped by strong demand from the food and pharmaceutical sectors, particularly in China, India, and Southeast Asia. Variability in corn procurement costs due to inconsistent harvests and logistical constraints influenced raw material pricing. Several starch processing facilities operated below capacity because of energy supply limitations and scheduled maintenance. Currency depreciation in multiple countries added pressure on import-dependent manufacturers.
Q1 2025:
In Q1 2025, dextrose prices in Indonesia showed significant volatility due to shifting global and domestic factors. January began with a price drop caused by ample supply, aggressive competition from Asian suppliers, and high inventories. February saw a sharp rebound as global supply tightened, raw material costs rose, and Lunar New Year-related disruptions limited affordable imports. Strong domestic demand across the food, pharmaceutical, and personal care sectors added to the pressure. In March, prices continued to rise moderately, supported by inflation, currency weakness, and logistical bottlenecks, though adequate local supply curbed extreme increases. The quarter closed with cautious optimism amid ongoing global uncertainties.
This dextrose price analysis can be expanded to include a comprehensive list of countries within the region.
| Region | Countries Covered |
|---|---|
| Asia Pacific | China, India, Indonesia, Pakistan, Bangladesh, Japan, Philippines, Vietnam, Thailand, South Korea, Malaysia, Nepal, Taiwan, Sri Lanka, Hongkong, Singapore, Australia, and New Zealand, among other Asian countries. |
Latin America Dextrose Price Trend
Q3 2026:
The dextrose market in Latin America is primarily shaped by regional import dependency and downstream industrial demand across bakery, confectionery, and pharmaceutical applications. However, due to logistics constraints and varying regulatory regimes, dextrose prices might fluctuate dynamically across the region.
Q2 2026:
The supply chain is frequently impacted by logistical inefficiencies and infrastructure problems, which make it difficult for the area to reliably satisfy demand from elsewhere. When examining dextrose pricing trends in this area, it is also important to take into account the dextrose price index, economic volatility, and currency devaluation.
Q1 2026:
The dextrose industry in Latin America is mostly driven by the region's abundant natural resources, especially in nations like Brazil and Chile. However, there can be a lot of volatility in dextrose prices due to political unpredictability and varied regulations.
Q2 2025:
Latin America's dextrose market is predominantly influenced by its rich natural reserves, particularly in countries like Chile and Brazil. However, political instability and inconsistent regulatory frameworks can lead to significant volatility in dextrose prices. Infrastructure challenges and logistical inefficiencies often impact the supply chain, affecting the region's ability to meet international demand consistently. Moreover, the dextrose price index, economic fluctuations, and currency devaluation are critical factors that need to be considered when analyzing dextrose pricing trends in this region.
This comprehensive review can be extended to include specific countries within the region.
| Region | Countries Covered |
|---|---|
| Latin America | Brazil, Mexico, Argentina, Columbia, Chile, Ecuador, and Peru, among other Latin American countries. |
Dextrose Pricing Report, Market Analysis, and News
IMARC's latest publication, “Dextrose Prices, Trend, Chart, Demand, Market Analysis, News, Historical and Forecast Data Report 2026 Edition,” presents a detailed examination of the dextrose market, providing insights into both global and regional trends that are shaping prices. This report delves into the spot price of dextrose at major ports and analyzes the composition of prices, including FOB and CIF terms. It also presents detailed dextrose prices trend analysis by region, covering North America, Europe, Asia Pacific, Latin America, and Middle East and Africa. The factors affecting dextrose pricing, such as the dynamics of supply and demand, geopolitical influences, and sector specific developments, are thoroughly explored. This comprehensive report helps stakeholders stay informed with the latest market news, regulatory updates, and technological progress, facilitating informed strategic decision-making and forecasting.
Dextrose Industry Analysis
The global dextrose market size reached USD 7.1 Billion in 2025. By 2034, IMARC Group expects the market to reach USD 13.8 Billion, at a projected CAGR of 7.39% during 2026-2034. Market growth is being driven by rising use of dextrose in bakery and confectionery products, expanding demand for sports nutrition and functional beverages, and growing application of dextrose as a fermentation feedstock in pharmaceutical and biochemical manufacturing across global markets.
Latest News and Developments:
- May 2026: Researchers developed a sustainable method for xylanase production using green coconut waste as a lignocellulosic substrate through solid state fermentation, supporting advancements in dextrose and biomass conversion industries. Statistical optimization techniques improved enzymatic yield and identified ideal reaction conditions for enhanced catalytic efficiency and thermal stability. The xylanase also demonstrated strong halotolerance under high salinity conditions. When applied to sugarcane bagasse, the enzyme enabled efficient release of reducing sugars, including dextrose precursors, highlighting its potential in agro industrial residue bioconversion and industrial biotechnology applications.
Product Description
Dextrose is the common commercial name for D-glucose, the naturally occurring dextrorotatory form of glucose, a simple sugar classified as a monosaccharide. Its molecular formula, expressed in Hill notation, is C₆H₁₂O₆. In its refined commercial form, dextrose is a white crystalline solid that is freely soluble in water and less sweet than sucrose. The principal commercial raw material is starch, most commonly obtained from corn, although wheat, potato, rice, and cassava starches are also used. Industrial production generally begins with the gelatinization of starch, followed by enzymatic liquefaction with α-amylase, which hydrolyzes the long starch chains to form shorter dextrins. Saccharification with glucoamylase (amyloglucosidase) then hydrolyzes these dextrins and oligosaccharides to produce glucose. The resulting glucose liquor is clarified and typically subjected to decolorization, often using activated carbon, followed by demineralization using ion-exchange resins. The purified liquor is subsequently concentrated by evaporation and may be further processed to obtain the required crystalline or liquid dextrose product.
Report Coverage
| Key Attributes | Details |
|---|---|
| Product Name | Dextrose |
| Report Features | Exploration of Historical Trends and Market Outlook, Industry Demand, Industry Supply, Gap Analysis, Challenges, Dextrose Price Analysis, and Segment-Wise Assessment. |
| Currency/Units | US$ (Data can also be provided in local currency) or Metric Tons |
| Region/Countries Covered | The current coverage includes analysis at the global and regional levels only. Based on your requirements, we can also customize the report and provide specific information for the following countries: Asia Pacific: China, India, Indonesia, Pakistan, Bangladesh, Japan, Philippines, Vietnam, Thailand, South Korea, Malaysia, Nepal, Taiwan, Sri Lanka, Hongkong, Singapore, Australia, and New Zealand Europe: Germany, France, United Kingdom, Italy, Spain, Russia, Turkey, Netherlands, Poland, Sweden, Belgium, Austria, Ireland, Switzerland, Norway, Denmark, Romania, Finland, Czech Republic, Portugal and Greece North America: United States and Canada Latin America: Brazil, Mexico, Argentina, Columbia, Chile, Ecuador, and Peru Middle East & Africa: Saudi Arabia, UAE, Israel, Iran, South Africa, Nigeria, Oman, Kuwait, Qatar, Iraq, Egypt, Algeria, and Morocco The list of countries presented is not exhaustive. Information on additional countries can be provided if required by the client. |
| Information Covered for Key Suppliers |
|
| Customization Scope | The report can be customized as per the requirements of the customer |
| Report Price and Purchase Option |
Plan A: Monthly Updates - Annual Subscription
Plan B: Quarterly Updates - Annual Subscription
Plan C: Biannually Updates - Annual Subscription
|
| Post-Sale Analyst Support | 360-degree analyst support after report delivery |
| Delivery Format | PDF and Excel through email (We can also provide the editable version of the report in PPT/Word format on special request) |
Key Benefits for Stakeholders:
- IMARC’s report presents a detailed analysis of dextrose pricing, covering global and regional trends, spot prices at key ports, and a breakdown of FOB and CIF prices.
- The study examines factors affecting dextrose price trend, including input costs, supply-demand shifts, and geopolitical impacts, offering insights for informed decision-making.
- The competitive landscape review equips stakeholders with crucial insights into the latest market news, regulatory changes, and technological advancements, ensuring a well-rounded, strategic overview for forecasting and planning.
- IMARC offers various subscription options, including monthly, quarterly, and biannual updates, allowing clients to stay informed with the latest market trends, ongoing developments, and comprehensive market insights. The dextrose price charts ensure our clients remain at the forefront of the industry.
Need more help?
- Speak to our experienced analysts for insights on the current market scenarios.
- Include additional segments and countries to customize the report as per your requirement.
- Gain an unparalleled competitive advantage in your domain by understanding how to utilize the report and positively impacting your operations and revenue.
- For further assistance, please connect with our analysts.
 Request Customization
 Inquire Before Buying
 Speak to an Analyst
 Request Brochure
Benefits of Customization
- Personalize this research
- Triangulate with your data
- Get data as per your format and definition
- Gain a deeper dive into a specific application, geography, customer, or competitor
- Any level of personalization
Get in Touch With Us
UNITED STATES
Phone: +1-201-971-6302
INDIA
Phone: +91-120-433-0800
UNITED KINGDOM
Phone: +44-753-714-6104
Email: [email protected]
Client Testimonials




















Related Reports

Why Choose Us
IMARC offers trustworthy, data-centric insights into commodity pricing and evolving market trends, enabling businesses to make well-informed decisions in areas such as procurement, strategic planning, and investments. With in-depth knowledge spanning more than 1000 commodities and a vast global presence in over 150 countries, we provide tailored, actionable intelligence designed to meet the specific needs of diverse industries and markets.
1000
+Commodities
150
+Countries Covered
3000
+Clients
20
+Industry

Robust Methodologies & Extensive Resources
IMARC delivers precise commodity pricing insights using proven methodologies and a wealth of data to support strategic decision-making.

Subscription-Based Databases
Our extensive databases provide detailed commodity pricing, import-export trade statistics, and shipment-level tracking for comprehensive market analysis.

Primary Research-Driven Insights
Through direct supplier surveys and expert interviews, we gather real-time market data to enhance pricing accuracy and trend forecasting.

Extensive Secondary Research
We analyze industry reports, trade publications, and market studies to offer tailored intelligence and actionable commodity market insights.
Trusted by 3000+ industry leaders worldwide to drive data-backed decisions. From global manufacturers to government agencies, our clients rely on us for accurate pricing, deep market intelligence, and forward-looking insights.