
EAS Antennas Market Report by Product Type (RF Technology EAS, Acoustic Magnetic Technique EAS, and Others), Application (Apparel and Fashion Accessories Stores, Cosmetics and Medical Stores, Supermarkets and Large Grocery Stores, and Others), and Region 2026-2034
Market Overview:
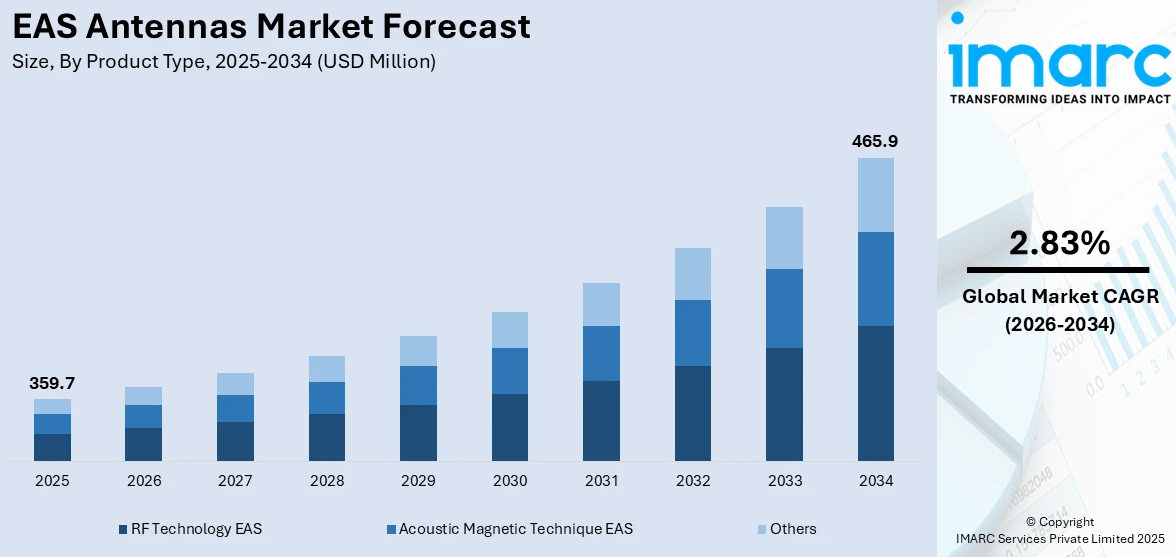
The global EAS antennas market size reached USD 359.7 Million in 2025. Looking forward, IMARC Group expects the market to reach USD 465.9 Million by 2034, exhibiting a growth rate (CAGR) of 2.83% during 2026-2034.
|
Report Attribute
|
Key Statistics
|
|---|---|
|
Base Year
|
2025
|
|
Forecast Years
|
2026-2034
|
|
Historical Years
|
2020-2025
|
|
Market Size in 2025
|
USD 359.7 Million |
|
Market Forecast in 2034
|
USD 465.9 Million |
| Market Growth Rate 2026-2034 | 2.83% |
Electronic article surveillance (EAS) antennas are loss prevention systems that deter shoplifting and offer protection to a store or retail chain through tags and labels. They send and receive signals at a specific frequency, generally within a specific range, to detect and activate the store alarm and prevent unnecessary alarms. They are commonly pinned on apparel, handbags, accessories, golf clubs, liquor bottles, eyewear, boxed merchandise, shoes, and waterproof items. They are placed at the exits and entrances ofa store to create an invisible gate and detect the passage of unauthorized items and promptly alert the staff. They are cost-effective, improve product safety, increase brand awareness, and enhance the experience of the consumer.
To get more information on this market Request Sample
EAS Antennas Market Trends:
A considerable number of people shopping offline from retail stores represents one of the major factors positively influencing the demand for EAS antennas around the world. In addition, rising instances of theft and burglaries are driving their adoption to provide real-time alerts against shoplifting. Moreover, the growing awareness among retailers and store owners about the benefits of using EAS antennas like protection against inventory losses is driving the market. Apart from this, key players are introducing smart security systems that provide high stability, ultra-wide detection distance, reduce false alarms, and have strong anti-interference capabilities. This, coupled with the escalating demand for EAS antennas in the healthcare industry, is creating a positive outlook for the market.
Key Market Segmentation:
IMARC Group provides an analysis of the key trends in each sub-segment of the global EAS antennas market report, along with forecasts at the global, regional and country level from 2026-2034. Our report has categorized the market based on product type and application.
Breakup by Product Type:
- RF Technology EAS
- Acoustic Magnetic Technique EAS
- Others
RF technology EAS dominates the market as it is affordable and offer a wide range of label shapes, sizes, and presentation.
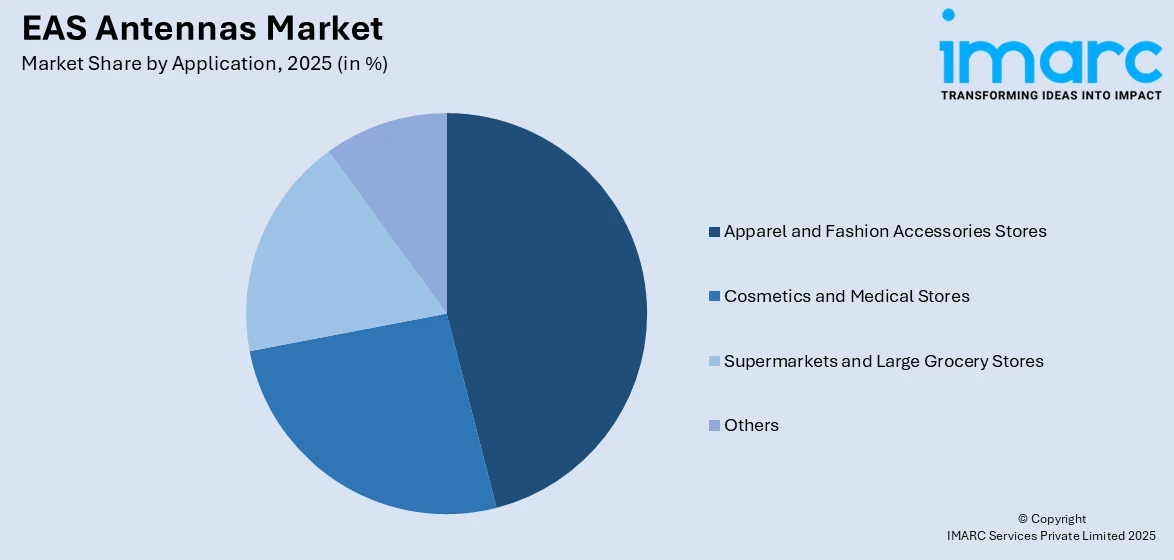
Breakup by Application:
Access the comprehensive market breakdown Request Sample
- Apparel and Fashion Accessories Stores
- Cosmetics and Medical Stores
- Supermarkets and Large Grocery Stores
- Others
Apparel and fashion accessories stores currently dominate the market.
Breakup by Region:
- North America
- United States
- Canada
- Asia Pacific
- China
- Japan
- India
- South Korea
- Australia
- Indonesia
- Others
- Europe
- Germany
- France
- United Kingdom
- Italy
- Spain
- Russia
- Others
- Latin America
- Brazil
- Mexico
- Others
- Middle East and Africa
North America holds the majority of the global EAS antennas market share due to the increasing number of retail stores in the apparel, supermarket, and mass merchandise ofthe region.
Competitive Landscape:
The competitive landscape of the market has been analyzed in the report, along with the detailed profiles of the major players operating in the industry. Some of these players are Agon Systems Ltd., CCL Industries Inc., Great Eastern IDTech Pvt. Ltd., GLOVERETAIL, Gunnebo AB, Hangzhou Century Co.,Ltd., Nedap N.V., Johnson Controls International Plc, TAG Worldwide Group Limited, and WG Security Products, Inc.
Report Coverage:
| Report Features | Details |
|---|---|
| Base Year of the Analysis | 2025 |
| Historical Period | 2020-2025 |
| Forecast Period | 2026-2034 |
| Units | Million USD |
| Segment Coverage | Product Type, Application, Region |
| Region Covered | Asia Pacific, Europe, North America, Latin America, Middle East and Africa |
| Countries Covered | United States, Canada, Germany, France, United Kingdom, Italy, Spain, Russia, China, Japan, India, South Korea, Australia, Indonesia, Brazil, Mexico |
| Companies Covered | Agon Systems Ltd., CCL Industries Inc., Great Eastern IDTech Pvt. Ltd., GLOVERETAIL, Gunnebo AB, Hangzhou Century Co.,Ltd., Nedap N.V., Johnson Controls International Plc, TAG Worldwide Group Limited, and WG Security Products, Inc. |
| Customization Scope | 10% Free Customization |
| Post-Sale Analyst Support | 10-12 Weeks |
| Delivery Format | PDF and Excel through Email (We can also provide the editable version of the report in PPT/Word format on special request) |
Frequently Asked Questions About the EAS Antennas Market Report
The global EAS antennas market was valued at USD 359.7 Million in 2025.
We expect the global EAS antennas market to exhibit a CAGR of 2.83% during 2026-2034.
The rising instances of burglaries, coupled with the growing popularity of EAS antennas to deter shoplifting and offer protection to a store or retail chain via tags and labels, are primarily driving the global EAS antennas market.
The sudden outbreak of the COVID-19 pandemic had led to the implementation of stringent lockdown regulations across several nations resulting in temporary closure of numerous manufacturing units for EAS antennas.
Based on the product type, the global EAS antennas market has been segmented into RF technology EAS, acoustic magnetic technique EAS, and others. Among these, RF technology EAS represents the largest market share.
Based on the application, the global EAS antennas market can be bifurcated into apparels and fashion accessories stores, cosmetics and medical stores, supermarkets and large grocery stores, and others. Currently, apparels and fashion accessories stores account for the majority of the total market share.
On a regional level, the market has been classified into North America, Europe, Asia Pacific, Middle East and Africa, and Latin America, where North America currently dominates the global market.
Some of the major players in the global EAS antennas market include Agon Systems Ltd., CCL Industries Inc., Great Eastern IDTech Pvt. Ltd., GLOVERETAIL, Gunnebo AB, Hangzhou Century Co.,Ltd., Nedap N.V., Johnson Controls International Plc, TAG Worldwide Group Limited, and WG Security Products, Inc.
Need more help?
- Speak to our experienced analysts for insights on the current market scenarios.
- Include additional segments and countries to customize the report as per your requirement.
- Gain an unparalleled competitive advantage in your domain by understanding how to utilize the report and positively impacting your operations and revenue.
- For further assistance, please connect with our analysts.
 Request Customization
 Speak to an Analyst
 Request Brochure
 Inquire Before Buying
Benefits of Customization
- Personalize this research
- Triangulate with your data
- Get data as per your format and definition
- Gain a deeper dive into a specific application, geography, customer, or competitor
- Any level of personalization
Get in Touch With Us
UNITED STATES
Phone: +1-201-971-6302
INDIA
Phone: +91-120-433-0800
UNITED KINGDOM
Phone: +44-753-714-6104
Email: [email protected]
Client Testimonials


.webp)


