
East Africa Ceramic Tiles Market Report by Type (Floor Tiles, Wall Tiles, and Others), Application (Residential Applications, Commercial Applications, Replacement Applications), and Country 2025-2033
Market Overview:
The East Africa ceramic tiles market size reached USD 2.5 Billion in 2024. Looking forward, IMARC Group expects the market to reach USD 4.3 Billion by 2033, exhibiting a growth rate (CAGR) of 5.79% during 2025-2033.
|
Report Attribute
|
Key Statistics
|
|---|---|
|
Base Year
|
2024
|
|
Forecast Years
|
2025-2033
|
|
Historical Years
|
2019-2024
|
|
Market Size in 2024
|
USD 2.5 Billion |
|
Market Forecast in 2033
|
USD 4.3 Billion |
| Market Growth Rate 2025-2033 | 5.79% |
Ceramic tiles are manufactured by mixing clays, water, sand and quartz. They are further subjected to heat in a kiln to harden the shape by eliminating the moisture content. Since they are durable, convenient, easy to clean and maintain, they are utilized for flooring solutions across residential and commercial spaces. They are widely available in different designs, colors and sizes as glazed ceramics, wall tiles and floor tiles across East Africa.
The market in East Africa is primarily driven by significant growth in the construction industry. Moreover, the increasing investments by the government of numerous countries across the region in residential and infrastructural development projects are providing an impetus to the market growth. Along with this, significant growth in the hospitality industry is expected to provide a boost to the sales of ceramic tiles across the region. Some of the other factors contributing to the market growth across the region include continual advancements in production technology and the launch of anti-skid and anti-scratch product variants in the market.
Key Market Segmentation:
IMARC Group provides an analysis of the key trends in each sub-segment of the East Africa ceramic tiles market report, along with forecasts at the regional and country level from 2025-2033. Our report has categorized the market based on type and application.
Breakup by Type:
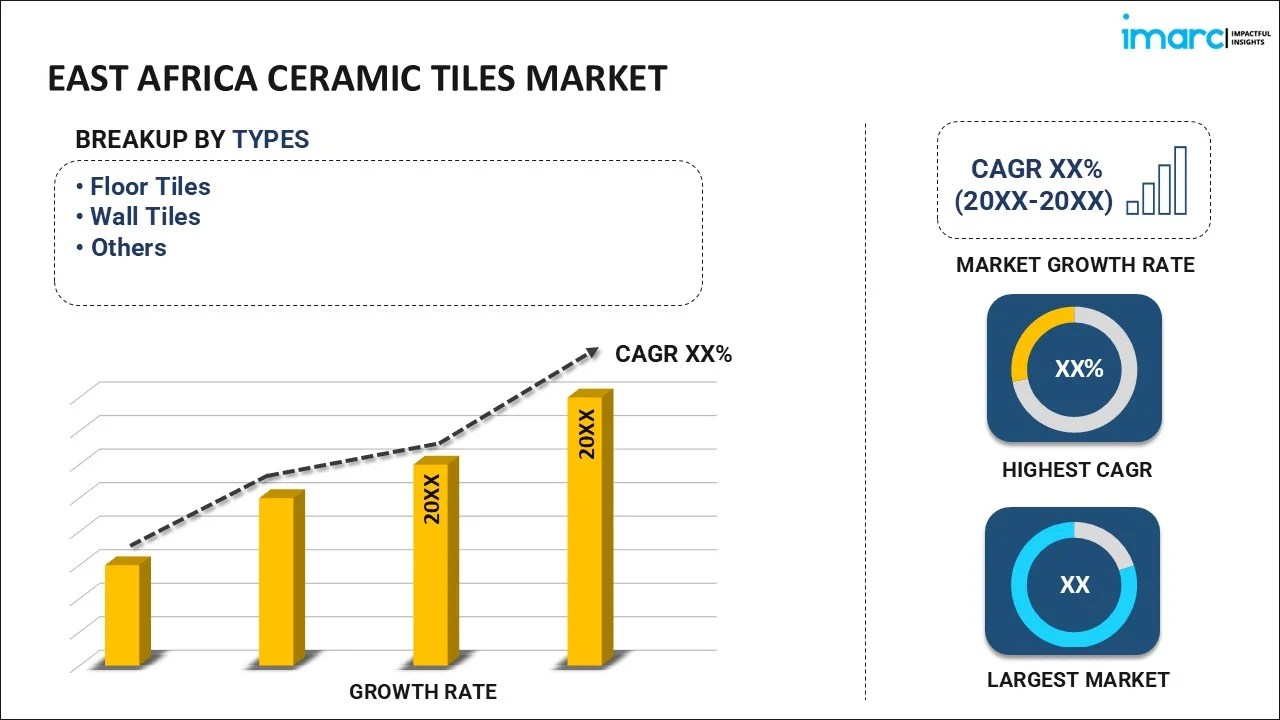
- Floor Tiles
- Wall Tiles
- Others
Breakup by Application:
- Residential Applications
- Commercial Applications
- Replacement Applications
Breakup by Country:
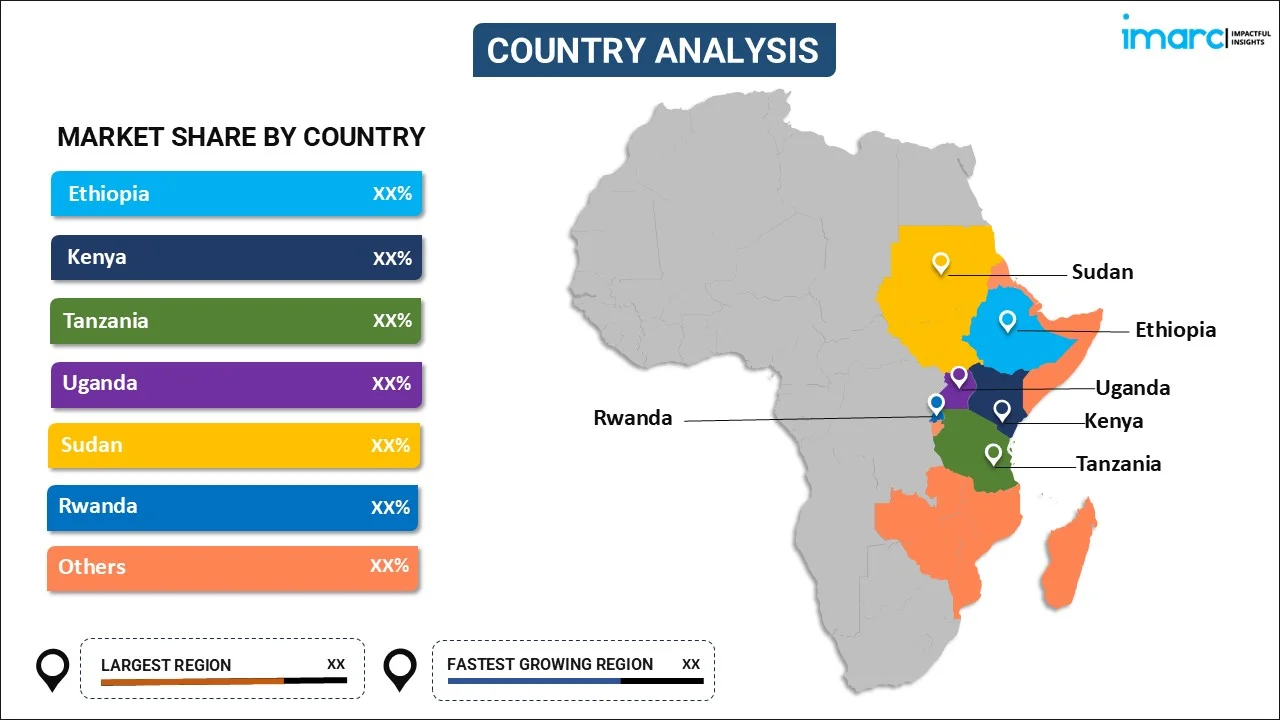
- Ethiopia
- Kenya
- Tanzania
- Uganda
- Sudan
- Rwanda
- Others
Competitive Landscape:
The competitive landscape of the industry has also been examined along with the profiles of the key players.
Report Coverage:
| Report Features | Details |
|---|---|
| Base Year of the Analysis | 2024 |
| Historical Period | 2019-2024 |
| Forecast Period | 2025-2033 |
| Units | Billion USD |
| Segment Coverage | Type, Application, Country |
| Countries Covered | Ethiopia, Kenya, Tanzania, Uganda, Sudan, Rwanda, Others |
| Customization Scope | 10% Free Customization |
| Post-Sale Analyst Support | 10-12 Weeks |
| Delivery Format | PDF and Excel through Email (We can also provide the editable version of the report in PPT/Word format on special request) |
Key Questions Answered in This Report:
- How has the East Africa ceramic tiles market performed so far and how will it perform in the coming years?
- What has been the impact of COVID-19 on the East Africa ceramic tiles market?
- What are the key regional markets?
- What is the breakup of the market based on the type?
- What is the breakup of the market based on the application?
- What are the various stages in the value chain of the industry?
- What are the key driving factors and challenges in the industry?
- What is the structure of the East Africa ceramic tiles market and who are the key players?
- What is the degree of competition in the industry?
Need more help?
- Speak to our experienced analysts for insights on the current market scenarios.
- Include additional segments and countries to customize the report as per your requirement.
- Gain an unparalleled competitive advantage in your domain by understanding how to utilize the report and positively impacting your operations and revenue.
- For further assistance, please connect with our analysts.
 Request Customization
 Speak to an Analyst
 Request Brochure
 Inquire Before Buying
Benefits of Customization
- Personalize this research
- Triangulate with your data
- Get data as per your format and definition
- Gain a deeper dive into a specific application, geography, customer, or competitor
- Any level of personalization
Get in Touch With Us
UNITED STATES
Phone: +1-201-971-6302
INDIA
Phone: +91-120-433-0800
UNITED KINGDOM
Phone: +44-753-714-6104
Email: [email protected]
Client Testimonials


.webp)


