
East Africa Generic Drug Market Report by Segment (Unbranded Generics, Branded Generics), Therapy Area (Central Nervous System, Cardiovascular, Dermatology, Genitourinary/Hormonal, Respiratory, Rheumatology, Diabetes, Oncology, and Others), Drug Delivery (Oral, Injectables, Dermal/Topical, Inhalers), Distribution Channel (Retail Pharmacies, Hospital Pharmacies), and Country 2026-2034
Market Overview:
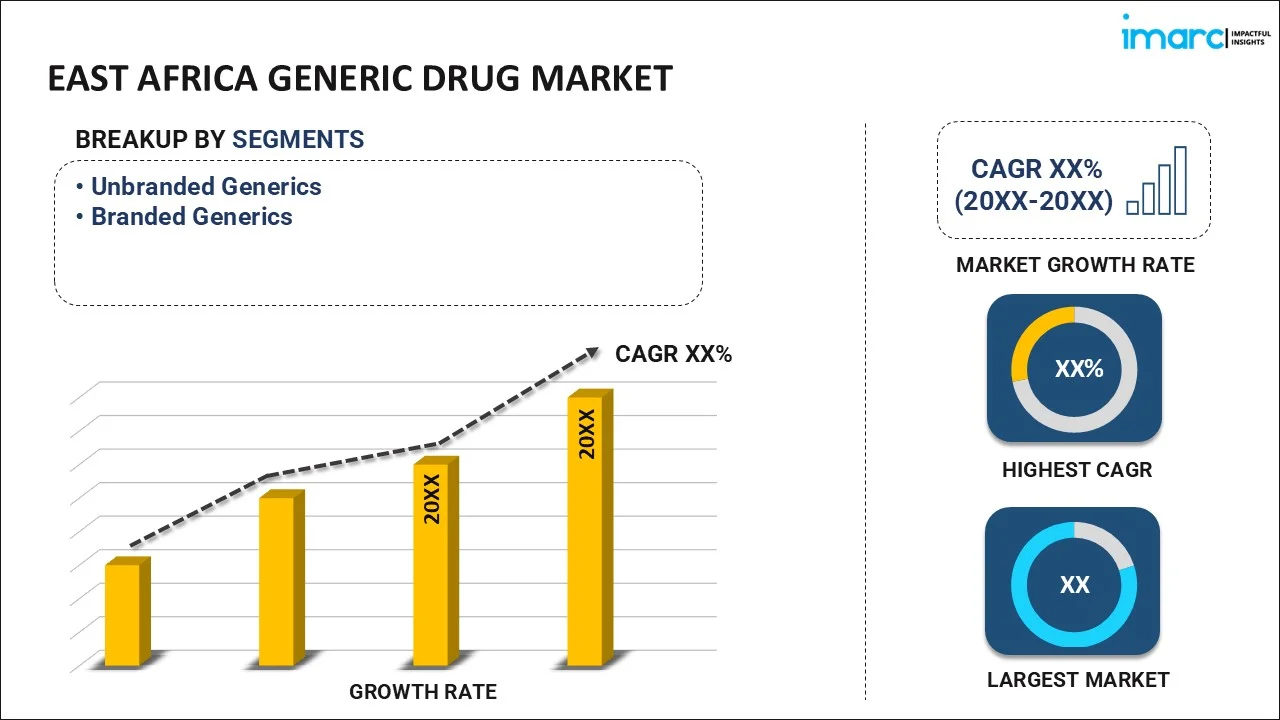
The East Africa generic drug market size reached USD 2.6 Billion in 2025. Looking forward, IMARC Group expects the market to reach USD 4.6 Billion by 2034, exhibiting a growth rate (CAGR) of 6.45% during 2026-2034. Rising healthcare costs, an increasing disease burden driving the demand for affordable treatments, the expiration of numerous branded drug patents and supportive government initiatives are playing a key role in driving the market growth.
|
Report Attribute
|
Key Statistics
|
|---|---|
|
Base Year
|
2025
|
|
Forecast Years
|
2026-2034
|
|
Historical Years
|
2020-2025
|
|
Market Size in 2025
|
USD 2.6 Billion |
|
Market Forecast in 2034
|
USD 4.6 Billion |
|
Market Growth Rate 2026-2034
|
6.45% |
Access the full market insights report Request Sample
Generic drugs are pharmaceutical alternatives that provide the same medicinal efficacy as their branded counterparts. They are produced after the patent of the original drug expires and are chemically identical to brand-name drugs. They also meet the same standards set by regulatory authorities encompassing parameters like dosage form, safety, strength, route of administration, quality, and performance characteristics. The primary advantage of generic drugs is their cost-effectiveness, as they are typically priced significantly lower due to the absence of associated research, development, and marketing costs.
One of the primary drivers of the market is the rapid expansion of local pharmaceutical manufacturing capacities. East Africa is experiencing a significant boost in its pharmaceutical production driven by a combination of increased domestic and international investment, improved technological capabilities, and a strategic push for self-sufficiency in pharmaceutical supply. Furthermore, there is a rising awareness among healthcare professionals and patients about the comparable efficacy of generic drugs to brand-name counterparts. This awareness is being created through a variety of channels, including educational programs, advocacy campaigns, and health system reforms. Moreover, generic drug manufacturers are significantly strengthening their distribution networks to improve product reach. This involves the development of efficient supply chain strategies and logistics networks to ensure generic drugs are accessible even in remote regions. This expanded distribution is further facilitated by technological advancements, such as digital platforms and delivery systems, enabling broader dissemination of generic drugs across the region.
East Africa Generic Drug Market Trends/Drivers:
Escalating Healthcare Costs and Disease Burden
The escalating healthcare costs and the need for affordable treatments serve as a major propellant for the generic drugs market in East Africa. The region has a high prevalence of communicable diseases such as HIV/AIDS, malaria, and tuberculosis, which necessitates accessible and economical medicinal solutions. Generic drugs, being cost-effective alternatives to branded medicines, offer a viable solution. The reduced pricing, attributed to the absence of research and development expenditures, makes healthcare more attainable for a wider population segment, particularly the economically vulnerable groups. By offering similar therapeutic effects at lower prices, generic drugs help alleviate the economic burden of healthcare, fostering overall the market growth.
Favorable Government Initiatives
Governments across East Africa are progressively acknowledging the role of generic drugs in achieving healthcare affordability and accessibility. They are implementing regulatory reforms to simplify the approval process, thereby encouraging their use. Traditionally, gaining approval for new drugs can be a long, complex, and costly process. By streamlining this process, governments are reducing barriers to entry, making it easier for generic manufacturers to bring their products to market. Moreover, there is an increase in governmental efforts to boost public awareness about the efficacy and affordability of generic drugs. Despite their lower cost, generic drugs are equally effective as their branded counterparts. However, misconceptions about their quality and efficacy persist. Through awareness campaigns and educational initiatives, governments aim to promote the understanding that generics offer the same therapeutic benefits as branded drugs.
East Africa Generic Drug Industry Segmentation:
IMARC Group provides an analysis of the key trends in each segment of the East Africa generic drug market report, along with forecasts at the regional and country levels from 2026-2034. Our report has categorized the market based on segment, therapy area, drug delivery and distribution channel.
Breakup by Segment:
To get detailed segment analysis of this market Request Sample
- Unbranded Generics
- Branded Generics
The report has provided a detailed breakup and analysis of the market based on the segment. This includes unbranded generics and branded generics.
Unbranded generics lack a brand name and are usually identified by their chemical name. These drugs are typically the most cost-effective as they lack marketing expenses and can be purchased at significantly lower prices than their branded counterparts. On the other hand, branded generics are assigned a brand name by their manufacturer. This category usually has a slightly higher price than unbranded generics due to the associated marketing and branding costs. However, branded generics often enjoy higher consumer trust and recognition because of their association with a brand.
Breakup by Therapy Area:
- Central Nervous System
- Cardiovascular
- Dermatology
- Genitourinary/Hormonal
- Respiratory
- Rheumatology
- Diabetes
- Oncology
- Others
Central nervous system represents the leading therapy area
The report has provided a detailed breakup and analysis of the market based on the therapy area. This includes central nervous system, cardiovascular, dermatology, genitourinary/hormonal, respiratory, rheumatology, diabetes, oncology, and others. According to the report, central nervous system represented the largest segment.
There is a rising prevalence of neurological disorders in the region, due to an aging population, lifestyle changes, and enhanced disease recognition and diagnosis. In addition to this, the cost of CNS-targeted brand-name drugs can be high, necessitating the use of more affordable generic alternatives. Generic drugs make treatment more accessible, ensuring patients can manage their conditions without incurring excessive costs. Moreover, numerous CNS drugs have seen their patents expire recently, allowing generic manufacturers to produce and market these medications. This increase in available products is driving growth in this segment.
Breakup by Drug Delivery:
- Oral
- Injectables
- Dermal/Topical
- Inhalers
Oral drugs account for the largest market share
The report has provided a detailed breakup and analysis of the market based on the drug delivery. This includes oral, injectables, dermal/topical, and inhalers. According to the report, oral drugs represented the largest segment.
The administration of oral drugs is simpler and more convenient compared to other methods and does not require the assistance of a healthcare professional. This ease of administration makes oral drugs the preferred option for long-term and home-based treatments, particularly in areas where healthcare facilities and professional medical assistance may not be readily available. Besides, the production of oral drugs often involves fewer complexities and lower costs than other drug forms, which aligns well with the economic structure of the market. Also, the widespread prevalence of diseases that are commonly treated with oral medications has created a high demand for oral generic drugs in the region. Along with this, the development and refinement of drug delivery technologies have enabled improved absorption and effectiveness of orally administered drugs, making them a reliable choice for both manufacturers and patients.
Breakup by Distribution Channel:
- Retail Pharmacies
- Hospital Pharmacies
Retail pharmacies account for the majority of the market share
The report has provided a detailed breakup and analysis of the market based on the distribution channel. This includes retail pharmacies and hospital pharmacies. According to the report, retail pharmacies represented the largest segment.
Retail pharmacies provide easy access to medications for the general population. They are usually conveniently located in both urban and rural areas, making drugs readily available even to those living in remote locations. Furthermore, retail pharmacies often have extended operating hours, allowing consumers to purchase medications outside of typical healthcare facility hours. These establishments also provide consumers with the opportunity to engage directly with pharmacists, which allows for personalized advice, medication guidance, and potential identification of drug interactions, thus enhancing the overall care provision.
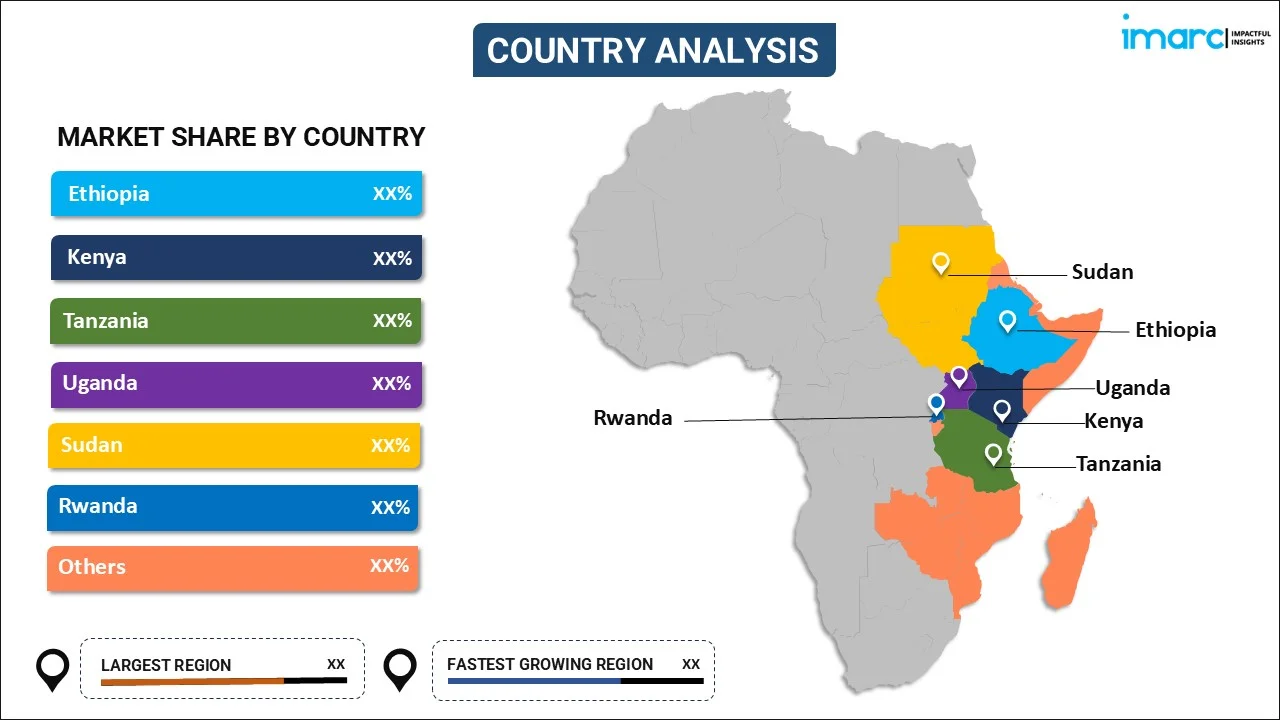
Breakup by Country:
To get detailed regional analysis of this market Request Sample
- Ethiopia
- Kenya
- Tanzania
- Uganda
- Sudan
- Rwanda
- Others
The report has also provided a comprehensive analysis of all the major regional markets, which include Ethiopia, Kenya, Tanzania, Uganda, Sudan, Rwanda, and Others.
Competitive Landscape:
Key players in the market are actively implementing various strategies to expand their reach and market share. For instance, they are enhancing their production capabilities, both in terms of volume and the range of products. They are investing in advanced manufacturing facilities to increase output and meet the rising demand for generic drugs. Companies are also creating more efficient supply chains and distribution networks to ensure wider availability of their products. They are reaching out to remote areas and partnering with local distributors to improve access. Key players are forming alliances with local manufacturers, international partners, and healthcare providers to extend their reach and enhance their market position. These partnerships can also involve knowledge and technology transfer, thereby strengthening local capacities.
The report has provided a comprehensive analysis of the competitive landscape in the market. Detailed profiles of all major companies have also been provided.
East Africa Generic Drug Market Report Scope:
| Report Features | Details |
|---|---|
| Base Year of the Analysis | 2025 |
| Historical Period | 2020-2025 |
| Forecast Period | 2026-2034 |
| Units | Billion USD |
| Scope of the Report | Exploration of Historical and Forecast Trends, Industry Catalysts and Challenges, Segment-Wise Historical and Predictive Market Assessment:
|
| Segments Covered | Unbranded Generics, Branded Generics |
| Therapy Areas Covered | Central Nervous System, Cardiovascular, Dermatology, Genitourinary/Hormonal, Respiratory, Rheumatology, Diabetes, Oncology, Others |
| Drug Deliveries Covered | Oral, Injectables, Dermal/Topical, Inhalers |
| Distribution Channels Covered | Retail Pharmacies, Hospital Pharmacies |
| Countries Covered | Ethiopia, Kenya, Tanzania, Uganda, Sudan, Rwanda, Others |
| Customization Scope | 10% Free Customization |
| Post-Sale Analyst Support | 10-12 Weeks |
| Delivery Format | PDF and Excel through Email (We can also provide the editable version of the report in PPT/Word format on special request) |
Key Benefits for Stakeholders:
- IMARC’s report offers a comprehensive quantitative analysis of various market segments, historical and current market trends, market forecasts, and dynamics of the East Africa generic drug market from 2020-2034.
- The research study provides the latest information on the market drivers, challenges, and opportunities in the East Africa generic drug market.
- Porter's five forces analysis assist stakeholders in assessing the impact of new entrants, competitive rivalry, supplier power, buyer power, and the threat of substitution. It helps stakeholders to analyze the level of competition within the East Africa generic drug industry and its attractiveness.
- Competitive landscape allows stakeholders to understand their competitive environment and provides an insight into the current positions of key players in the market.
Frequently Asked Questions About the East Africa Generic Drug Market Report
The East Africa generic drug market was valued at USD 2.6 Billion in 2025.
We expect the East Africa generic drug market to exhibit a CAGR of 6.45% during 2026-2034.
The rising prevalence of numerous chronic diseases, such as diabetes, dyslipidemia, hypertension, etc., owing to the sedentary lifestyles, hectic work schedules, and changing dietary patterns of the consumers, is primarily driving the East Africa generic drug market.
The sudden outbreak of the COVID-19 pandemic has led to extensive R&D activities pertaining to the launch of generic drugs to combat the spread of the coronavirus infection across several East African nations.
Based on the therapy area, the East Africa generic drug market can be categorized into central nervous system, cardiovascular, dermatology, genitourinary/hormonal, respiratory, rheumatology, diabetes, oncology, and others. Currently, central nervous system accounts for the majority of the total market share.
Based on the drug delivery, the East Africa generic drug market has been segregated into oral, injectables, dermal/topical, and inhalers. Among these, oral currently exhibits a clear dominance in the market.
Based on the distribution channel, the East Africa generic drug market can be bifurcated into retail pharmacies and hospital pharmacies. Currently, retail pharmacies hold the largest market share.
On a regional level, the market has been classified into Ethiopia, Kenya, Tanzania, Uganda, Sudan, Rwanda, and others.
Need more help?
- Speak to our experienced analysts for insights on the current market scenarios.
- Include additional segments and countries to customize the report as per your requirement.
- Gain an unparalleled competitive advantage in your domain by understanding how to utilize the report and positively impacting your operations and revenue.
- For further assistance, please connect with our analysts.
 Request Customization
 Speak to an Analyst
 Request Brochure
 Inquire Before Buying
Benefits of Customization
- Personalize this research
- Triangulate with your data
- Get data as per your format and definition
- Gain a deeper dive into a specific application, geography, customer, or competitor
- Any level of personalization
Get in Touch With Us
UNITED STATES
Phone: +1-201-971-6302
INDIA
Phone: +91-120-433-0800
UNITED KINGDOM
Phone: +44-753-714-6104
Email: [email protected]
Client Testimonials


.webp)


