
Electric Bus Charging Station Market Size, Share, Trends and Forecast by Type, Charger, Power, and Region, 2026-2034
Electric Bus Charging Station Market Size, Share, Trends & Forecast (2026-2034)
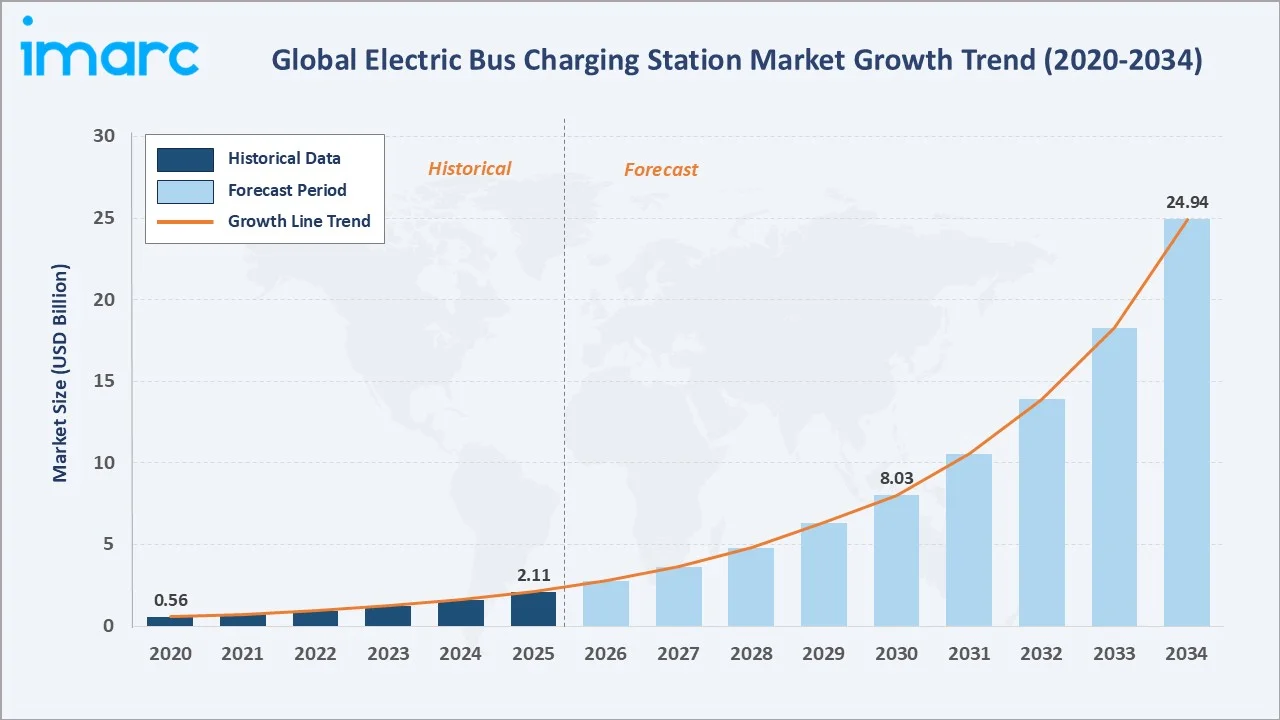
The global electric bus charging station market reached USD 2.11 Billion in 2025 and is projected to reach USD 24.94 Billion by 2034, exhibiting a CAGR of 30.60% during the forecast period 2026-2034. The market is driven by rapid electric bus fleet expansion across major transit networks, government mandates for zero-emission public transport, and declining battery and power electronics costs. Asia Pacific commands the largest share at 48.5% (2025), backed by China's extensive electrification programs and India's PM-eBus Sewa initiative. Depot Charging dominates among charging types at 54.2%, while Onboard chargers lead the charger segment at 57.3%.
|
Metric |
Value |
|
Market Size (2025) |
USD 2.11 Billion |
|
Forecast Market Size (2034) |
USD 24.94 Billion |
|
CAGR (2026-2034) |
30.60% |
|
Base Year |
2025 |
|
Historical Period |
2020-2025 |
|
Forecast Period |
2026-2034 |
|
Dominant Type |
Depot Charging (54.2%, 2025) |
|
Dominant Charger |
Onboard (57.3%, 2025) |
|
Leading Region |
Asia Pacific (48.5%, 2025) |
The global electric bus charging station market expanded from USD 0.56 Billion in 2020 to USD 2.11 Billion in 2025, anchored at USD 8.03 Billion in 2030, and projected to reach USD 24.94 Billion by 2034. Accelerated deployment of electric bus fleets by urban transit authorities, combined with falling infrastructure costs and improving grid connectivity, sustains above-trend market growth through 2025-2034.
To get more information on this market, Request Sample
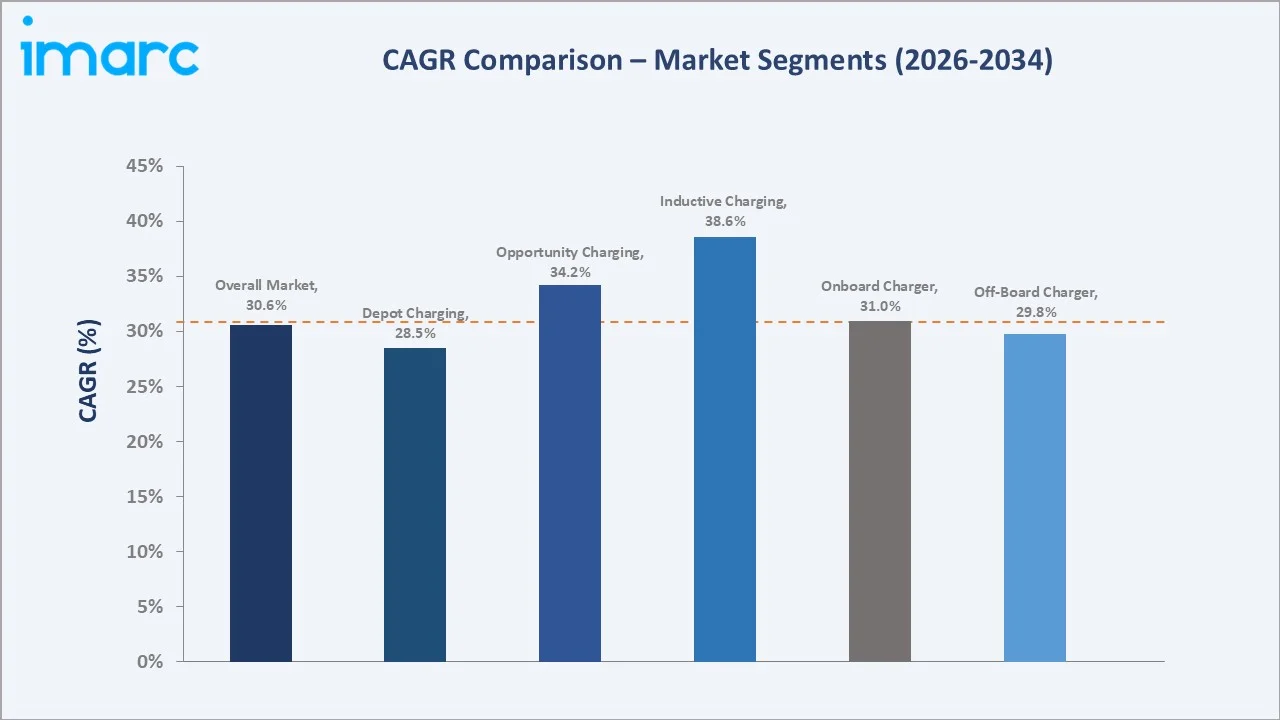
Inductive (wireless) charging grows fastest among types at an estimated 38.6% CAGR through 2034, as pilot-to-commercial-scale transitions accelerate in Europe and Asia Pacific. Opportunity charging solutions grow at approximately 34.2% CAGR, driven by high-power pantograph systems that enable en-route top-up without disrupting bus schedules.
Executive Summary
The global electric bus charging station market reached USD 2.11 Billion in 2025, representing a critical infrastructure layer enabling the electrification of public transit worldwide. The market encompasses depot charging systems, opportunity (en-route) charging stations, and emerging inductive charging solutions, spanning onboard and off-board charger configurations across power ratings from sub-50 kW to over 450 kW.
Depot Charging at 54.2% dominates through its role as the primary overnight replenishment solution for electric bus fleets. Onboard chargers lead at 57.3% due to their integration with the bus powertrain and compatibility with pantograph-based fast-charging systems. Asia Pacific, commanding 48.5% share, leverages China's world-leading installed base of over 680,000 electric buses (IEA, 2025) and India's government-backed procurement under PM E-DRIVE, which has supported 14,028 electric buses with over INR 4,391 crore in funding.
Key Market Insights
|
Insight |
Data |
|
Dominant Type |
Depot Charging - 54.2% share (2025) |
|
Dominant Charger |
Onboard - 57.3% market share (2025) |
|
Leading Region |
Asia Pacific - 48.5% market share (2025) |
|
Fastest Growing Segment |
Inductive Charging - ~38.6% CAGR (2026-2034) |
|
Top Companies |
ABB Ltd., Siemens AG, Electreon Wireless Ltd., ChargePoint Inc. |
|
Market Opportunity |
High-power (>450 kW) depot charging; V2G integration; inductive wireless charging; AI-managed fleet charge scheduling |
Key Analytical Observations Supporting the Above Data:
- Depot Charging at 54.2%: Depot charging dominates because electric bus operators require overnight bulk replenishment aligned with fleet rest periods. Depot systems accommodate multiple buses simultaneously and integrate with grid demand management, reducing energy costs.
- Onboard Charger at 57.3%: Onboard chargers are preferred for seamless pantograph-based opportunity charging without manual cable handling. They improve operational efficiency and reduce downtime, particularly in cities using en-route top-up strategies.
- Asia Pacific at 48.5%: The region leads due to China's dominant electric bus fleet – representing 30% of the global bus fleet being electric (IEA, 2025), alongside India's PM-eBus Sewa initiative and South Korea's national EV infrastructure program.
- Inductive Charging Growth: Wireless inductive charging eliminates physical connector dependency, enabling automated en-route charging at bus stops. European pilot projects in Sweden, Germany, and Italy are transitioning to commercial-scale deployments.
- High-Power Charging Demand: Transit agencies operating high-frequency routes increasingly require chargers above 150 kW to minimize dwell times. The >450 kW segment is among the fastest growing power categories in 2025.
Global Electric Bus Charging Station Market Overview
The global electric bus charging station market encompasses all infrastructure, hardware, software, and services enabling the electrical replenishment of battery-electric buses. The market spans depot charging systems (conductive plug-in and pantograph), opportunity charging stations (en-route overhead pantographs and plug-in terminals), and inductive wireless charging pads.
Applications range from urban transit (city bus lines, BRT corridors) to intercity coach electrification and airport shuttle services. Macroeconomic drivers include urban air quality legislation, net-zero transport commitments, and rising diesel operating costs. Government procurement programs in China, India, EU member states, and the United States provide demand visibility across a multi-year investment horizon.
Market Dynamics
To evaluate market opportunities, Request Sample
Market Drivers
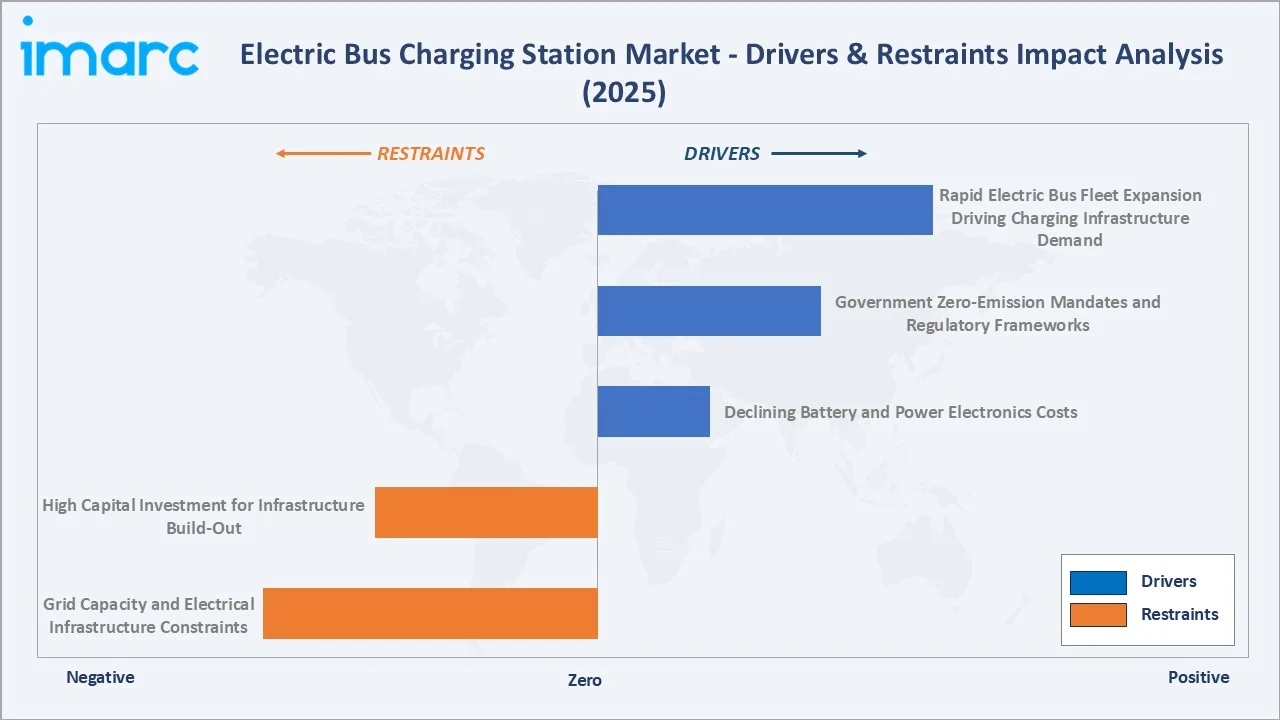
- Rapid Electric Bus Fleet Expansion Driving Charging Infrastructure Demand: Electric bus fleet deployment is the primary demand driver for charging station investment. China operates over 680,000 electric buses, the world's largest fleet, accounting for 30% of its entire bus stock (IEA, 2025). India's PM E-DRIVE scheme has sanctioned over 14,028 electric buses with INR 4,391 crore in government funding. The EU's HDV CO2 standards target 45% CO2 reduction by 2030 and 65% by 2035, mandating accelerated fleet electrification across all member states. Each additional electric bus requires dedicated charging infrastructure, creating a multiplier effect on charging station demand.
- Government Zero-Emission Mandates and Regulatory Frameworks: Binding policy frameworks are de-risking infrastructure investment. London has committed to a 100% zero-emission bus fleet by 2034. California's Innovative Clean Transit rule prohibits new diesel bus purchases after 2029. The EU's European Green Deal targets all new urban buses to be zero-emission by 2035, further accelerates electric bus penetration. These mandates create multi-year procurement pipelines requiring parallel charging infrastructure build-out.
- Declining Battery and Power Electronics Costs: The total cost of ownership for electric buses is falling relative to diesel alternatives. Battery pack cost reductions have improved the economics of high-power charger deployment. Silicon carbide (SiC) power semiconductor adoption is enabling smaller, more efficient charger designs at lower price points. As charger capital costs decline, transit authorities and fleet operators can justify larger charging infrastructure deployments.
- Smart Grid Integration and V2G Technology: Vehicle-to-grid (V2G) capability transforms electric bus fleets from energy consumers into grid assets. Charging stations with bidirectional capability allow transit authorities to participate in grid services, generating ancillary revenue that offsets charging infrastructure operating costs. Smart charging management systems from companies such as ABB E-mobility enable demand response and peak-shaving, reducing grid connection costs.
Market Restraints
- High Capital Investment for Infrastructure Build-Out: Installing a full electric bus depot with high-power charging capability requires substantial upfront expenditure on civil works, electrical panel upgrades, transformers, and charging equipment. Grid reinforcement costs are particularly high in regions with congested distribution networks. These upfront costs create barriers for smaller transit agencies and developing market operators.
- Grid Capacity and Electrical Infrastructure Constraints: Large bus depots simultaneously charging multiple high-power vehicles can impose significant peak demand loads on local grid infrastructure. Utility grid reinforcement timelines of 12-36 months can delay infrastructure commissioning. In regions with unreliable electricity supply, backup power solutions add cost and complexity.
- Interoperability and Standardization Challenges: The market lacks universal charging standards across all bus manufacturers and charging system providers. Depot operators managing mixed bus fleets may require multiple charger types, increasing procurement and maintenance complexity. The transition to harmonized protocols is ongoing.
Market Opportunities
- High-Power Charging (>150 kW) and Megawatt Charging Systems: Transit networks operating high-frequency BRT and express routes require ultra-fast opportunity charging. ABB E-mobility's pantograph systems deliver up to 600 kW for opportunity charging at line terminals. Megawatt Charging System (MCS) standards under development will further accelerate charge rates, enabling full-route electrification without range constraints.
- Emerging Markets: India, Southeast Asia, Latin America: Emerging economies present substantial greenfield infrastructure opportunity. India aims to replace 800,000 diesel buses with electric alternatives by 2030. Chile already operates over 4,000 electric buses (the largest fleet in Latin America as of early 2026). Infrastructure investment in these markets is accelerating, supported by multilateral development bank financing.
Market Challenges
- Charging Infrastructure Planning and Fleet Scheduling Complexity: Optimizing charging schedules for large mixed-route bus fleets requires sophisticated fleet management software. Misaligned charging windows can result in buses departing with insufficient charge, impacting service reliability. Transition from depot diesel refueling to depot charging requires operational restructuring.
- Supply Chain Constraints for Power Electronics Components: High-power charger production depends on silicon carbide semiconductors, large-format capacitors, and specialized transformers. Supply chain bottlenecks during periods of rapid demand growth can extend lead times for charging equipment and delay project commissioning.
Emerging Market Trends
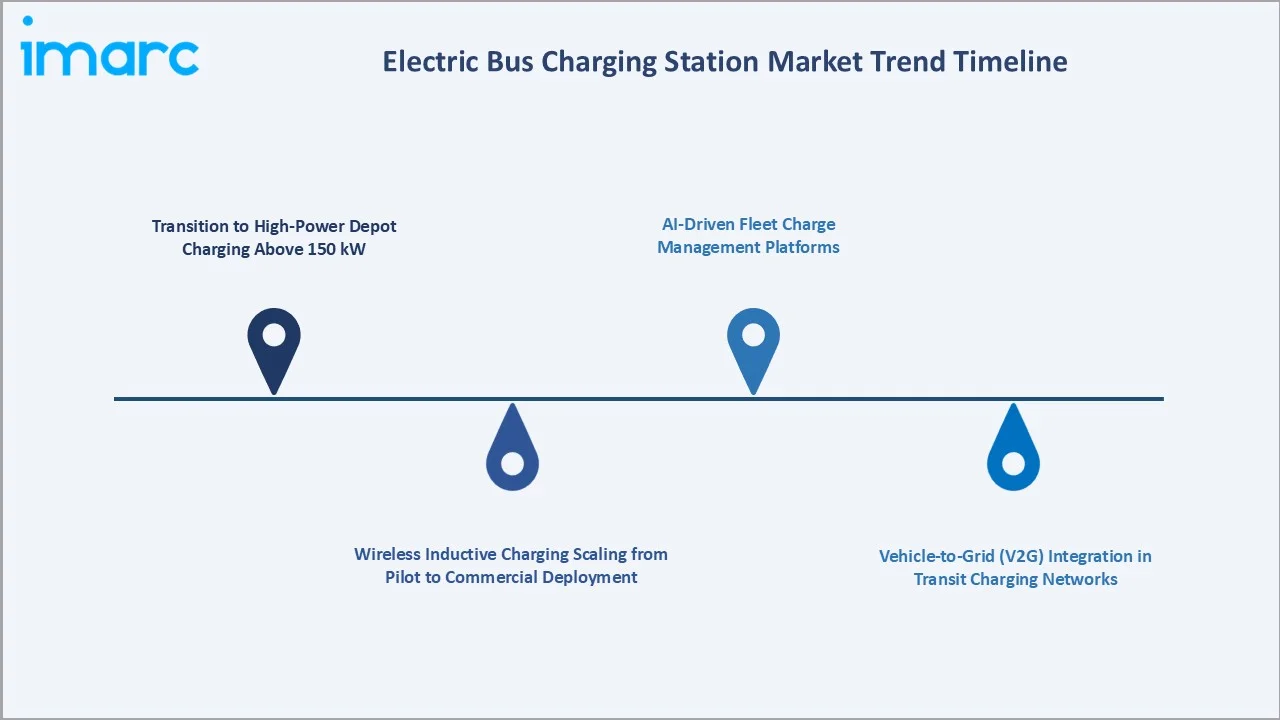
1. Transition to High-Power Depot Charging Above 150 kW
Transit operators are migrating from standard overnight depot chargers (50–150 kW) to high-power systems exceeding 150 kW. High-power charging reduces overnight charging windows, enabling flexible fleet deployment. Several European cities have deployed 450 kW depot systems to support rapid turnaround schedules for double-decker and articulated electric buses.
2. Wireless Inductive Charging Scaling from Pilot to Commercial Deployment
Inductive wireless charging eliminates connector infrastructure at bus stops and improves passenger boarding safety. Electreon Wireless, a key player in the market, has pioneered in-road wireless charging technology with commercial pilots in Israel, Sweden, and Germany. As technology matures and standardization advances, wireless charging is expected to capture a growing share of opportunity charging installations.
3. AI-Driven Fleet Charge Management Platforms
AI-based charging management platforms are emerging as a distinct software layer above hardware charging systems. These platforms optimize charge scheduling based on route timetables, energy prices, and grid signals. Real-time state-of-charge monitoring and predictive maintenance alerts reduce unplanned service disruptions and energy costs.
4. Vehicle-to-Grid (V2G) Integration in Transit Charging Networks
Electric bus fleets connected to V2G-capable charging infrastructure can feed stored energy back to the grid during peak demand periods. Several pilot programs in the Netherlands and United Kingdom have demonstrated V2G revenue streams for transit operators. ABB E-mobility and grid utility PG&E surpassed 800 charging ports at 35 locations by late 2025.
5. Solar-Integrated Charging Depots Reducing Grid Energy Dependency
Transit authorities are co-locating rooftop solar and battery storage at bus depots to reduce grid electricity consumption and charging costs. Solar-charged depot infrastructure is particularly attractive in high-irradiance regions including the Middle East, India, and Southern Europe. These installations reduce both operating costs and carbon intensity of bus operations.
Industry Value Chain Analysis
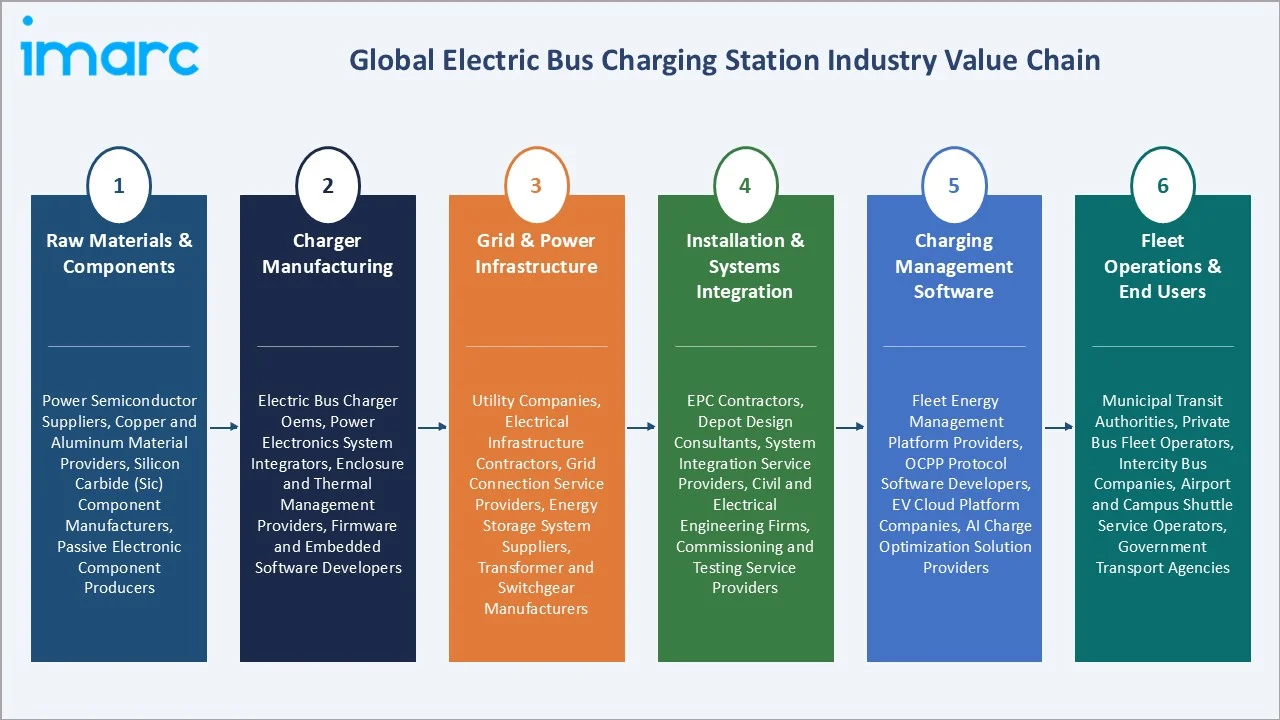
The electric bus charging station value chain integrates raw material and component supply, charger manufacturing, grid and power infrastructure, installation and systems integration, and fleet operations by end users. Each stage adds technical capability and commercial value.
|
Stage |
Key Participants |
|
Raw Materials & Components |
Power semiconductor suppliers, copper and aluminum material providers, silicon carbide (SiC) component manufacturers, passive electronic component producers |
|
Charger Manufacturing |
Electric bus charger OEMs, power electronics system integrators, enclosure and thermal management providers, firmware and embedded software developers |
|
Grid & Power Infrastructure |
Utility companies, electrical infrastructure contractors, grid connection service providers, energy storage system suppliers, transformer and switchgear manufacturers |
|
Installation & Systems Integration |
EPC contractors, depot design consultants, system integration service providers, civil and electrical engineering firms, commissioning and testing service providers |
|
Charging Management Software |
Fleet energy management platform providers, OCPP protocol software developers, EV cloud platform companies, AI charge optimization solution providers |
|
Fleet Operations & End Users |
Municipal transit authorities, private bus fleet operators, intercity bus companies, airport and campus shuttle service operators, government transport agencies |
The charger manufacturing stage represents the highest value-add segment due to complex power electronics design, safety certification requirements, and ongoing software development. The installation and integration stage is experiencing growing demand as project complexity increases with high-power depot builds requiring significant civil and electrical engineering expertise.
Technology Landscape in the Electric Bus Charging Station Industry
Conductive DC Fast Charging Technology
Conductive DC fast charging remains the dominant technology in electric bus charging, covering both plug-in and pantograph connection methods. Plug-in systems using CCS (Combined Charging System) or proprietary connectors are widely deployed for overnight depot charging. ABB's HVC 150C and pantograph-based Panto Down systems deliver between 50 kW and 600 kW, serving diverse fleet sizes and duty cycles.
Overhead Pantograph Opportunity Charging
Overhead pantograph systems enable automated en-route charging at terminal stops within typical 3-6 minute layover windows. The OppCharge open interface standard facilitates interoperability between bus manufacturers and charging system providers. Power levels of 300-600 kW at terminal stops allow partial top-up to sustain full-day operations without returning to depot.
Inductive Wireless Charging Technology
Inductive charging transfers energy between a ground-embedded coil and a receiver mounted on the bus undercarriage. Electreon Wireless has pioneered dynamic in-road charging (charging while driving) alongside static stop-based systems. Wireless charging eliminates connector wear, reduces vandalism risk, and improves accessibility at bus stops.
Smart Charging and Energy Management Systems
Smart charging software platforms manage multi-charger depot operations, aligning charging schedules with utility tariff structures, renewable energy availability, and fleet departure requirements. Cloud-based platforms provide remote monitoring, diagnostics, and predictive maintenance alerts, reducing total cost of ownership for large transit charging installations.
Market Segmentation Analysis
The report covers the following segments:
|
Segment Category |
Leading Segment |
Market Share |
Year |
|
Type |
Depot Charging |
54.2% |
2025 |
|
Charger |
Onboard |
57.3% |
2025 |
|
Power |
🔒 |
🔒 |
2025 |
|
Region |
Asia Pacific |
48.5% |
2025 |

By Type
Depot Charging leads at 54.2% (2025). The depot charging segment encompasses all plug-in and pantograph overnight and daytime charging solutions at bus garages and depots. Depot charging is the primary charging strategy for the majority of electric bus fleets globally, offering the lowest infrastructure cost per bus and the highest flexibility for charge scheduling.
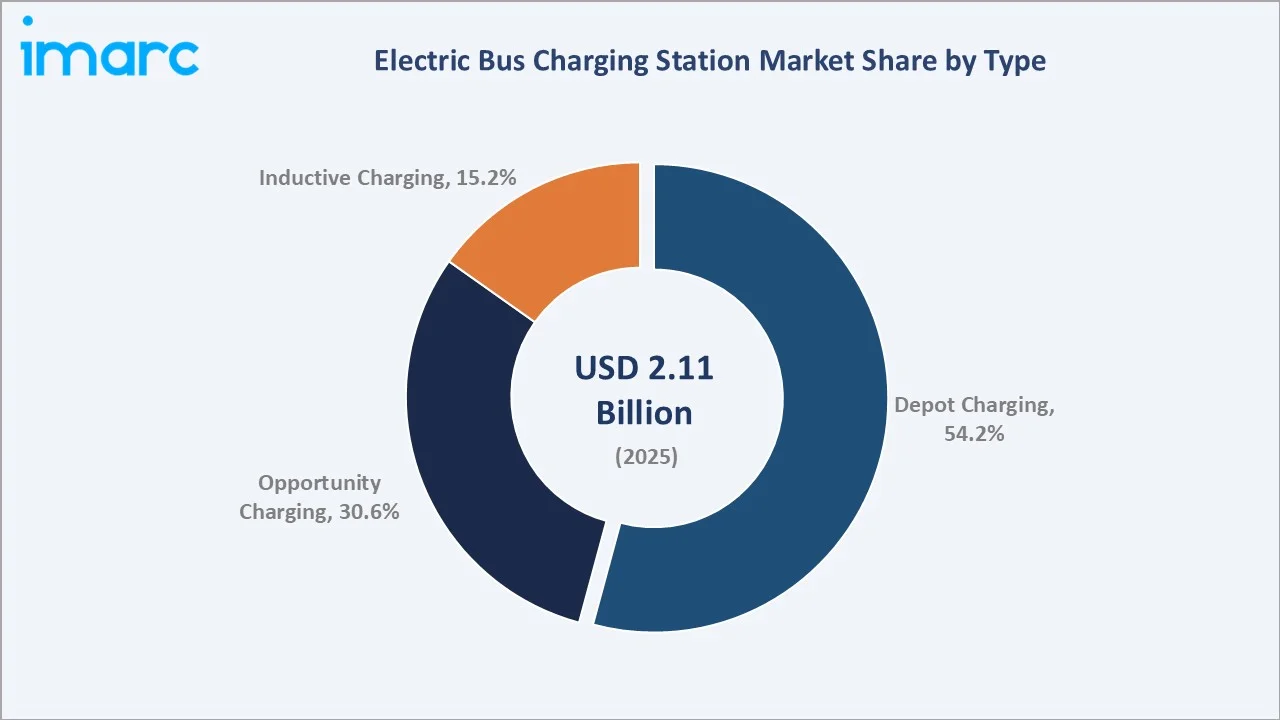
To access detailed market analysis, Request Sample
Opportunity Charging at 30.6% encompasses en-route pantograph and plug-in charging systems installed at bus line terminals and stops. This segment grows at an estimated 34.2% CAGR as high-frequency urban bus routes adopt power levels of 300–600 kW to enable zero-emission operations without increasing fleet size. Inductive Charging at 15.2% is the fastest growing type segment, driven by technology maturation and commercial deployments in Europe and Asia Pacific.
By Charger
Onboard chargers lead at 57.3% (2025). Onboard chargers are integrated within the bus electrical architecture, receiving power directly from external infrastructure through pantograph or plug-in connections. Their integration with the bus battery management system enables precise charge control and compatibility with multiple charging infrastructure types.
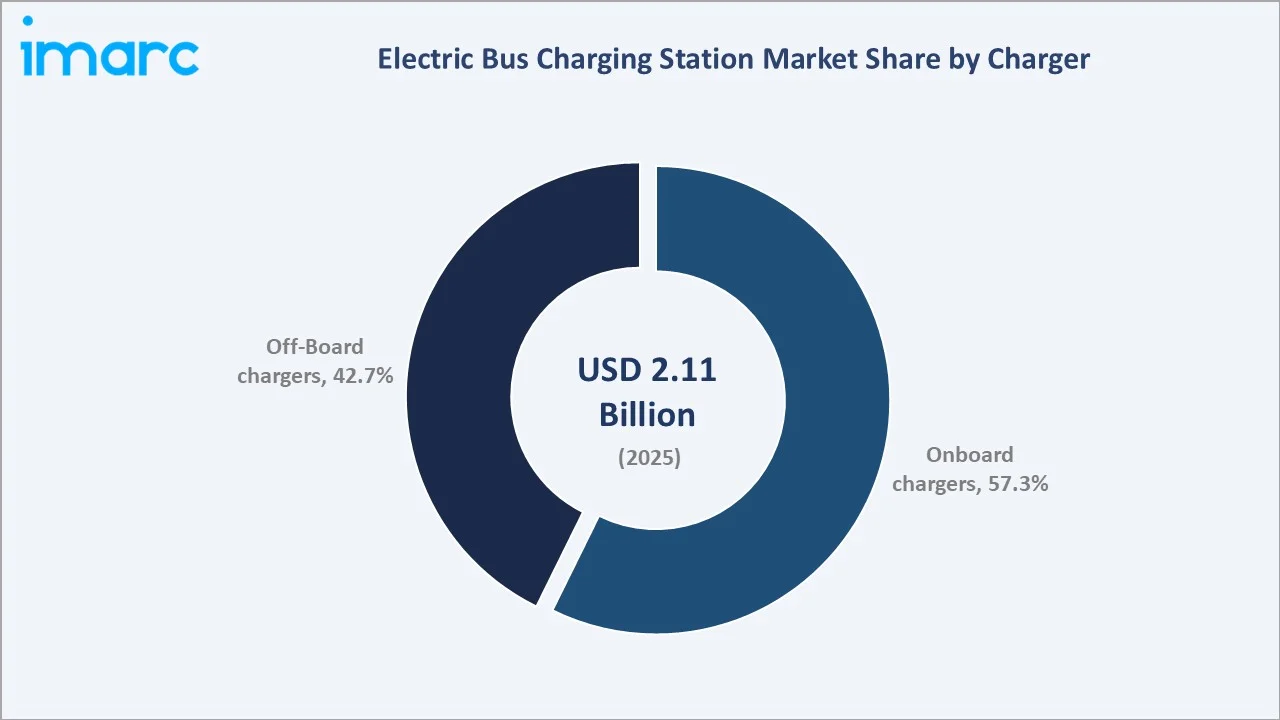
Off-Board chargers at 42.7% are standalone units delivering DC power directly to the bus battery, bypassing the onboard charger. Off-board systems are capable of higher power outputs, making them the preferred solution for high-power depot installations above 150 kW. Their external positioning simplifies bus design and enables upgrading charger capacity independently of bus procurement cycles.
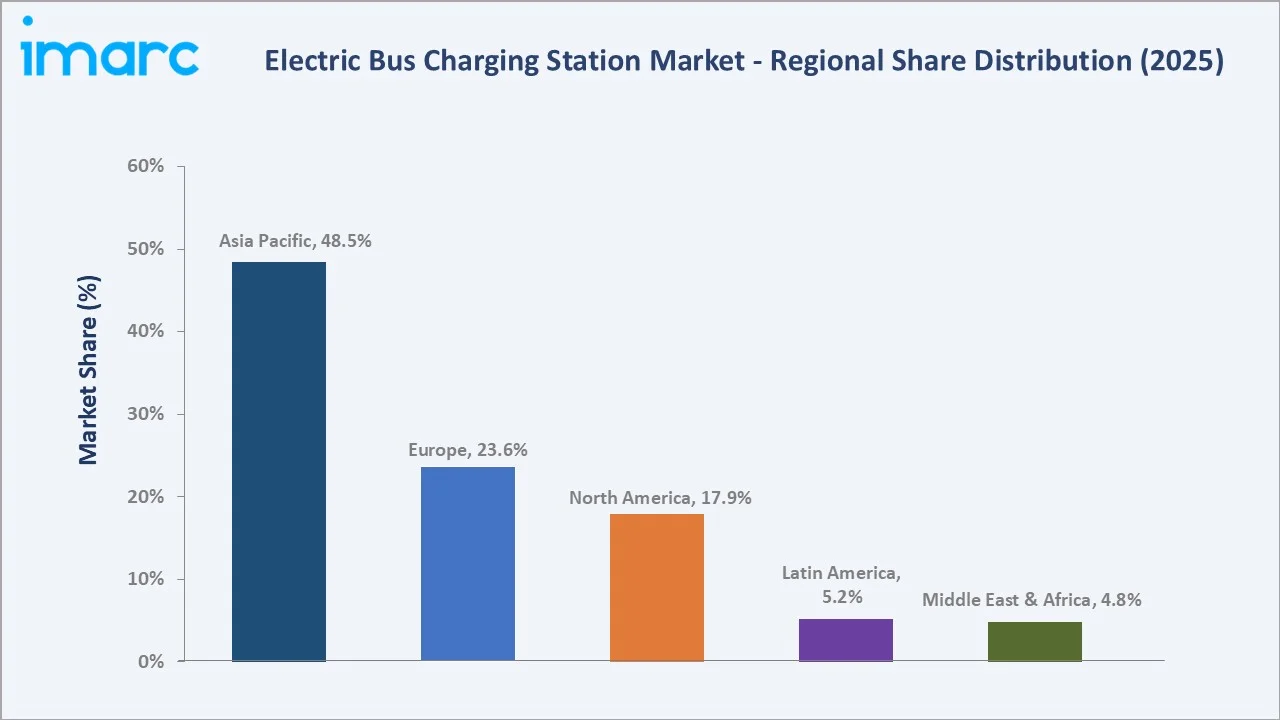
Regional Market Insights
|
Region |
Share (2025) |
Key Market Drivers & Characteristics |
|
Asia Pacific |
48.5% |
Led by large-scale government electric bus procurement programs and a mature domestic charging equipment manufacturing base. Strong urban transit electrification policies across major economies support sustained infrastructure investment. |
|
Europe |
23.6% |
Driven by stringent EU zero-emission vehicle regulations, national clean transport funding programs, and well-developed public transit networks across urban centers. Advanced grid infrastructure enables high-power depot charging adoption. |
|
North America |
17.9% |
Supported by federal funding programs for transit electrification, state-level zero-emission bus mandates, and growing municipal transit agency procurement. Grid modernization initiatives are expanding depot charging capacity. |
|
Latin America |
5.2% |
Emerging market driven by urban air quality concerns and growing electric bus deployments in major metropolitan areas. Multilateral development bank financing is supporting infrastructure build-out across several countries. |
|
Middle East & Africa |
4.8% |
Growing interest in electric public transport driven by national sustainability strategies, smart city initiatives, and international sporting event infrastructure investments. Government-led electrification programs are creating early-stage market demand. |
Asia Pacific's 48.5% market leadership reflects China's position as the world's dominant electric bus nation, with 30% of its total bus stock being electric (IEA, 2025). India's PM E-DRIVE initiative is creating a new large-scale charging infrastructure demand wave. Europe's 23.6% share is supported by the Netherlands' fully electrified new bus procurement target and Germany's significant fleet replacement programs.
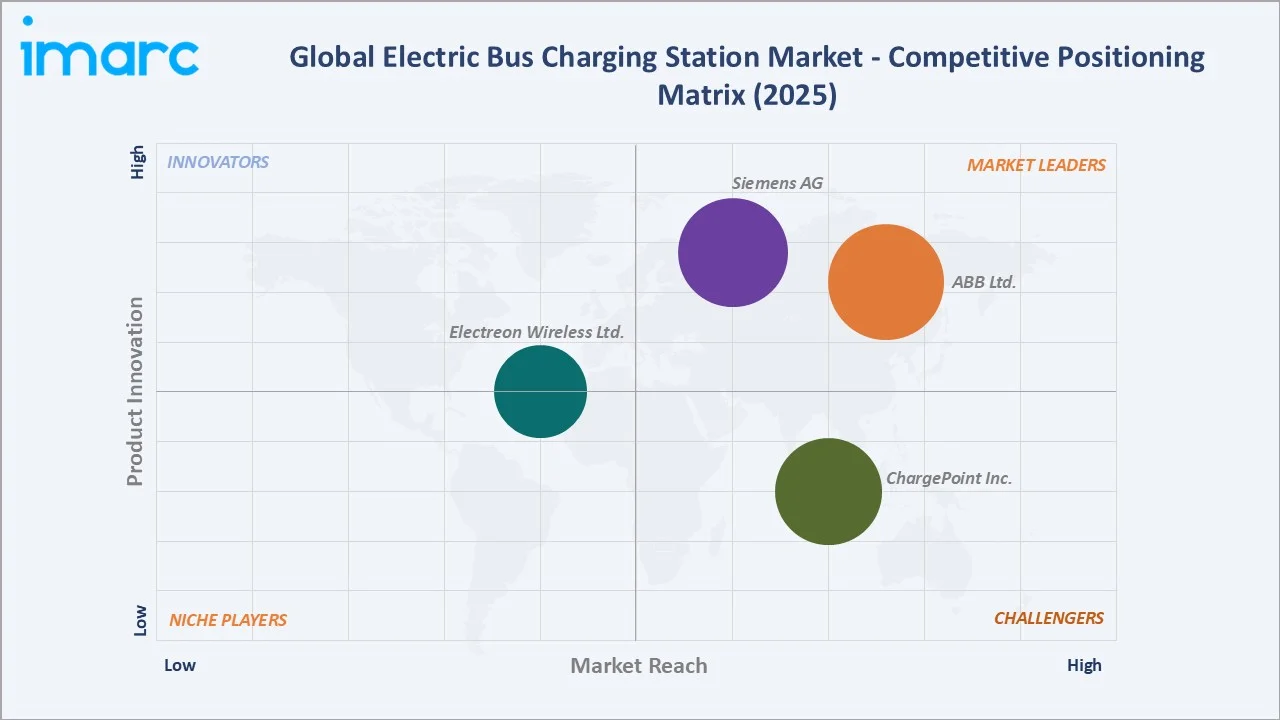
Competitive Landscape
The global electric bus charging station market features a moderately concentrated competitive landscape at the technology and product tier, dominated by global industrial electrification leaders and specialized eBus charging companies.
|
Company Name |
Key Products / Brands |
Market Position |
Core Strength |
|
ABB Ltd. |
HVC Series, OM Series, Terra Series |
Market Leader |
Widest portfolio covering depot and opportunity charging; global deployment scale |
|
Siemens AG |
Siemens eMobility, Heliox |
Market Leader |
Strong grid integration capability and smart charging software platforms |
|
Electreon Wireless Ltd. |
Wireless Road (Dynamic Charging) |
Emerging Player |
Pioneer in dynamic wireless charging technology with commercial pilot deployments |
|
ChargePoint Inc. |
DC Fast Chargers for eBus |
Strong Challenger |
Fleet management software and network services |
Key Company Profiles
ABB Ltd.
ABB Ltd. is a global leader in electrification and automation, operating across more than 100 countries. The company's E-mobility division is a leading provider of electric vehicle and electric bus charging solutions, having sold over 68,000 high-power chargers and electrifying more than 10,000 sites globally. ABB has been active in the eBus charging market since 2016 and has deployed charging solutions for major transit fleets including St. Louis Metropolitan area (USA), Bodø (Norway), Hamburg (Germany), and others.
- Key Products: HVC Series, OM Series, and Terra Series, among others.
- Recent Developments: In May 2026, ABB E-mobility launched the OM X-Series, a distributed charging system designed to provide a single coordinated site architecture for the largest and highest-power charging sites.
- Strategic Focus: Integrated smart charging solutions combining hardware, software, and grid connectivity; expanding V2G-capable infrastructure for transit fleets.
Siemens AG
Siemens AG is a global technology company with a strong presence in electrification, automation, and digitalization. Through its eMobility division and the strategic acquisition of Heliox, Siemens has significantly expanded its electric bus charging portfolio.
- Key Products: Siemens eMobility, Heliox
- Recent Developments: In October 2025, Siemens introduced the SICHARGE FLEX product family, its next-generation electric vehicle (EV) distributed charging system. It delivers up to 1,500 A of charging current through its MCS dispenser, enabling rapid charging for heavy-duty trucks as well as electric city and overland buses.
- Strategic Focus: End-to-end electrification solutions for transit operators, combining charging hardware with grid management software and smart energy systems.
Market Concentration Analysis
The global electric bus charging station market exhibits moderate concentration at the product and technology tier. ABB and Siemens collectively hold a leading position in the high-power and pantograph charging segments, with combined market presence in over 50 countries.
The market is characterized by a two-tier structure: global industrial companies (ABB, Siemens) compete on breadth of portfolio, software integration, and global service networks; while specialized eBus charging companies compete on technical depth and transit operator relationships. Consolidation is increasing through acquisitions-Siemens acquired Heliox to bridge this gap.
Asia Pacific hosts a distinct competitive landscape with domestic Chinese manufacturers holding significant share within China's domestic market, while international players dominate in Europe, North America, and emerging markets.
Investment & Growth Opportunities
Highest Growth Segments
Inductive wireless charging (~38.6% CAGR), opportunity charging (~34.2% CAGR), and high-power depot charging above 450 kW represent the highest-growth investment vectors through 2034. AI-driven fleet charge management software is growing from a small base at an estimated 20%+ CAGR. V2G-capable charging infrastructure is emerging as a commercially attractive revenue-sharing opportunity for transit operators.
Emerging Investment Opportunities
India's PM-eBus Sewa expansion represents one of the largest near-term greenfield charging infrastructure opportunities globally. With a target of replacing 800,000 diesel buses by 2030, India requires a parallel build-out of depot and en-route charging capacity. Latin America, led by Chile, Brazil, and Colombia, is deploying electric buses at an accelerating pace, creating charging infrastructure demand supported by Inter-American Development Bank financing.
Investment Themes
- High-Power Depot Charging Platform Development: Investing in modular 300-600 kW depot charging platforms that scale with fleet size reduces per-bus capital cost and supports transit authority phased electrification roadmaps.
- AI Fleet Energy Management Software: Cloud-based platforms optimizing charge scheduling across hundreds of buses represent a high-margin, recurring revenue opportunity with minimal incremental capital requirement.
- Inductive Charging Infrastructure for Urban BRT Networks: Partnering with urban transit authorities on dynamic and static wireless charging deployments for BRT corridors positions vendors in a rapidly growing technology segment with limited competition.
- Emerging Market Depot Infrastructure Projects: Government-backed electric bus programs in India, Southeast Asia, and Latin America require turnkey depot electrification, creating project development opportunities for integrated charger suppliers.
Future Market Outlook (2026-2034)
The global electric bus charging station market is projected to grow from USD 2.11 Billion in 2025 to USD 24.94 Billion by 2034, delivering a 30.60% CAGR over the forecast period. The market's anchor value of USD 8.03 Billion in 2030 represents a sector in the midst of accelerating commercial mainstream deployment, transitioning from early-adopter city programs to national fleet electrification programs.
Three structural forces define market growth with exceptional confidence through 2034. Government policy mandates spanning the EU, US, China, India, and the UK create demand visibility across multi-year procurement cycles. Technology cost reductions in both charging hardware and battery systems are expanding economic viability into smaller fleet operators and emerging markets. Fleet replacement cycles are aligning with electrification timelines as diesel bus fleets procured in 2010-2015 reach end-of-life across major transit systems.
By 2034, AI-managed charging will be mainstream in major transit networks, V2G commercial deployments will generate meaningful grid ancillary revenues for transit operators, and inductive wireless charging will have scaled from pilots to standard infrastructure at major urban terminals. High-power systems exceeding 450 kW will represent a standard offering rather than a premium product category.
Research Methodology
Primary Research
Primary research comprised structured interviews with 50+ industry stakeholders (2025) including heads of eMobility at charging equipment manufacturers, transit authority fleet electrification officers, urban infrastructure planning directors, utility grid integration specialists, and regional market analysts.
Secondary Research
Secondary research encompassed IEA Global EV Outlook 2025, European Commission transport electrification policy documents, national transit authority annual reports, company investor presentations (ABB, Siemens), industry association publications, patent databases, and government procurement announcements. Over 60 secondary sources were reviewed.
Forecasting Models
Market revenue forecasts were developed using a bottom-up segment model: (i) depot charging infrastructure component by region and power tier; (ii) opportunity charging component by type and region; (iii) inductive charging emerging segment. Cross-validated against top-down market size estimates derived from fleet electrification trajectories and average charger-per-bus infrastructure ratios.
Electric Bus Charging Station Market Report Scope:
| Report Features | Details |
|---|---|
| Base Year of the Analysis | 2025 |
| Historical Period | 2020-2025 |
| Forecast Period | 2026-2034 |
| Units | Billion USD |
| Scope of the Report | Exploration of Historical Trends and Market Outlook, Industry Catalysts and Challenges, Segment-Wise Historical and Future Market Assessment:
|
| Types Covered | Depot Charging, Opportunity Charging, Inductive Charging |
| Chargers Covered | Off-Board, Onboard |
| Powers Covered | Less than 50 Kw, 50–150 kW, 151–450 kW, More than 450 kW |
| Regions Covered | Asia Pacific, Europe, North America, Latin America, Middle East and Africa |
| Countries Covered | United States, Canada, Germany, France, United Kingdom, Italy, Spain, China, Japan, India, South Korea, Australia, Indonesia, Brazil, Mexico |
| Companies Covered | ABB Ltd., Siemens AG, Electreon Wireless Ltd., ChargePoint Inc., etc |
| Customization Scope | 10% Free Customization |
| Post-Sale Analyst Support | 10-12 Weeks |
| Delivery Format | PDF and Excel through Email (We can also provide the editable version of the report in PPT/Word format on special request) |
Key Benefits for Stakeholders:
- IMARC’s report offers a comprehensive quantitative analysis of various market segments, historical and current market trends, market forecasts, and dynamics of the global electric bus charging station market from 2020-2034.
- The research study provides the latest information on the market drivers, challenges, and opportunities in the global electric bus charging station market.
- The study maps the leading, as well as the fastest-growing, regional markets. It further enables stakeholders to identify the key country-level markets within each region.
- Porter's five forces analysis assist stakeholders in assessing the impact of new entrants, competitive rivalry, supplier power, buyer power, and the threat of substitution. It helps stakeholders to analyze the level of competition within the electric bus charging station industry and its attractiveness.
- Competitive landscape allows stakeholders to understand their competitive environment and provides an insight into the current positions of key players in the market.
Frequently Asked Questions About the Electric Bus Charging Station Market Report
The global electric bus charging station market reached USD 2.11 Billion in 2025. Growth is driven by rapid electric bus fleet expansion, zero-emission transit mandates, and falling charging infrastructure costs.
The market grows at a 30.60% CAGR during 2026-2034, reaching USD 24.94 Billion by 2034. This reflects accelerating global electric bus fleet deployment and infrastructure investment.
Depot Charging leads at 54.2% (2025). It dominates through its role as the primary overnight bulk charging solution aligned with bus fleet rest schedules.
Onboard chargers lead at 57.3% (2025) due to their integration with bus powertrain systems and compatibility with pantograph-based automated charging.
Asia Pacific leads at 48.5% (2025), driven by China's world-largest electric bus fleet and India's government-backed bus electrification programs.
The market is projected to reach USD 8.03 Billion by 2030, representing continued above-trend growth as fleet electrification programs in major economies reach commercial scale.
Leading companies include ABB Ltd., Siemens AG, Electreon Wireless Ltd., and ChargePoint Inc., among others.
The global electric bus charging station market was valued at USD 0.56 Billion in 2020, growing at an above-trend pace through 2025 driven by accelerated fleet electrification post-COVID.
Inductive charging uses electromagnetic coils to transfer energy wirelessly between ground infrastructure and the bus. It is the fastest-growing segment at an estimated 38.6% CAGR through 2034.
Key policies include the EU's HDV CO2 standards targeting 45% CO2 reduction by 2030, India's PM E-DRIVE scheme, California's Innovative Clean Transit rule, and London's 2034 zero-emission fleet commitment.
Key challenges include high initial infrastructure capital costs, grid capacity constraints for large fleet depots, and interoperability issues across charging system standards and bus manufacturers.
Asia Pacific maintains leadership while Middle East and Africa and Latin America are among the fastest growing regions by CAGR, supported by new government electric bus programs and sustainability mandates.
Need more help?
- Speak to our experienced analysts for insights on the current market scenarios.
- Include additional segments and countries to customize the report as per your requirement.
- Gain an unparalleled competitive advantage in your domain by understanding how to utilize the report and positively impacting your operations and revenue.
- For further assistance, please connect with our analysts.
 Request Customization
 Speak to an Analyst
 Request Brochure
 Inquire Before Buying
Benefits of Customization
- Personalize this research
- Triangulate with your data
- Get data as per your format and definition
- Gain a deeper dive into a specific application, geography, customer, or competitor
- Any level of personalization
Get in Touch With Us
UNITED STATES
Phone: +1-201-971-6302
INDIA
Phone: +91-120-433-0800
UNITED KINGDOM
Phone: +44-753-714-6104
Email: [email protected]
Client Testimonials


.webp)


