
Energy ESO Market Report by Service (R&D and Designing, Structuring and Layout, Digitization, Implementation and Maintenance), Location (Onshore, Offshore), Energy Source (Renewable, Non-Renewable, Chemical Processing), and Region 2026-2034
Energy ESO Market Size, Share Analysis & Trends Outlook:
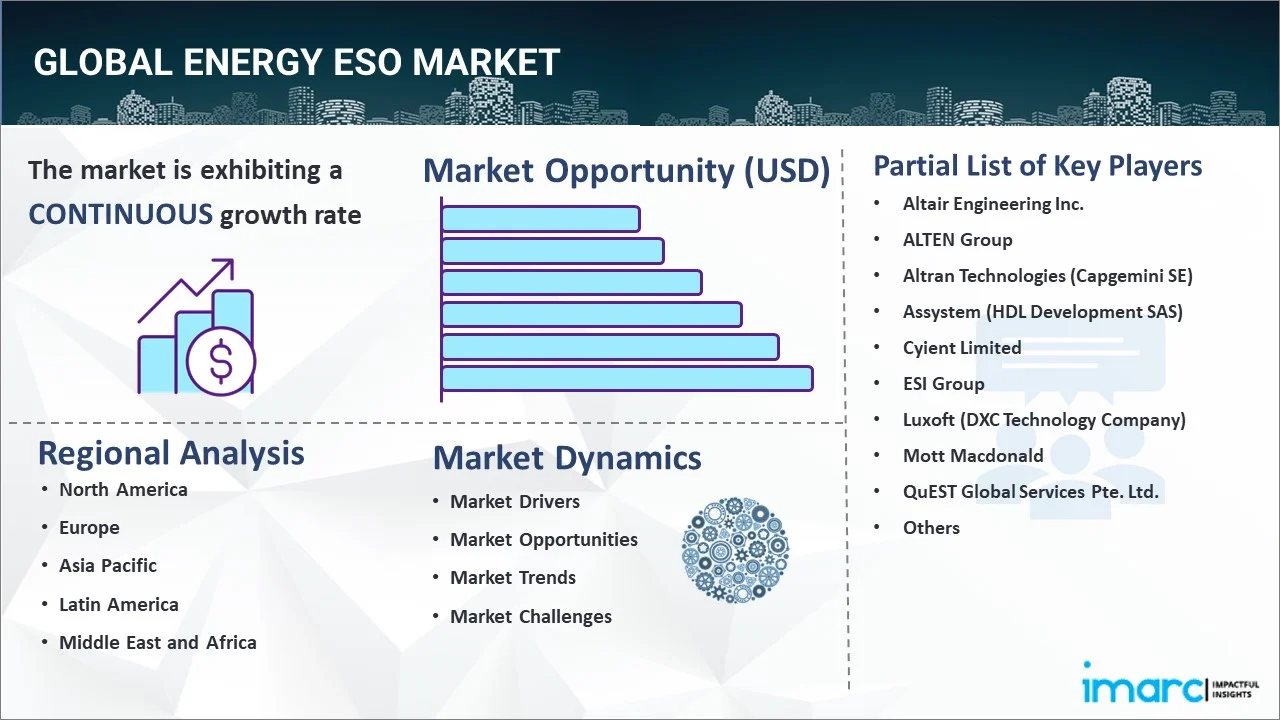
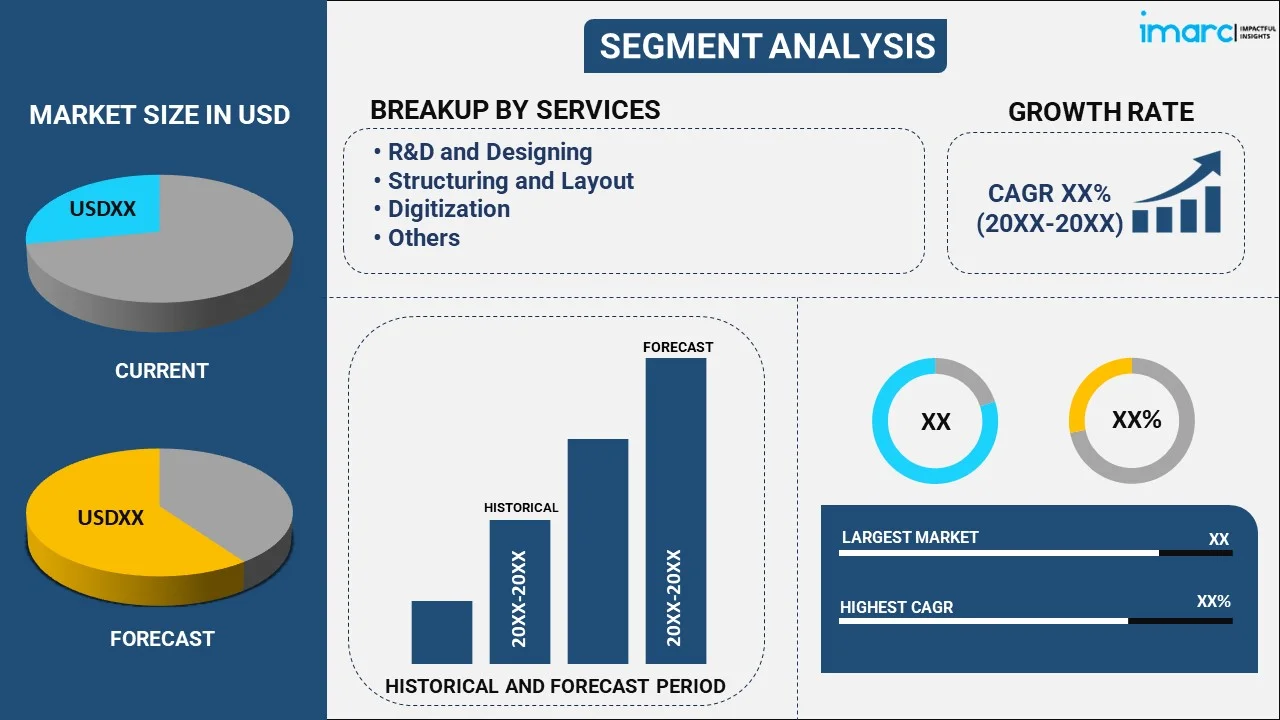
The global energy ESO market size reached USD 513.2 Billion in 2025. Looking forward, IMARC Group expects the market to reach USD 2,152.8 Billion by 2034, exhibiting a growth rate (CAGR) of 16.75% during 2026-2034. The rising regulatory policies promoting sustainability, significant technological advancements in energy storage, fluctuating energy prices, the increased demand for renewable energy, growing grid modernization, and the rising need for energy security and reliability are some of the major factors propelling the growth of the market.
|
Report Attribute
|
Key Statistics
|
|---|---|
|
Base Year
|
2025
|
|
Forecast Years
|
2026-2034
|
|
Historical Years
|
2020-2025
|
|
Market Size in 2025
|
USD 513.2 Billion |
|
Market Forecast in 2034
|
USD 2,152.8 Billion |
| Market Growth Rate 2026-2034 | 16.75% |
Energy ESO Market Analysis:
- Major Market Drivers: The strict regulatory policies and initiatives aimed at enhancing sustainability and reducing carbon emissions represent the major drivers of the market growth. Governments worldwide are setting ambitious targets for renewable energy adoption, which boosts the demand for energy storage solutions.
- Key Market Trends: The increasing integration of advanced technologies such as artificial intelligence (AI) and machine learning (ML) for optimized energy management represents the key trends of the market. The growing emphasis on decentralized energy systems such as microgrids which enhance local energy resilience and efficiency is another significant trend in the market.
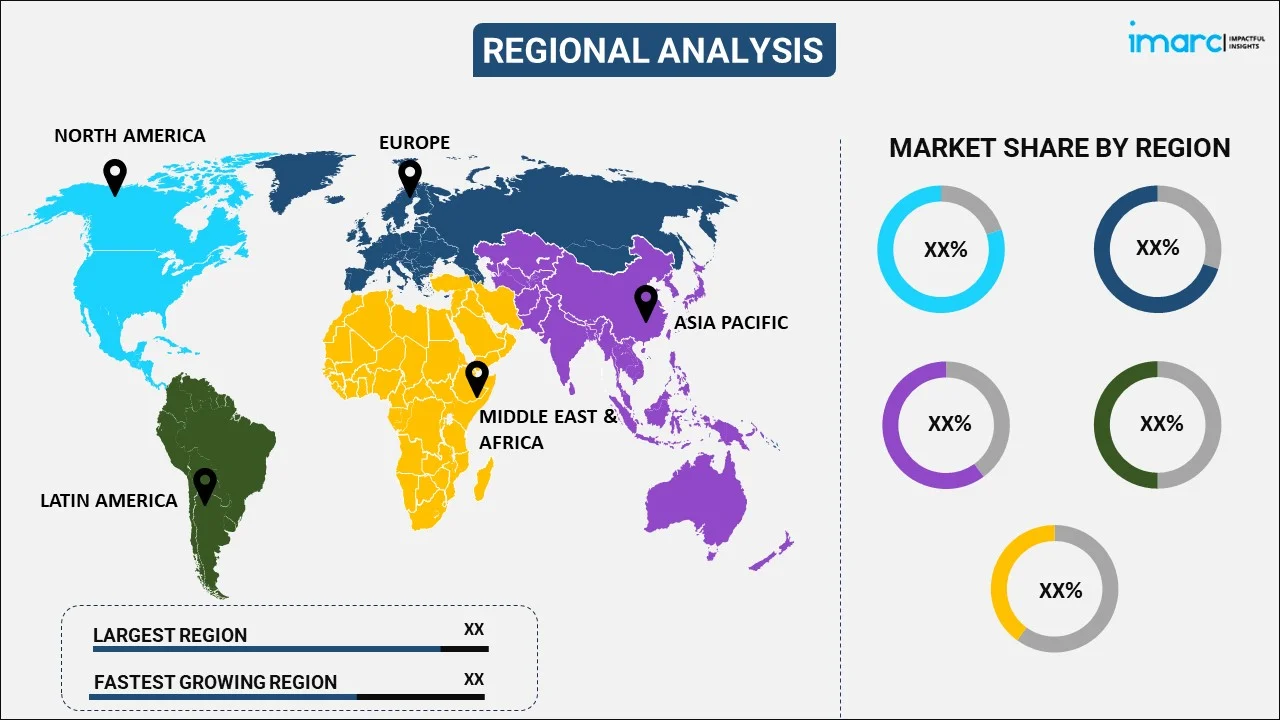
- Geographical Trends: Asia Pacific represents the largest region in the market across the globe. According to the energy ESO market forecast, rapid industrialization, urbanization, and the increasing energy demand will continue to be the key factors driving the market growth in the coming years. The government policies promoting clean energy and technological advancements in storage solutions further support the market growth.
- Competitive Landscape: Some of the major market players in the energy ESO industry include Altair Engineering Inc., ALTEN Group, Altran Technologies (Capgemini SE), Assystem (HDL Development SAS), Cyient Limited, ESI Group, Luxoft (DXC Technology Company), Mott Macdonald, QuEST Global Services Pte. Ltd., Rilco Engineering Services, Semcon and Total OutSource Inc. (UCA Group Inc), among many others. The key players strategize their business initiatives in line with the fluctuating energy ESO market price trends.
- Challenges and Opportunities: The market faces several challenges including high initial costs, limited lifespan of storage technologies, and regulatory uncertainties. However, the market also faces various opportunities such as advances in battery technology that promise reduced costs and improved performance.
To get more information on this market Request Sample
Energy ESO Market Trends:
Growing Regulatory and Policy Support
Government policies and incentives promoting renewable energy adoption and reducing carbon emissions are crucial in driving the market toward growth. For instance, in India, the Union Minister for New & Renewable Energy and Power informed that the Government has set a target of achieving 500 GW of installed capacity from non-fossil fuels by 2030, in line with the Prime Minister’s announcement at COP-26. Efforts have been made by the Government to increase awareness about the use of renewable energy through the introduction of various schemes and publicity through print and media. The list of schemes introduced includes the Scheme for the Development of Solar Parks and Ultra-mega Solar Power Projects, the National Programme on High-Efficiency Solar PV Modules, the PM-KUSUM Scheme, and Green Energy Corridors (GEC). According to the energy ESO market insights, these regulations often include subsidies for energy storage systems and mandates for renewable energy integration, which is driving the market growth.
Significant Technological Advancements
Innovations in energy storage technologies, such as improvements in battery efficiency, cost reduction, and enhanced performance, are acting as key drivers for the market growth. For instance, in September 2024, GE Vernova Inc. unveiled its latest innovation in Battery Enabled Energy Storage (BESS) technology with the launch of the RESTORE DC Block. This advanced containerized solution is designed to enhance safety, efficiency, and long-term performance for utility-scale renewable and energy storage projects. Advancements in related fields like artificial intelligence and smart grids further boost market development, thus creating a positive impact on the energy ESO market outlook.
Increasing Energy Demand and Reliability Needs
The rising global energy consumption and the need for grid reliability and energy security drive the demand for energy storage solutions. As energy systems evolve, there is a greater need for solutions that ensure a stable, reliable energy supply. According to World Energy & Climate Statistics 2024 published by Enerdata, the global energy consumption grew faster than its historical trend (+2.2% in 2023), spurred by the BRICS (+5.1%), which accounted for 42% of the global energy consumption in 2023: energy consumption surged in China (+6.6%, twice its 2010-2019 average), India (+5.1%, slightly faster than the historical average), accelerated in Brazil (+3.3%, vs. +0.9% per year over 2010-2019), but it stagnated in Russia (+0.3%) and declined again in South Africa oversupply issues (-1.2%).
Energy ESO Market Segmentation:
IMARC Group provides an analysis of the key trends in each segment of the market, along with forecasts at the global, regional, and country levels for 2026-2034. Our report has categorized the market based on service, location, and energy source.
Breakup by Service:
To get detailed segment analysis of this market Request Sample
- R&D and Designing
- Structuring and Layout
- Digitization
- Implementation and Maintenance
Structuring and layout accounts for the majority of the market share
The report has provided a detailed breakup and analysis of the market based on the service. This includes R&D and designing, structuring and layout, digitization, and implementation and maintenance. According to the report, structuring and layout represented the largest segment.
The increasing complexity of energy systems and the need for optimized energy management are driving the demand for structuring and layout in the market. Advances in technology require innovative storage solutions and layouts to integrate seamlessly with renewable energy sources. Additionally, regulatory requirements for grid reliability and efficiency push for more sophisticated structuring. The growing demand for decentralized energy systems and microgrids also necessitates advanced layout strategies to enhance system performance and adaptability.
Breakup by Location:
- Onshore
- Offshore
Onshore holds the largest share of the industry
A detailed breakup and analysis of the market based on the location have also been provided in the report. This includes onshore and offshore. According to the report, onshore accounted for the largest market share.
The onshore segment dominates the market primarily due to its cost-effectiveness and established infrastructure. Onshore facilities benefit from lower capital and operational expenses compared to offshore projects. Additionally, onshore installations often face fewer logistical and regulatory challenges, making them more feasible and attractive for large-scale deployment. The accessibility of onshore sites facilitates easier maintenance and integration with existing energy grids, further reinforcing their dominance in the market.
Breakup by Energy Source:
- Renewable
- Non-Renewable
- Chemical Processing
Non-renewable represents the leading market segment
The report has provided a detailed breakup and analysis of the market based on the energy source. This includes renewable, non-renewable, and chemical processing. According to the report, non-renewable represented the largest segment.
The non-renewable segment represents the leading energy source segment in the market primarily due to its established infrastructure and high energy density. Non-renewable energy sources, like coal and natural gas, provide consistent and reliable power output, which is crucial for meeting base load demands. Their widespread use and existing investments in power generation and storage facilities contribute to their market dominance, thus driving the energy ESO market demand. Additionally, the current limitations in energy storage technologies for renewables often make non-renewable sources more favorable for large-scale, stable energy supply.
Breakup by Region:
To get more information on the regional analysis of this market Request Sample
- North America
- United States
- Canada
- Asia-Pacific
- China
- Japan
- India
- South Korea
- Australia
- Indonesia
- Others
- Europe
- Germany
- France
- United Kingdom
- Italy
- Spain
- Russia
- Others
- Latin America
- Brazil
- Mexico
- Others
- Middle East and Africa
Asia Pacific leads the market, accounting for the largest energy ESO market share
The report has also provided a comprehensive analysis of all the major regional markets, which include North America (the United States and Canada); Europe (Germany, France, the United Kingdom, Italy, Spain, Russia, and others); Asia Pacific (China, Japan, India, South Korea, Australia, Indonesia, and others); Latin America (Brazil, Mexico, and others); and the Middle East and Africa. According to the report, Asia Pacific represents the largest regional market for energy ESO.
Rapid economic growth and urbanization lead to increased energy consumption, necessitating advanced storage solutions for stability and efficiency, which is further driving the market growth. Government policies and incentives promoting renewable energy and reducing carbon emissions play a crucial role, as they push for greater integration of energy storage systems. According to IBEF, India's battery energy storage capacity surged more than four-fold to 219 MWh by March 2024, marking a significant increase from 47.6 MWh in March 2023, according to a report by Mercom Capital Group. This growth is underpinned by policy measures such as the deviation settlement mechanism, grid connectivity regulations, and ancillary services regulations to enhance renewable integration and grid stability. The Viability Gap Funding (VGF) program, with a budget of USD 450.5 Million (Rs. 37.6 Billion), aims to install 4 GWh of battery energy storage systems (BESS), while energy storage obligations (ESO) and bidding guidelines for energy storage projects, both standalone and coupled with renewable energy, are contributing to a robust pipeline of projects.
Top Energy ESO Companies:
The report has also provided a comprehensive analysis of the competitive landscape in the global energy ESO market. Competitive analysis such as market structure, market share by key players, player positioning, top winning strategies, competitive dashboard, and company evaluation quadrant has been covered in the report. Also, detailed profiles of all major companies have been provided. Some of the companies covered include:
- Altair Engineering Inc.
- ALTEN Group
- Altran Technologies (Capgemini SE)
- Assystem (HDL Development SAS)
- Cyient Limited
- ESI Group
- Luxoft (DXC Technology Company)
- Mott Macdonald
- QuEST Global Services Pte. Ltd.
- Rilco Engineering Services
- Semcon
- Total OutSource Inc. (UCA Group Inc)
Kindly note that this only represents a partial list of companies, and the complete list has been provided in the report.
The market for energy ESO is highly competitive, featuring key players like Tesla, LG Chem, and Panasonic, who lead in advanced battery technologies and large-scale storage solutions. Emerging companies and startups also drive innovation, focusing on cost-effective and scalable storage options. Competition is intensified by rapid technological advancements and varying regional regulatory landscapes. Strategic partnerships, mergers, and acquisitions are common as firms seek to enhance capabilities, expand market reach, and adapt to evolving energy demands and standards. For instance, in June 2024, The National Grid of the UK, ESO, signed a memorandum agreement with the UK government to build digital twins for the energy sector. The MOU comes as the UK government focuses on developing and deploying digital twins as part of its digital twin program, spearheaded by the Department for Business and Trade.
Energy ESO Market News and Developments:
- In December 2023, the National Grid Electricity System Operator (ESO) successfully launched their new Open Balancing Platform (OBP) and Bulk Dispatch Optimiser (BDO) and started using it to trade BESS in the Balancing Mechanism (BM) on 12 December 2023.
- In July 2024, U.S. Trade and Development Agency Director Enoh T. Ebong signed a grant agreement with Bulgaria’s state-owned electricity transmission company, Elektroenergien Sistemen OperatorEAD (ESO), to advance new transmission infrastructure that will both ease the integration of new renewable energy sources and increase ESO’s capacity to export electricity to Bulgaria’s neighbors.
Energy ESO Market Report Scope:
| Report Features | Details |
|---|---|
| Base Year of the Analysis | 2025 |
| Historical Period | 2020-2025 |
| Forecast Period | 2026-2034 |
| Units | Billion USD |
| Scope of the Report | Exploration of Historical Trends and Market Outlook, Industry Catalysts and Challenges, Segment-Wise Historical and Future Market Assessment:
|
| Services Covered | R&D and Designing, Structuring and Layout, Digitization, Implementation and Maintenance |
| Locations Covered | Onshore, Offshore |
| Energy Sources Covered | Renewable, Non-Renewable, Chemical Processing |
| Regions Covered | Asia Pacific, Europe, North America, Latin America, Middle East and Africa |
| Countries Covered | United States, Canada, Germany, France, United Kingdom, Italy, Spain, Russia, China, Japan, India, South Korea, Australia, Indonesia, Brazil, Mexico |
| Companies Covered | Altair Engineering Inc., ALTEN Group, Altran Technologies (Capgemini SE), Assystem (HDL Development SAS), Cyient Limited, ESI Group, Luxoft (DXC Technology Company), Mott Macdonald, QuEST Global Services Pte. Ltd., Rilco Engineering Services, Semcon, Total OutSource Inc. (UCA Group Inc), etc. |
| Customization Scope | 10% Free Customization |
| Post-Sale Analyst Support | 10-12 Weeks |
| Delivery Format | PDF and Excel through Email (We can also provide the editable version of the report in PPT/Word format on special request) |
Key Questions Answered in This Report:
- How has the global energy ESO market performed so far, and how will it perform in the coming years?
- What are the drivers, restraints, and opportunities in the global energy ESO market?
- What is the impact of each driver, restraint, and opportunity on the global energy ESO market?
- What are the key regional markets?
- Which countries represent the most attractive energy ESO market?
- What is the breakup of the market based on the service?
- Which is the most attractive service in the energy ESO market?
- What is the breakup of the market based on the location?
- Which is the most attractive location in the energy ESO market?
- What is the breakup of the market based on the energy source?
- Which is the most attractive energy source in the energy ESO market?
- What is the competitive structure of the market?
- Who are the key players/companies in the global energy ESO market?
Key Benefits for Stakeholders:
- IMARC’s industry report offers a comprehensive quantitative analysis of various market segments, historical and current market trends, market forecasts, and dynamics of the energy ESO market from 2020-2034.
- The research report provides the latest information on the market drivers, challenges, and opportunities in the global energy ESO market.
- The study maps the leading, as well as the fastest-growing, regional markets. It further enables stakeholders to identify the key country-level markets within each region.
- Porter's five forces analysis assists stakeholders in assessing the impact of new entrants, competitive rivalry, supplier power, buyer power, and the threat of substitution. It helps stakeholders to analyze the level of competition within the energy ESO industry and its attractiveness.
- The competitive landscape allows stakeholders to understand their competitive environment and provides insight into the current positions of key players in the market.
Need more help?
- Speak to our experienced analysts for insights on the current market scenarios.
- Include additional segments and countries to customize the report as per your requirement.
- Gain an unparalleled competitive advantage in your domain by understanding how to utilize the report and positively impacting your operations and revenue.
- For further assistance, please connect with our analysts.
 Request Customization
 Speak to an Analyst
 Request Brochure
 Inquire Before Buying
Benefits of Customization
- Personalize this research
- Triangulate with your data
- Get data as per your format and definition
- Gain a deeper dive into a specific application, geography, customer, or competitor
- Any level of personalization
Get in Touch With Us
UNITED STATES
Phone: +1-201-971-6302
INDIA
Phone: +91-120-433-0800
UNITED KINGDOM
Phone: +44-753-714-6104
Email: [email protected]
Client Testimonials


.webp)


