
Energy Gums Market Report by Flavor (Mint, Fruit Flavor, and Others), Application (Fitness Training and Exercising, Sports, Study, Business, and Others), Distribution Channel (Online, Offline), and Region 2026-2034
Market Overview:
The global energy gums market size reached USD 115.7 Million in 2025. Looking forward, IMARC Group expects the market to reach USD 205.4 Million by 2034, exhibiting a growth rate (CAGR) of 6.39% during 2026-2034. The rising consumer demand for health and fitness supplements, easy availability through e-commerce platforms and the increased participation in sports and physical activities are driving the market growth.
|
Report Attribute
|
Key Statistics
|
|---|---|
|
Base Year
|
2025
|
|
Forecast Years
|
2026-2034
|
|
Historical Years
|
2020-2025
|
| Market Size in 2025 | USD 115.7 Million |
| Market Forecast in 2034 | USD 205.4 Million |
| Market Growth Rate (2026-2034) | 6.39% |
Energy gums are a soft, energy-rich, flavor-filled gum that function as an energy supplement. They are prepared by softening gum bases, which are later infused with other ingredients, such as flavoring agents, sweeteners, color additives, softeners, caffeine, vitamins, and ginseng. Energy gums help improve attention, concentration, reaction time and cognitive performance. They also work to enhance mental alertness and focus and relieve the impact of sleep deprivation and tiredness on the mind and body. Besides this, energy gums aid in increasing stamina, boosting metabolism and endurance, promoting blood flow and maximum burning of calories during physical activities, and preventing drowsiness. As a result, energy gums are widely used during sports, exercising and fitness training activities.
To get more information on this market Request Sample
Energy Gums Market Trends:
Rising Demand for Health and Fitness Supplements
The rising consumer interest in health and fitness supplements is contributing substantially to the growth of the energy gums market. With caffeine as a key ingredient, energy gums offer benefits such as immune support, anti-inflammatory effects, enhanced blood circulation, and stress relief. This makes them highly appealing to fitness enthusiasts and athletes who need a quick energy boost during physical activities. As participation in sports and exercise increases, the demand for convenient, on-the-go supplements such as energy gums is rising. This trend is helping to expand the energy gums market size as more individuals incorporate energy gum into their fitness routines for immediate and sustained energy.
Regulatory Measures and Focus on Natural Ingredients
The growing emphasis on regulating caffeine content in energy supplements is shaping the energy gum market by ensuring consumer safety and fostering trust in these products. Alongside, the shift toward using natural ingredients in energy gum formulations is attracting health-conscious consumers who prefer cleaner, plant-based options. Manufacturers are increasingly focusing on developing new products with natural sweeteners, organic ingredients, and minimal additives to meet evolving consumer demands. These innovations, paired with increased regulatory oversight, are propelling the market growth by appealing to a broader, more health-focused audience, further driving the growth of these products in various regions.
Product Innovations and Flavor Diversity
The energy gums market share has been steadily increasing on account of numerous innovations in this segment, particularly the introduction of mint and fruity flavors, are enhancing consumer appeal by offering refreshing taste profiles, cooling effects, and pleasant aromas. These new flavor options make energy gums more attractive to a broader audience, particularly those seeking enjoyable yet functional snacks. Additionally, the widespread availability of energy gums through e-commerce platforms and supermarkets ensures easy access for consumers, propelling market growth. As urbanization increases and lifestyles become more fast-paced, the demand for convenient, on-the-go energy solutions such as energy gums is rising, further facilitating market expansion and product adoption.
Key Market Segmentation:
IMARC Group provides an analysis of the key trends in each sub-segment of the global energy gums market report, along with forecasts at the global, regional and country level from 2026-2034. Our report has categorized the market based on flavor, application and distribution channel.
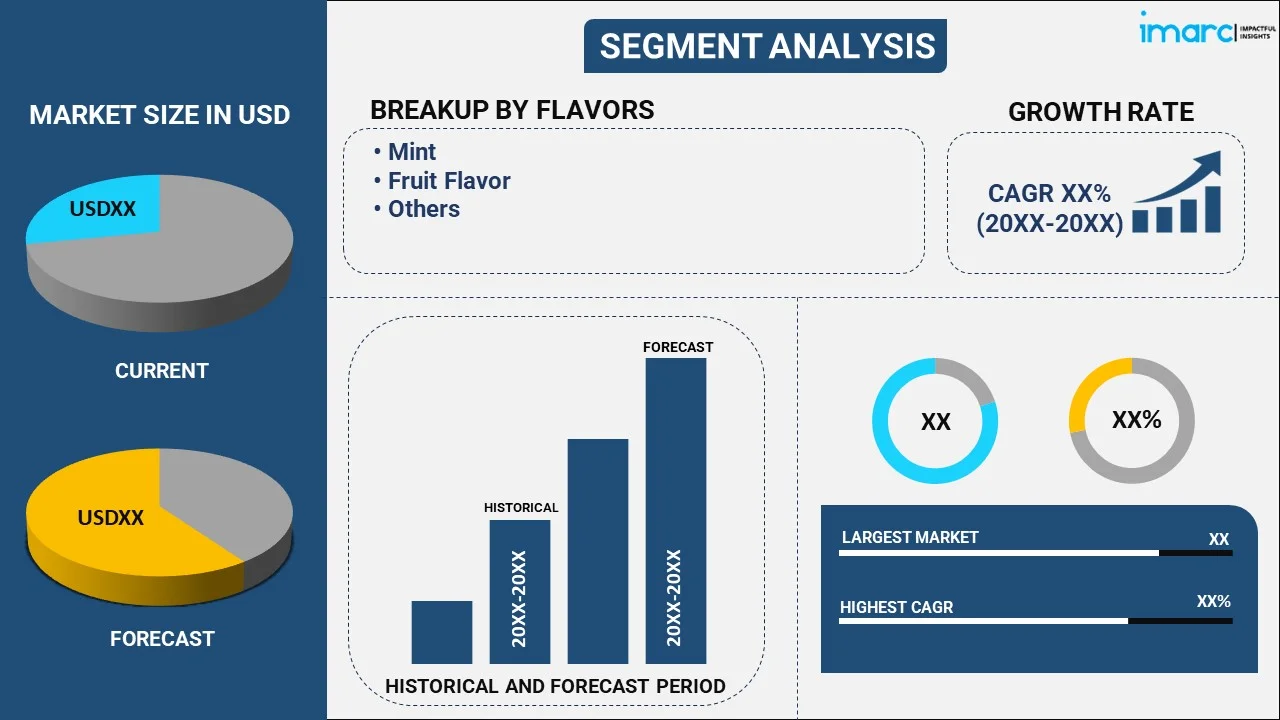
Breakup by Flavor:
To get detailed segment analysis of this market Request Sample
- Mint
- Fruit Flavor
- Others
Breakup by Application:
- Fitness Training and Exercising
- Sports
- Study
- Business
- Others
Breakup by Distribution Channel:
- Online
- Offline
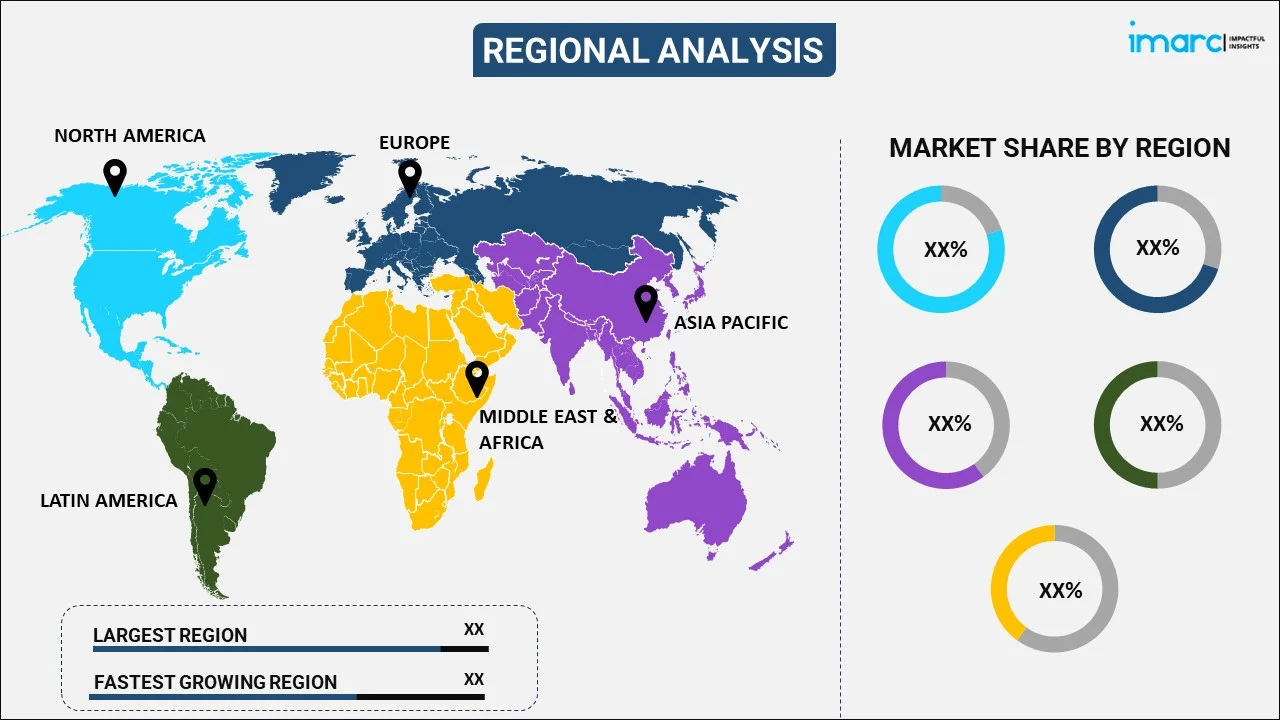
Breakup by Region:
To get more information on the regional analysis of this market Request Sample
- North America
- United States
- Canada
- Asia-Pacific
- China
- Japan
- India
- South Korea
- Australia
- Indonesia
- Others
- Europe
- Germany
- France
- United Kingdom
- Italy
- Spain
- Russia
- Others
- Latin America
- Brazil
- Mexico
- Others
- Middle East and Africa
Competitive Landscape:
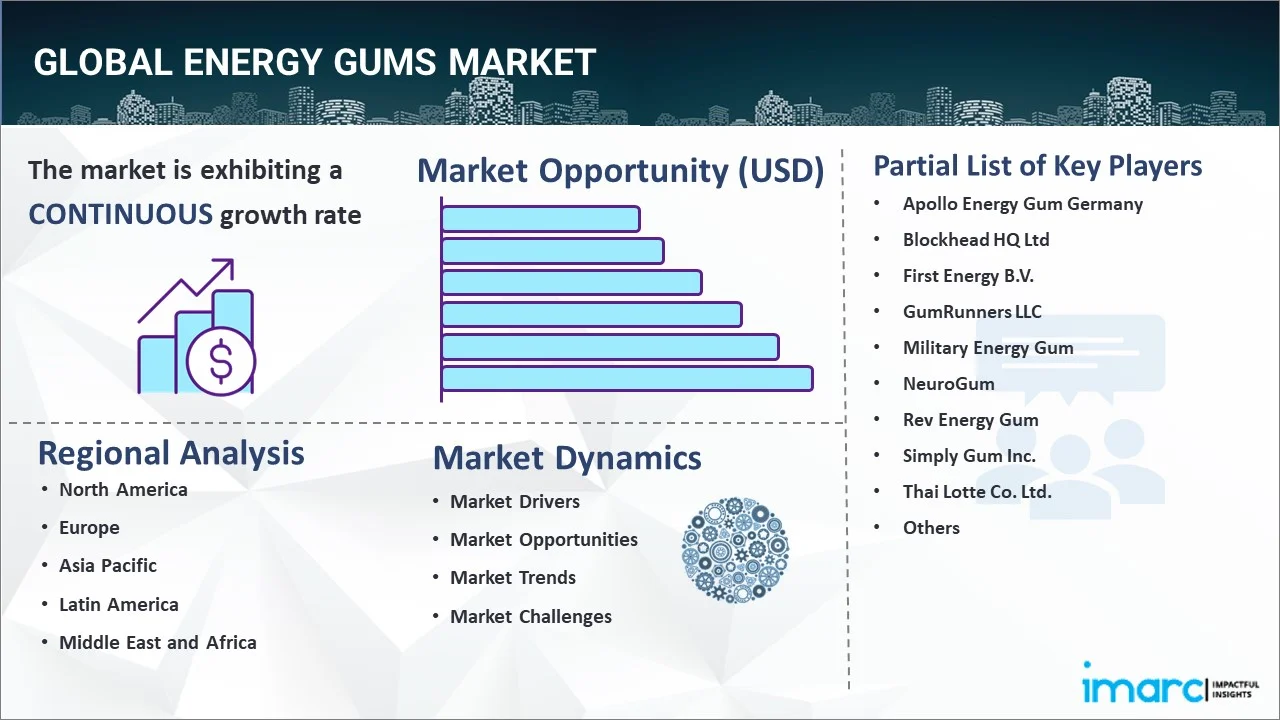
The report has also provided a comprehensive analysis of the competitive landscape in the global energy gums market. Detailed profiles of all major companies have also been provided. Some of the companies covered include:
- Apollo Energy Gum Germany
- Blockhead HQ Ltd
- First Energy B.V.
- GumRunners LLC
- Military Energy Gum
- NeuroGum
- Rev Energy Gum
- Simply Gum Inc.
- Thai Lotte Co. Ltd.
- WUG Functional Gums
Kindly note that this only represents a partial list of companies, and the complete list has been provided in the report.
Energy Gums Market News:
- 22 August 2024: Liquid Core Gum Company, a leading functional gums manufacturer, has introduced EDGE, a new energy gum option that is available in sustainable packaging. The packaging structure for EDGE uses eco-friendly cardboard tubes that resemble the design of energy drink cans.
- 2 October 2023: Rev Gum, a Texas-based sugar-free performance energy gums business, has secured D6 Million in funding from investors, including YETI Capital and cyclist Lance Armstrong. With these funds, Rev Gum aims to expand its presence in retail stores.
Report Coverage:
| Report Features | Details |
|---|---|
| Base Year of the Analysis | 2025 |
| Historical Period | 2020-2025 |
| Forecast Period | 2026-2034 |
| Units | Million USD |
| Segment Coverage | Flavor, Application, Distribution Channel, Region |
| Region Covered | Asia Pacific, Europe, North America, Latin America, Middle East and Africa |
| Countries Covered | United States, Canada, Germany, France, United Kingdom, Italy, Spain, Russia, China, Japan, India, South Korea, Australia, Indonesia, Brazil, Mexico |
| Companies Covered | Apollo Energy Gum Germany, Blockhead HQ Ltd, First Energy B.V., GumRunners LLC, Military Energy Gum., NeuroGum, Rev Energy Gum, Simply Gum Inc., Thai Lotte Co. Ltd. and WUG Functional Gums. |
| Customization Scope | 10% Free Customization |
| Post-Sale Analyst Support | 10-12 Weeks |
| Delivery Format | PDF and Excel through Email (We can also provide the editable version of the report in PPT/Word format on special request) |
Frequently Asked Questions About the Energy Gums Market Report
The global energy gums market was valued at USD 115.7 Million in 2025.
We expect the global energy gums market to exhibit a CAGR of 6.39% during 2026-2034.
The sudden outbreak of the COVID-19 pandemic has led to the changing consumer inclination from conventional brick-and-mortar distribution channels towards online retail platforms for the purchase of energy gums.
The rising consumer awareness towards numerous benefits of energy gum, such as increasing stamina, boosting metabolism and endurance, promoting blood flow and maximum burning of calories during physical activities, etc., is primarily driving the global energy gums market.
Based on the flavor, the global energy gums market can be categorized into mint, fruit flavor, and others. Currently, mint accounts for the majority of the total market share.
Based on the application, the global energy gums market has been segregated into fitness training and exercising, sports, study, business, and others. Among these, fitness training and exercising currently holds the largest market share.
Based on the distribution channel, the global energy gums market can be bifurcated into online and offline. Currently, offline exhibits a clear dominance in the market.
On a regional level, the market has been classified into North America, Asia-Pacific, Europe, Latin America, and Middle East and Africa, where North America currently dominates the global market.
Some of the major players in the global energy gums market include Apollo Energy Gum Germany, Blockhead HQ Ltd, First Energy B.V., GumRunners LLC, Military Energy Gum., NeuroGum, Rev Energy Gum, Simply Gum Inc., Thai Lotte Co. Ltd., and WUG Functional Gums.
Need more help?
- Speak to our experienced analysts for insights on the current market scenarios.
- Include additional segments and countries to customize the report as per your requirement.
- Gain an unparalleled competitive advantage in your domain by understanding how to utilize the report and positively impacting your operations and revenue.
- For further assistance, please connect with our analysts.
 Request Customization
 Speak to an Analyst
 Request Brochure
 Inquire Before Buying
Benefits of Customization
- Personalize this research
- Triangulate with your data
- Get data as per your format and definition
- Gain a deeper dive into a specific application, geography, customer, or competitor
- Any level of personalization
Get in Touch With Us
UNITED STATES
Phone: +1-201-971-6302
INDIA
Phone: +91-120-433-0800
UNITED KINGDOM
Phone: +44-753-714-6104
Email: [email protected]
Client Testimonials


.webp)


