
Ethylene Acrylic Elastomer Prices, Trend, Chart, Demand, Market Analysis, News, Historical and Forecast Data Report 2026 Edition
Ethylene Acrylic Elastomer Price Trend, Index and Forecast
Track the latest insights on ethylene acrylic elastomer price trend and forecast with detailed analysis of regional fluctuations and market dynamics across North America, Latin America, Central Europe, Western Europe, Eastern Europe, Middle East, North Africa, West Africa, Central and Southern Africa, Central Asia, Southeast Asia, South Asia, East Asia, and Oceania.
Ethylene Acrylic Elastomer Prices Outlook Q2 2026
- USA: USD 13,387/MT
- India: USD 12,072/MT
- Netherlands: USD 17,208/MT
- Thailand: USD 13,979/MT
- Spain: USD 13,931/MT
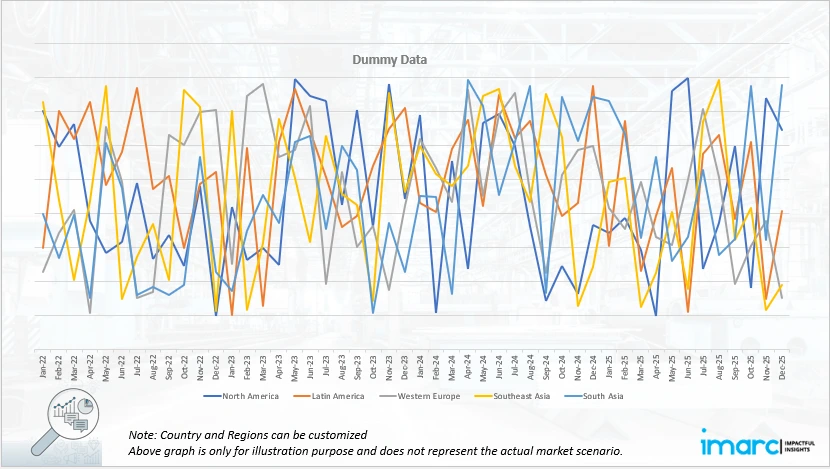
Ethylene Acrylic Elastomer Price Chart
Get real-time access to monthly/quarterly/yearly prices Request Sample
During the second quarter of 2026, the ethylene acrylic elastomer prices in USA reached 13,387 USD/MT in June. Prices in the country showed an upward movement driven by steady consumption from automotive sealing systems, industrial gaskets, and high performance elastomer applications. Procurement activity remained consistent as downstream converters maintained stable operating rates. Supply conditions were relatively tight due to periodic plant maintenance activities and constrained availability of certain feedstock streams.
During the second quarter of 2026, the ethylene acrylic elastomer prices in India reached 12,072 USD/MT in June. The domestic market reflected moderate strength supported by steady demand from automotive component manufacturers and industrial processing units. Buying activity was influenced by scheduled production requirements rather than speculative stocking. Import dependency continued to shape pricing behavior, with landed cost fluctuations affecting procurement decisions.
During the second quarter of 2026, the ethylene acrylic elastomer prices in the Netherlands reached 17,208 USD/MT in June. The market in the region was influenced by stable demand from advanced manufacturing and specialty polymer applications. Industrial buyers maintained structured procurement schedules, which supported consistent consumption levels. Supply conditions were shaped by regional production constraints and reliance on broader European distribution networks. Import flows played a significant role in balancing domestic requirements, while logistical considerations influenced delivery timelines.
During the second quarter of 2026, the ethylene acrylic elastomer prices in Thailand reached 13,979 USD/MT in June. The market showed steady growth supported by demand from automotive assembly, industrial rubber goods, and export oriented manufacturing units. Purchasing patterns were guided by contractual requirements, resulting in stable procurement cycles. Supply conditions were generally balanced, though regional transportation and import dependency influenced short term price adjustments.
During the second quarter of 2026, the ethylene acrylic elastomer prices in Spain reached 13,931 USD/MT in June. Market conditions were shaped by stable consumption across automotive sealing systems, construction related elastomer applications, and industrial manufacturing sectors. Procurement activity remained steady, driven by end use demand rather than speculative buying. Supply availability was influenced by broader European distribution flows and import reliance for specific grades.
Ethylene Acrylic Elastomer Prices Outlook Q1 2026
- USA: USD 12,736/MT
- India: USD 11,560/MT
- Netherlands: USD 16,657/MT
- Thailand: USD 13,200/MT
- Spain: USD 13,229/MT
During the first quarter of 2026, the ethylene acrylic elastomer prices in the USA reached 12,736 USD/MT in March. Prices moved upward as automotive and wire cable demand improved through the quarter. Buyers increased procurement to cover near term production needs, while sellers maintained firm offers due to stable feedstock pressure and limited spot flexibility. Demand from sealing components, hose applications, and heat resistant parts supported the market. Supply availability remained balanced, but import costs and freight conditions kept delivered prices firm.
During the first quarter of 2026, the ethylene acrylic elastomer prices in India reached 11,560 USD/MT in March. Prices increased as demand from automotive components, industrial rubber goods, and electrical applications improved. Local buyers showed stronger purchasing interest, supported by steady manufacturing activity and restocking across major downstream sectors. Import dependent supply conditions also influenced market sentiment, as suppliers kept offers firm due to logistics costs and feedstock related pressure.
During the first quarter of 2026, the ethylene acrylic elastomer prices in the Netherlands reached 16,657 USD/MT in March. Prices rose as demand from automotive, cable insulation, and technical rubber applications strengthened. Buyers showed active interest in securing material due to stable downstream production and concerns over replacement costs. European suppliers maintained firm pricing due to elevated operating expenses and limited willingness to lower margins.
During the first quarter of 2026, the ethylene acrylic elastomer prices in Thailand reached 13,200 USD/MT in March. Prices increased as demand from automotive parts, molded rubber products, and industrial applications improved. Buyers returned to the market for replenishment after earlier cautious purchasing, creating firmer spot activity. Regional suppliers held offers steady to higher due to feedstock pressure and tighter availability of specialty elastomer grades. Export linked manufacturing also supported demand for durable rubber components.
During the first quarter of 2026, the ethylene acrylic elastomer prices in Spain reached 13,229 USD/MT in March. Prices moved upward as demand from automotive sealing, wire cable, and industrial rubber sectors improved. Buyers increased procurement to maintain inventories for scheduled production, while suppliers kept offers firm due to cost pressure and limited discounting. Market sentiment strengthened as downstream converters reported better order flow.
Ethylene Acrylic Elastomer Prices Outlook Q4 2025
- USA: USD 12,065/MT
- India: USD 11,081/MT
- Netherlands: USD 15,719/MT
- Thailand: USD 12,562/MT
- Spain: USD 12,574/MT
During the fourth quarter of 2025, the ethylene acrylic elastomer prices in the USA reached 12,065 USD/MT in December. The market experienced a noticeable upward movement driven by stronger demand from automotive component manufacturing and sealing material applications. Supply conditions tightened as production rates were moderated at several petrochemical facilities, which reduced overall market availability. In addition, higher feedstock cost pressure from upstream petrochemical chains influenced pricing dynamics across the domestic market.
During the fourth quarter of 2025, the ethylene acrylic elastomer prices in India reached 11,081 USD/MT in December. Market conditions strengthened as downstream industries, including automotive parts, cable insulation, and industrial sealing applications, increased procurement activity. Manufacturing output in several rubber processing industries remained stable, encouraging consistent material purchases. Limited import arrivals combined with cautious domestic production levels created a tighter supply environment in the market.
During the fourth quarter of 2025, the ethylene acrylic elastomer prices in the Netherlands reached 15,719 USD/MT in December. The market recorded stronger price momentum as supply availability remained restricted across the regional distribution network. Maintenance activities at petrochemical facilities influenced production levels, which tightened supply within the European market. Demand from automotive manufacturing and industrial rubber component producers remained steady, supporting continuous purchasing activity.
During the fourth quarter of 2025, the ethylene acrylic elastomer prices in Thailand reached 12,562 USD/MT in December. The regional market observed gradual price strengthening supported by steady consumption from automotive component production and electrical insulation applications. Domestic processors maintained consistent operating rates, which sustained demand for elastomer materials. Supply availability remained measured as producers balanced output with export commitments across the Asia Pacific region.
During the fourth quarter of 2025, the ethylene acrylic elastomer prices in Spain reached 12,574 USD/MT in December. Market activity strengthened as downstream industries such as automotive components and industrial rubber goods maintained steady production schedules. Supply levels remained controlled due to moderated manufacturing output and balanced import availability across the European market. Distributors gradually replenished inventories to meet consistent demand from transportation equipment manufacturers and industrial machinery producers.
Ethylene Acrylic Elastomer Prices Outlook Q3 2025
- USA: USD 11,650/MT
- India: USD 10,760/MT
- Netherlands: USD 14,996/MT
- Thailand: USD 12,235/MT
- Spain: USD 12,195/MT
During the third quarter of 2025, the ethylene acrylic elastomer prices in the USA reached 11,650 USD/MT in September. The decline during this period was driven by weak demand from the automotive and construction sectors, which are major end markets for this material. Production costs edged up slightly due to higher ethylene feedstock costs, but weak restocking and elevated inventories among suppliers contributed to downward pressure.
During the third quarter of 2025, the ethylene acrylic elastomer prices in India reached 10,760 USD/MT in September. Indian pricing observed a downturn as local demand was dampened by slower growth in appliance manufacturing and construction activities. Imports were impacted by a slightly stronger Indian rupee and reduced urgency in restocking from buyers facing ample domestic inventories.
During the third quarter of 2025, the ethylene acrylic elastomer prices in the Netherlands reached 14,996 USD/MT in September. In the Netherlands, the uptick in pricing was influenced by constrained supply due to lower operating rates in regional production units and tighter availability of certain high performance grades. Freight and import surcharges into European ports increased, boosting landed costs.
During the third quarter of 2025, the ethylene acrylic elastomer prices in Thailand reached 12,235 USD/MT in September. In Thailand, the price decrease reflected soft demand in the domestic appliance and manufacturing sectors, while imports benefited from favorable currency movements that reduced landed costs. Although port congestion and shipping delays increased logistics premiums, these were offset by cautious purchasing patterns and reduced restocking by distributors, resulting in overall price decline.
During the third quarter of 2025, the ethylene acrylic elastomer prices in Spain reached 12,195 USD/MT in September. Spanish prices declined as construction activity remained subdued across the Iberian Peninsula, dampening demand for elastomer grades used in sealants and membranes. Import costs rose slightly due to higher freight charges, but weaker downstream offtake restricted suppliers’ ability to pass on full cost increases, leading to modest downward pricing adjustments.
Ethylene Acrylic Elastomer Prices Outlook Q2 2025
- USA: USD 11,827/MT
- India: USD 10,990/MT
- Netherlands: USD 14,644/MT
- Thailand: USD 12,575/MT
- Spain: USD 12,547/MT
During the second quarter of 2025, the ethylene acrylic elastomer prices in the USA reached 11,827 USD/MT in June. Prices were influenced by dampened demand from the automotive sector and high inventory levels with end-users. Upstream cost relief occurred as ethylene feedstock softened, allowing suppliers some price flexibility. Logistics and port handling remained stable, but weak restocking activity limited upward pricing.
During the second quarter of 2025, the ethylene acrylic elastomer prices in India reached 10,990 USD/MT in June. Indian market participants experienced pressure as manufacturing and appliance demand remained sluggish. Imports were facilitated by favorable shipping schedules, yet domestic transport and customs costs remained a proportional burden. Currency movements and slower downstream uptake prevented significant pricing momentum.
During the second quarter of 2025, the ethylene acrylic elastomer prices in the Netherlands reached 14,644 USD/MT in June. In the Netherlands, supply was steady, but buyers remained cautious amid slower industrial end-markets. Freight and handling costs increased modestly; however, suppliers were constrained in raising prices due to subdued purchasing.
During the second quarter of 2025, the ethylene acrylic elastomer prices in Thailand reached 12,575 USD/MT in June. In Thailand, import volumes were consistent but domestic demand from construction and manufacturing lagged. Logistics and port access operated with fewer disruptions; nonetheless, purchasing remained selective, limiting robust price support.
During the second quarter of 2025, the ethylene acrylic elastomer prices in Spain reached 12,547 USD/MT in June. In Spain, weak downstream activity in construction and appliance sectors kept demand modest. Import costs were elevated by freight and handling, but suppliers faced limited ability to increase prices due to cautious end-user procurement and inventory build-up.
Regional Coverage
The report provides a detailed analysis of the market across different regions, each with unique pricing dynamics influenced by localized market conditions, supply chain intricacies, and geopolitical factors. This includes price trends, price forecast and supply and demand trends for each region, along with spot prices by major ports. The report also provides coverage of FOB and CIF prices, as well as the key factors influencing ethylene acrylic elastomer prices.
Europe Ethylene Acrylic Elastomer Price Trend
Q2 2026:
The ethylene acrylic elastomer price index in Europe reflected a firm tone, supported by stable industrial consumption across automotive and engineering sectors. Demand from sealing systems, vibration resistant components, and specialty rubber applications remained consistent. Supply side conditions were influenced by periodic production adjustments and reliance on intra regional distribution networks. Import dependency for specific grades contributed to steady pricing pressure, especially where logistics influenced delivery schedules. Energy related cost considerations and cautious inventory management among distributors supported a stable to firm pricing environment.
Q1 2026:
The ethylene acrylic elastomer price index in Europe strengthened as demand improved from automotive, wire cable, and technical rubber applications. Regional buyers increased purchasing after earlier cautious activity, supporting firmer spot negotiations. Supply remained balanced, yet sellers maintained higher offers due to production cost pressure and limited margin flexibility. Demand from sealing systems and heat resistant components improved as manufacturers prepared for better order flow. Import costs also supported higher delivered prices, especially for specialty grades.
Q4 2025:
The ethylene acrylic elastomer price index in Europe demonstrated a firm upward movement. Regional supply conditions remained constrained due to moderated production levels at petrochemical manufacturing facilities and controlled inventory releases from distributors. Automotive manufacturing and industrial equipment production supported stable demand across several European economies. Procurement activity remained consistent as downstream manufacturers secured raw materials for ongoing production operations.
Q3 2025:
In the third quarter of 2025, the ethylene acrylic elastomer price index reflected divergent regional patterns. While demand from automotive and industrial sectors remained tepid, selective recovery in some premium grade applications supported upward pressure in certain markets. Supply side constraints emerged due to reduced operating rates at local manufacturing plants and higher freight premiums into ports, which elevated landed costs for importers. Moreover, compliance with stringent European chemical regulations contributed to incremental cost burdens for producers.
Q2 2025:
In the second quarter of 2025, the ethylene acrylic elastomer price index in Europe was under pressure as downstream automotive and construction sectors exhibited reduced offtake. A stronger euro lowered the USD-cost base of imports, which placed additional pressure on domestic pricing. Inventory levels among buyers were elevated, which weakened restocking activity. Export flows were constrained, and freight and logistics cost increases were partly absorbed by suppliers seeking to maintain volumes.
This analysis can be extended to include detailed ethylene acrylic elastomer price information for a comprehensive list of countries.
| Region | Countries Covered |
|---|---|
| Europe | Germany, France, United Kingdom, Italy, Spain, Russia, Turkey, Netherlands, Poland, Sweden, Belgium, Austria, Ireland, Switzerland, Norway, Denmark, Romania, Finland, Czech Republic, Portugal, and Greece, among other European countries. |
North America Ethylene Acrylic Elastomer Price Trend
Q2 2026:
The ethylene acrylic elastomer price index in North America moved with a firm undertone, supported by consistent demand from automotive manufacturing and industrial equipment production. Replacement demand in sealing and gasket applications contributed to steady consumption patterns. Supply availability was influenced by scheduled maintenance activities and controlled production rates across key facilities. Import flows remained a balancing factor, though procurement decisions were guided by long term contracting structures. Inventory discipline across the supply chain prevented sharp fluctuations in spot activity.
Q1 2026:
The ethylene acrylic elastomer price index in North America moved upward, supported by improved demand from automotive parts, cable compounds, and oil resistant rubber applications. Buyers increased procurement to cover production needs, which strengthened market activity. Suppliers maintained firm offers as feedstock pressure and operating costs limited room for price reductions. Demand from hose, gasket, and sealing component manufacturers improved through the quarter. Import replacement costs also supported local pricing, as buyers faced higher delivered costs for specialty grades. Market sentiment improved as downstream users returned to planned purchasing.
Q4 2025:
The ethylene acrylic elastomer price index in North America also reflected an upward trend. Demand from automotive component manufacturing and transportation equipment production remained steady, supporting continuous procurement activity. Domestic production conditions remained measured, which limited the expansion of available supply in the market. Distributors gradually replenished inventories to meet stable downstream consumption across industrial rubber processing sectors. Export inquiries from regional trading partners also supported supplier confidence and encouraged stronger pricing strategies.
Q3 2025:
In North America, during Q3 2025, the ethylene acrylic elastomer price index fell, as weak automotive and construction demand weighed on offtake. Producers faced elevated inventories and limited restocking from downstream users, which tempered price increases despite upstream cost pressures. Shipping, port handling and logistics costs continued to rise, but these could not be fully passed through due to cautious purchasing behavior. The currency strength of the US dollar reduced import cost pressure, somewhat alleviating cost burdens for domestic manufacturers.
Q2 2025:
During Q2 2025 in North America, the ethylene acrylic elastomer price index witnessed weak demand from the automotive and construction sectors and a cautious purchasing environment. Production costs eased as ethylene feedstock prices fell, giving suppliers room to offer lower prices. Freight and logistics operations remained stable, but the lack of strong demand prevented upward pricing momentum. Inventory build-up among distributors and end-users further constrained price support, leading to broadly soft price behavior.
Specific ethylene acrylic elastomer historical data within the United States and Canada can also be provided.
| Region | Countries Covered |
|---|---|
| North America | United States and Canada |
Middle East and Africa Ethylene Acrylic Elastomer Price Trend
Q2 2026:
The study looks at ethylene acrylic elastomer pricing trends and price charts across the Middle East and Africa, taking into account elements that have a direct impact on market prices, such as regional industrial expansion, natural resource availability, and geopolitical concerns.
Q1 2026:
According to the ethylene acrylic elastomer price chart, prices in the Middle East and Africa exhibited fluctuations due to a combination of factors, mainly influenced by supply chain disruptions, changing seasonal demand patterns, and ongoing geopolitical developments.
Q4 2025:
The report explores the ethylene acrylic elastomer pricing trends and ethylene acrylic elastomer price chart in the Middle East and Africa, considering factors like regional industrial growth, the availability of natural resources, and geopolitical tensions that uniquely influence market prices.
Q3 2025:
As per the ethylene acrylic elastomer price chart, the prices in the Middle East and Africa fluctuated due to a complex interplay of factors, primarily driven by supply chain disruptions, seasonal demand shifts, and geopolitical influences.
In addition to region-wise data, information on ethylene acrylic elastomer prices for countries can also be provided.
| Region | Countries Covered |
|---|---|
| Middle East and Africa | Saudi Arabia, UAE, Israel, Iran, South Africa, Nigeria, Oman, Kuwait, Qatar, Iraq, Egypt, Algeria, and Morocco, among other Middle Eastern and African countries. |
Asia Pacific Ethylene Acrylic Elastomer Price Trend
Q2 2026:
The Asia Pacific ethylene acrylic elastomer market recorded bullish pricing behavior, supported by consistent demand from automotive, industrial rubber goods, and export oriented manufacturing sectors. Procurement activity was largely contract driven, resulting in stable purchasing cycles across major consuming countries. Supply conditions remained adequate, although import reliance in certain markets influenced short term price movements. Manufacturing activity across downstream industries supported continuous consumption. Inventory levels were managed carefully to align with production schedules, limiting speculative buying. Overall market sentiment remained stable, with balanced supply demand dynamics supporting consistent pricing trends across the region.
Q1 2026:
In the Asia Pacific, ethylene acrylic elastomer prices rose as demand improved across automotive, electronics, cable, and industrial rubber applications. Buyers in major manufacturing markets increased purchases after cautious activity in the previous quarter. Regional suppliers held firm offers due to feedstock pressure and stronger downstream inquiries. Export oriented production supported demand for high performance elastomer compounds used in heat resistant and oil resistant parts. Supply availability remained manageable, but sellers avoided discounts due to improved order flow. Market participants reported better buying confidence from converters and compounders.
Q4 2025:
Across the Asia Pacific region, ethylene acrylic elastomer prices moved upward, supported by steady manufacturing demand. Automotive component production, electrical insulation manufacturing, and industrial rubber goods processing contributed to consistent procurement activity. Regional producers maintained balanced operating rates, which limited rapid expansion of product availability in the market. Export commitments from major producing countries also restricted the supply available for domestic distribution.
Q3 2025:
In the Asia Pacific region, Q3 2025 saw downward trends for ethylene acrylic elastomer. In countries like Thailand and India, soft demand in manufacturing and construction sectors kept prices under pressure, while import costs were relieved by beneficial currency movements in some markets. Supply flows remained stable, but cautious restocking and muted buyer sentiment moderated pricing. The net result in the Asia Pacific was a modest decline in average prices for many markets.
Q2 2025:
In the Asia Pacific region, Q2 2025 saw the ethylene acrylic elastomer market facing muted consumption in construction and manufacturing sectors. Domestic demand remained subdued, despite stable supply. Importers benefited from favorable currency exchange in some instances, reducing landed costs. Logistics and port operations were smooth, which lowered transportation premiums. However, cautious buying restricted sharp fluctuations, and pricing remained under pressure.
This ethylene acrylic elastomer price analysis can be expanded to include a comprehensive list of countries within the region.
| Region | Countries Covered |
|---|---|
| Asia Pacific | China, India, Indonesia, Pakistan, Bangladesh, Japan, Philippines, Vietnam, Thailand, South Korea, Malaysia, Nepal, Taiwan, Sri Lanka, Hongkong, Singapore, Australia, and New Zealand, among other Asian countries. |
Latin America Ethylene Acrylic Elastomer Price Trend
Q2 2026:
The market for ethylene acrylic elastomer in Latin America is primarily driven by the region's abundant natural resources, particularly in Chile and Brazil. However, the price of ethylene acrylic elastomer may change dramatically due to different regulatory regimes and political instability.
Q1 2026:
The market for ethylene acrylic elastomer in Latin America is primarily impacted by the region's abundant natural resources, especially in nations like Chile and Brazil. Apricot costs, however, can fluctuate significantly due to political unpredictability and uneven regulatory regimes.
Q4 2025:
Latin America's ethylene acrylic elastomer market is predominantly influenced by its rich natural reserves, particularly in countries like Chile and Brazil. However, political instability and inconsistent regulatory frameworks can lead to significant volatility in ethylene acrylic elastomer prices.
Q3 2025:
Infrastructure challenges and logistical inefficiencies often impact the supply chain, affecting the region's ability to meet international demand consistently. Moreover, the ethylene acrylic elastomer price index, economic fluctuations, and currency devaluation are critical factors that need to be considered when analyzing ethylene acrylic elastomer pricing trends in this region.
This comprehensive review can be extended to include specific countries within the region.
| Region | Countries Covered |
|---|---|
| Latin America | Brazil, Mexico, Argentina, Columbia, Chile, Ecuador, and Peru, among other Latin American countries.Brazil, Mexico, Argentina, Columbia, Chile, Ecuador, and Peru, among other Latin American countries. |
Ethylene Acrylic Elastomer Pricing Report, Market Analysis, and News
IMARC's latest publication, “Ethylene Acrylic Elastomer Prices, Trend, Chart, Demand, Market Analysis, News, Historical and Forecast Data Report 2026 Edition,” presents a detailed examination of the ethylene acrylic elastomer market, providing insights into both global and regional trends that are shaping prices. This report delves into the spot price of ethylene acrylic elastomer at major ports and analyzes the composition of prices, including FOB and CIF terms. It also presents detailed ethylene acrylic elastomer prices trend analysis by region, covering North America, Europe, Asia Pacific, Latin America, and Middle East and Africa. The factors affecting ethylene acrylic elastomer pricing, such as the dynamics of supply and demand, geopolitical influences, and sector specific developments, are thoroughly explored. This comprehensive report helps stakeholders stay informed with the latest market news, regulatory updates, and technological progress, facilitating informed strategic decision-making and forecasting.

Ethylene Acrylic Elastomer Industry Analysis
The global ethylene acrylic elastomer market size reached 439.22 Thousand Tonnes in 2025. By 2034, IMARC Group expects the market to reach 609.11 Thousand Tonnes, at a projected CAGR of 3.70% during 2026-2034. The market is primarily driven by the need for heat and oil resistant elastomers, rising output of vehicles and infrastructure development, increased use in high performance applications and ongoing innovation in compound formulations.
Latest News and Developments:
- May 2025: Researchers developed new elastomeric copolymers synthesized from mono and diacrylate monomers, achieving exceptionally low glass transition temperatures below 60 °C and high thermos mechanical stability. Using nona (ethylene glycol) methyl ether acrylate (EG9MEA) as the main monomer, stability was enhanced by copolymerizing with 4-hydroxybutyl acrylate above 30 wt%. The study, focused on the modification of thermo-mechanical properties of tailored acrylic elastomers with a low glass transition temperature, proposed an experimental model predicting elastic modulus based on EG9MEA, diacrylate, and transfer agent ratios.
Product Description
Ethylene acrylic elastomer is a specialty synthetic rubber produced through copolymerization of ethylene with acrylic based monomers. It is designed to deliver strong resistance to heat, oil, and oxidation, making it suitable for demanding industrial environments. The material offers excellent flexibility, sealing capability, and long term durability under mechanical stress. It is widely used in automotive applications such as gaskets, seals, hoses, and vibration control components. It also finds application in industrial machinery, chemical resistant linings, and electrical insulation systems. The elastomer maintains stable performance across a wide temperature range and shows strong resistance to weathering and aging. Its balanced mechanical and chemical properties make it a preferred material in high performance engineering applications.
Report Coverage
| Key Attributes | Details |
|---|---|
| Product Name | Ethylene Acrylic Elastomer |
| Report Features | Exploration of Historical Trends and Market Outlook, Industry Demand, Industry Supply, Gap Analysis, Challenges, Ethylene Acrylic Elastomer Price Analysis, and Segment-Wise Assessment. |
| Currency/Units | US$ (Data can also be provided in local currency) or Metric Tons |
| Region/Countries Covered | The current coverage includes analysis at the global and regional levels only. Based on your requirements, we can also customize the report and provide specific information for the following countries: Asia Pacific: China, India, Indonesia, Pakistan, Bangladesh, Japan, Philippines, Vietnam, Thailand, South Korea, Malaysia, Nepal, Taiwan, Sri Lanka, Hongkong, Singapore, Australia, and New Zealand Europe: Germany, France, United Kingdom, Italy, Spain, Russia, Turkey, Netherlands, Poland, Sweden, Belgium, Austria, Ireland, Switzerland, Norway, Denmark, Romania, Finland, Czech Republic, Portugal and Greece North America: United States and Canada Latin America: Brazil, Mexico, Argentina, Columbia, Chile, Ecuador, and Peru Middle East & Africa: Saudi Arabia, UAE, Israel, Iran, South Africa, Nigeria, Oman, Kuwait, Qatar, Iraq, Egypt, Algeria, and Morocco The list of countries presented is not exhaustive. Information on additional countries can be provided if required by the client. |
| Information Covered for Key Suppliers |
|
| Customization Scope | The report can be customized as per the requirements of the customer |
| Report Price and Purchase Option |
Plan A: Monthly Updates - Annual Subscription
Plan B: Quarterly Updates - Annual Subscription
Plan C: Biannually Updates - Annual Subscription
|
| Post-Sale Analyst Support | 360-degree analyst support after report delivery |
| Delivery Format | PDF and Excel through email (We can also provide the editable version of the report in PPT/Word format on special request) |
Key Benefits for Stakeholders:
- IMARC’s report presents a detailed analysis of ethylene acrylic elastomer pricing, covering global and regional trends, spot prices at key ports, and a breakdown of Ex Works, FOB, and CIF prices.
- The study examines factors affecting ethylene acrylic elastomer price trend, including raw material costs, supply-demand shifts, geopolitical impacts, and industry developments, offering insights for informed decision-making.
- The competitive landscape review equips stakeholders with crucial insights into the latest market news, regulatory changes, and technological advancements, ensuring a well-rounded, strategic overview for forecasting and planning.
- IMARC offers various subscription options, including monthly, quarterly, and biannual updates, allowing clients to stay informed with the latest market trends, ongoing developments, and comprehensive market insights. The ethylene acrylic elastomer price charts ensure our clients remain at the forefront of the industry.
Need more help?
- Speak to our experienced analysts for insights on the current market scenarios.
- Include additional segments and countries to customize the report as per your requirement.
- Gain an unparalleled competitive advantage in your domain by understanding how to utilize the report and positively impacting your operations and revenue.
- For further assistance, please connect with our analysts.
 Request Customization
 Inquire Before Buying
 Speak to an Analyst
 Request Brochure
Benefits of Customization
- Personalize this research
- Triangulate with your data
- Get data as per your format and definition
- Gain a deeper dive into a specific application, geography, customer, or competitor
- Any level of personalization
Get in Touch With Us
UNITED STATES
Phone: +1-201-971-6302
INDIA
Phone: +91-120-433-0800
UNITED KINGDOM
Phone: +44-753-714-6104
Email: [email protected]
Client Testimonials




.webp)




.webp)













Related Reports

Why Choose Us
IMARC offers trustworthy, data-centric insights into commodity pricing and evolving market trends, enabling businesses to make well-informed decisions in areas such as procurement, strategic planning, and investments. With in-depth knowledge spanning more than 1000 commodities and a vast global presence in over 150 countries, we provide tailored, actionable intelligence designed to meet the specific needs of diverse industries and markets.
1000
+Commodities
150
+Countries Covered
3000
+Clients
20
+Industry

Robust Methodologies & Extensive Resources
IMARC delivers precise commodity pricing insights using proven methodologies and a wealth of data to support strategic decision-making.

Subscription-Based Databases
Our extensive databases provide detailed commodity pricing, import-export trade statistics, and shipment-level tracking for comprehensive market analysis.

Primary Research-Driven Insights
Through direct supplier surveys and expert interviews, we gather real-time market data to enhance pricing accuracy and trend forecasting.

Extensive Secondary Research
We analyze industry reports, trade publications, and market studies to offer tailored intelligence and actionable commodity market insights.
Trusted by 3000+ industry leaders worldwide to drive data-backed decisions. From global manufacturers to government agencies, our clients rely on us for accurate pricing, deep market intelligence, and forward-looking insights.