
Europe Biostimulants Market Size, Share, Trends and Forecast by Product Type, Crop Type, Form, Origin, Distribution Channel, Application, End-User, and Country, 2026-2034
Europe Biostimulants Market Size and Share:
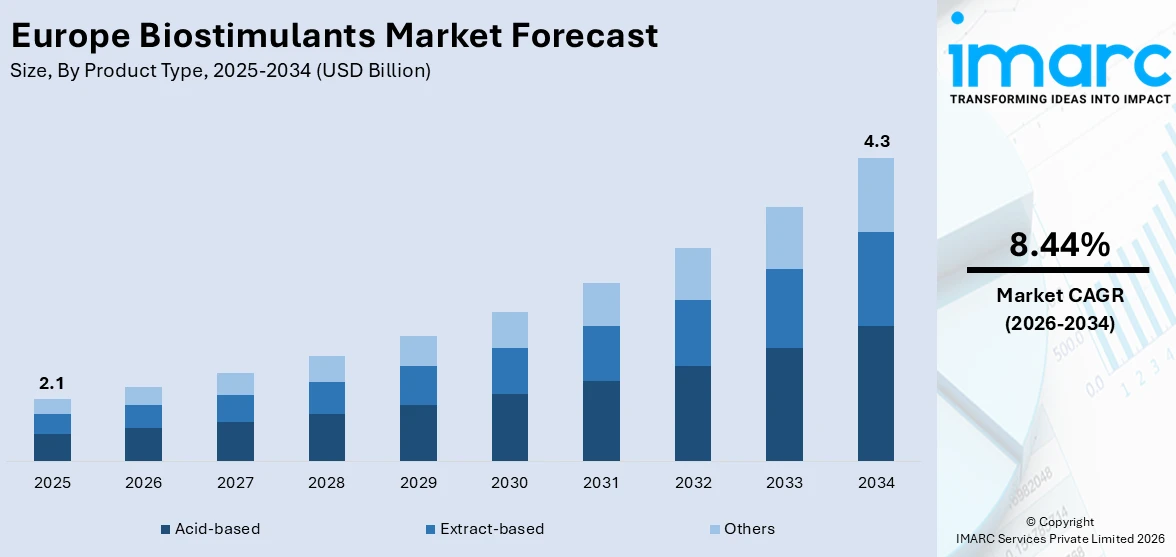
The Europe biostimulants market size was valued at USD 2.1 Billion in 2025. Looking forward, IMARC Group estimates the market to reach USD 4.3 Billion by 2034, exhibiting a CAGR of 8.44% during 2026-2034. Germany dominated the market, holding a significant market share of over 26.6% in 2025. Germany's strong agricultural sector, advanced farming technologies, and favorable government policies supporting sustainable practices are some of the key factors contributing to the Europe biostimulants market share.
|
Report Attribute
|
Key Statistics
|
|---|---|
|
Base Year
|
2025
|
|
Forecast Years
|
2026-2034
|
|
Historical Years
|
2020-2025
|
|
Market Size in 2025
|
USD 2.1 Billion |
|
Market Forecast in 2034
|
USD 4.3 Billion |
| Market Growth Rate (2026-2034) | 8.44% |
The Europe biostimulants market is influenced by a number of drivers, the first being sustainability. Since consumers continue to call for organic and green products, farmers now opt to use biostimulants to improve crop quantity and quality while minimizing chemical use. The push to reduce pesticide use from regulatory sources further contributes to the growth of the market. Biostimulants, which enhance plant growth, stress resistance, and nutrient acquisition, are regarded as useful solutions to these challenges. Biotechnology advancements, including the emergence of microbial and nature-based biostimulants, have resulted in more effective solutions for farmers. Support and incentives from governments for the adoption of sustainable agricultural practices are also promoting the utilization of biostimulants. Increased awareness of environmental and health issues associated with traditional agriculture drives demand for green farming options, opening up the market even wider.
To get more information on this market Request Sample
The Europe biostimulants market growth is supported by an increasing focus on sustainable agriculture, driving innovations in this sector. New biostimulant products, featuring beneficial bacteria to boost nitrogen uptake in plants, are emerging in global markets. These solutions reduce reliance on synthetic fertilizers, offering an eco-friendly approach to enhancing crop yields and promoting environmental sustainability. For instance, in February 2025, Swiss agricultural technology company Syngenta and Madrid-based Ceres Biotics expanded their collaboration to introduce VIXERAN, a biostimulant based on the endophytic bacterium Azotobacter salinestris (CECT9690), to global markets. This innovative product enhances nitrogen uptake in plants, reducing the need for synthetic fertilizers and promoting sustainable agriculture.
Europe Biostimulants Market Trends:
Growing Soil Health Awareness
In Europe, concerns about soil degradation are increasing as experts warn that a significant portion of soils are deteriorating due to current agricultural practices. If left unaddressed, this issue could worsen, potentially leading to a global soil health crisis by 2050. As a result, there’s a noticeable shift toward adopting more sustainable farming techniques, with an emphasis on improving soil vitality. This includes a greater focus on natural products that can support soil regeneration and reduce dependence on chemical fertilizers. European farmers are exploring biostimulants and other eco-friendly solutions to enhance soil health, reduce environmental impact, and ensure long-term agricultural productivity. The demand for these alternatives is rising as environmental concerns gain more attention. According to the European Environmental Bureau, up to 70% of soils in Europe are degraded, and if current practices persist, 90% of global soils may face poor health by 2050. These developments are a key driver behind Europe biostimulants market trends, as the region increasingly embraces sustainable and regenerative agricultural inputs.
EU Push for Organic Farming Expansion
The European Commission is driving efforts to expand organic farming across the EU, aiming to significantly increase its share of agricultural land in the coming years. The push is backed by substantial EU funding, reflecting a commitment to fostering more sustainable agricultural practices. This shift is part of a broader initiative to improve food systems, enhance biodiversity, and reduce the environmental footprint of farming. By investing in organic farming methods, the EU hopes to promote healthier ecosystems, reduce chemical input use, and support more environmentally responsible agriculture. This move is gaining momentum as policymakers and farmers align to meet sustainability goals while addressing the challenges of modern agriculture, shaping the Europe biostimulants market outlook. For example, the European Commission aims to increase organic farming to 25% of the EU's agricultural land by 2030, up from 10.5% in 2022. Between 2014 and 2022, over EUR 12 Billion in EU funding supported this growth.
Rising Commitment to Safer Agricultural Practices
A recent biomonitoring survey across multiple European countries reveals widespread pesticide residue presence in both children and adults. The findings show that a significant majority of samples contained pesticide traces, with many showing exposure to more than one type of pesticide. This raises concerns about the potential health risks associated with long-term exposure, especially in vulnerable populations. The results are fueling calls for stricter regulations and greater transparency regarding pesticide use in agriculture. As per the Europe biostimulants market forecast, there is increasing interest in alternative farming practices, such as organic and sustainable agriculture, to reduce reliance on chemicals and protect public health. For example, between 2014 and 2021, a human biomonitoring survey across five European countries found pesticide residues in 84% of samples from children and adults, with two or more pesticides present.
.webp)
Europe Biostimulants Industry Segmentation:
IMARC Group provides an analysis of the key trends in each segment of the Europe biostimulants market, along with forecasts at the regional and country levels from 2026-2034. The market has been categorized based on product type, crop type, form, origin, distribution channel, application, end-user, and country.
Analysis by Product Type:
- Acid-based
- Humic Acid
- Fulvic Acid
- Amino Acid
- Extract-based
- Seaweed Extract
- Other Plant Extracts
- Others
- Microbial Soil Amendments
- Chitin and Chitosan
- Others
Acid-based stood as the largest product type in 2025, holding around 57.8% of the market. due to the increasing demand for natural and sustainable agricultural practices. These biostimulants, which include amino acids and humic acids, promote plant growth, enhance stress tolerance, and improve nutrient uptake. In Europe, where sustainable farming is a priority, acid-based biostimulants are gaining traction for their eco-friendly benefits. These products are effective in reducing the need for chemical fertilizers, thus aligning with environmental regulations and consumer preference for organic produce. Additionally, the growing adoption of precision farming techniques and the need to enhance crop yield without harming the ecosystem further fuel the demand for acid-based biostimulants in the Europe market.
Analysis by Crop Type:
- Cereals and Grains
- Fruits and Vegetables
- Turf and Ornamentals
- Oilseeds and Pulses
- Others
Cereals and grains led the market with around 55% of market share in 2025, as these crops are essential to the region’s agricultural economy and food security. Biostimulants, especially those based on amino acids and humic substances, help improve the growth, yield, and stress tolerance of cereals and grains like wheat, barley, and corn. With increasing challenges such as climate change, soil degradation, and the need for sustainable farming practices, biostimulants offer an effective solution. They enhance nutrient absorption, reduce crop stress, and increase resistance to diseases and environmental conditions. The growing demand for higher yields and more resilient crops in the cereal and grain sector further drives the adoption of biostimulants across Europe.
Analysis by Form:
- Dry
- Liquid
Dry led the market in 2025 as it caters to the increasing demand for efficient and cost-effective solutions for farmers. Dry biostimulants, such as powders or granules, are easier to transport, store, and handle compared to liquid formulations, making them a preferred choice for large-scale agricultural operations. These products help enhance plant growth, improve stress tolerance, and optimize nutrient absorption, particularly in regions facing water scarcity or dry conditions. As European farmers seek ways to mitigate drought stress and boost crop resilience, dry biostimulants offer a practical, sustainable solution. The growing emphasis on environmental sustainability, coupled with the need for higher crop yields under challenging conditions, is pushing the demand for dry-formulated biostimulants in Europe.
Analysis by Origin:
- Natural
- Synthetic
Natural led the market in 2025 as consumers and farmers increasingly prioritize sustainability and eco-friendly practices. Natural biostimulants, derived from plant, animal, or microbial sources, are preferred due to their minimal environmental impact compared to synthetic alternatives. As Europe embraces stricter environmental regulations and a shift toward organic farming, the demand for natural biostimulants has surged. These products enhance plant growth, improve resilience to pests and diseases, and optimize nutrient uptake without harming ecosystems. They are especially popular among farmers seeking to align with the EU's Green Deal and the organic farming certification standards. The increasing consumer demand for organic and sustainably grown food further fuels the growth of the natural biostimulants segment in Europe.
Analysis by Distribution Channel:
Access the comprehensive market breakdown Request Sample
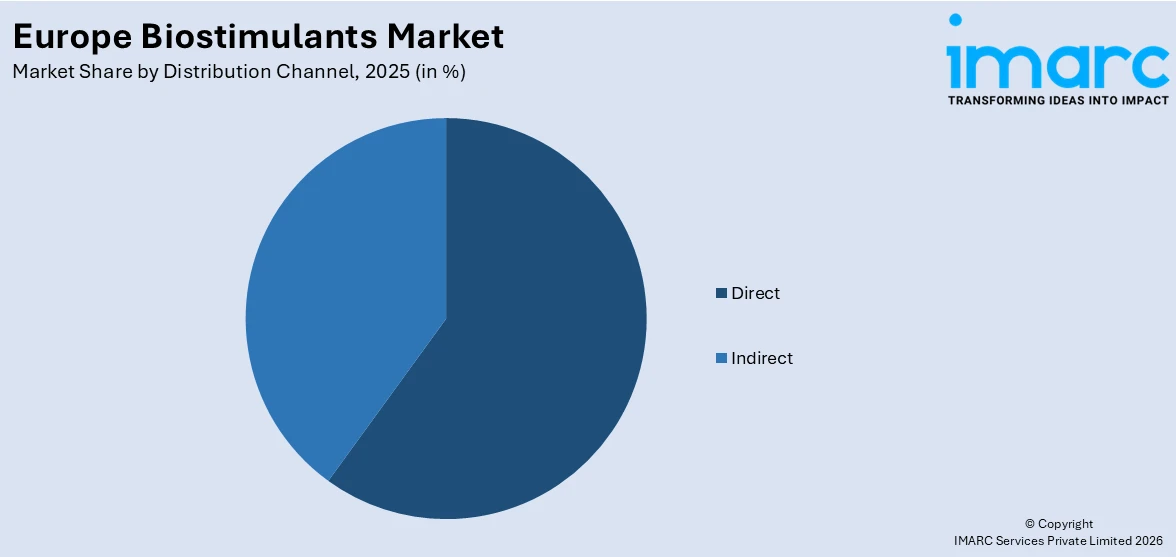
- Direct
- Indirect
Direct led the market in 2025 since it addresses the growing demand for products that offer immediate, tangible benefits to farmers. Direct biostimulants are typically applied directly to crops or soil, providing quick results in terms of plant growth, stress reduction, and nutrient uptake. These products are highly valued for their efficiency and ease of use, especially in regions where rapid response to environmental stress or nutrient deficiencies is essential. As European agriculture moves toward more sustainable practices, direct biostimulants are seen as a way to improve crop yield and quality while minimizing the environmental impact of traditional chemical fertilizers. Their ability to deliver measurable improvements in plant performance directly drives their adoption across Europe.
Analysis by Application:
- Foliar Treatment
- Soil Treatment
- Seed Treatment
Foliar treatment led the market in 2025 due to its effectiveness in enhancing crop growth and productivity. Foliar application, which involves spraying biostimulants directly onto plant leaves, allows for faster absorption and quicker results compared to soil treatments. This method is especially beneficial for addressing nutrient deficiencies, stress conditions, and improving overall plant health. Owing to its ability to deliver immediate benefits, foliar treatment is gaining popularity in Europe, where precision farming and sustainable practices are highly prioritized. Farmers are increasingly adopting this approach to optimize crop yields while minimizing the environmental impact of traditional fertilizers. As a result, the foliar treatment segment continues to grow within the European biostimulants market.
Analysis by End-User:
- Farmers
- Research Organizations
- Others
Farmers led the market in 2025, owing to the growing adoption of sustainable farming practices. Farmers across Europe are increasingly turning to biostimulants as a way to boost crop yields, improve plant resilience, and reduce dependency on chemical fertilizers. This shift is driven by rising environmental concerns, stricter regulations, and consumer demand for organic and sustainably grown produce. Biostimulants help farmers enhance soil health, improve nutrient uptake, and protect crops from environmental stressors such as drought or disease. As the agricultural landscape evolves, farmers are seeking innovative solutions to maintain productivity while minimizing environmental impact. This growing reliance on biostimulants as a key tool in modern farming practices is significantly driving market growth in Europe.
Analysis by Country:
- Germany
- France
- United Kingdom
- Italy
- Spain
- Others
In 2025, Germany accounted for the largest market share of over 26.6% due to its robust agricultural industry, which is highly focused on innovation and sustainability. The country’s farmers are increasingly adopting biostimulants to improve crop yield, quality, and resistance to environmental stressors while reducing the reliance on chemical fertilizers and pesticides. Germany's strong emphasis on precision farming technologies and its large-scale farming operations drive the demand for advanced biostimulant products. Additionally, government initiatives promoting eco-friendly agricultural practices and reducing environmental impact further support the adoption of biostimulants. The country also benefits from well-established research and development in the field, contributing to the introduction of more effective and efficient biostimulant solutions. Germany's position as a leader in sustainable agriculture and innovation makes it the dominant player in the Europe market.
Competitive Landscape:
The Europe biostimulants market has seen significant recent developments, including numerous product launches, partnerships, and collaborations. Companies are introducing innovative biostimulant products focused on sustainability and efficiency, addressing the rising demand for eco-friendly solutions. Partnerships between biostimulant manufacturers and agricultural research institutions are also common, facilitating the development of more effective products. Governments across Europe are increasingly supporting the market through subsidies, regulations, and initiatives that encourage sustainable farming practices, including the use of biostimulants. Research and development in biotechnologies and natural-based solutions continue to grow, with many companies investing in this area. Funding for biostimulant start-ups is on the rise as investors recognize the sector's potential, while collaborations between private companies and governmental bodies are enhancing market growth.
The report provides a comprehensive analysis of the competitive landscape in the Europe biostimulants market with detailed profiles of all major companies.
Latest News and Developments:
- February 2025: Belgium-based Fyteko raised EUR 13 Million in Series B funding to scale production, expand internationally, and advance research and development (R&D). Its enzymatic synthesis-based biostimulants help crops like corn and vines withstand water stress, supporting sustainable agriculture amid Europe’s growing drought concerns and increasingly severe climate-related challenges.
- October 2024: BASF and Elicit Plant announced that they would partner to advance EliSun-a and EliGrain-a biostimulants for sunflowers and cereals in France. Elicit Plant also secured USD 48 million in Series B funding to expand globally, targeting the U.S. Corn Belt with its phytosterol-based biosolutions and planning a 2025 launch.
- September 2024: Rovensa Next’s seaweed-based biostimulant Phylgreen earned CE marking under the EU Fertilizing Products Regulation. Now marketable across all 27 EU countries, Phylgreen enhances drought resistance in various crops and shows potential against other stresses like heat and cold, supporting sustainable agriculture through Rovensa’s Primactive Effect technology.
- March 2024: Helsinki-based UPM Biochemicals launched UPM Solargo, a new range of lignin-based, bio-based biostimulants for sustainable agriculture. Designed to augment crop yield, soil health, and reduce reliance on traditional fertilizers, Solargo marks UPM’s entry into the agrochemicals market following years of R&D and successful test marketing in Europe.
Europe Biostimulants Market Report Scope:
| Report Features | Details |
|---|---|
| Base Year of the Analysis | 2025 |
| Historical Period | 2020-2025 |
| Forecast Period | 2026-2034 |
| Units | Billion USD |
| Scope of the Report |
Exploration of Historical Trends and Market Outlook, Industry Catalysts and Challenges, Segment-Wise Historical and Future Market Assessment:
|
| Product Types Covered |
|
| Crop Types Covered | Cereals and Grains, Fruits and Vegetables, Turf and Ornamentals, Oilseeds and Pulses, Others |
| Forms Covered | Dry, Liquid |
| Origins Covered | Natural, Synthetic |
| Distribution Channels Covered | Direct, Indirect |
| Applications Covered | Foliar Treatment, Soil Treatment, Seed Treatment |
| End-Users Covered | Farmers, Research Organizations, Others |
| Countries Covered | Germany, France, United Kingdom, Italy, Spain |
| Customization Scope | 10% Free Customization |
| Post-Sale Analyst Support | 10-12 Weeks |
| Delivery Format | PDF and Excel through Email (We can also provide the editable version of the report in PPT/Word format on special request) |
Key Benefits for Stakeholders:
- IMARC’s report offers a comprehensive quantitative analysis of various market segments, historical and current market trends, market forecasts, and dynamics of the Europe biostimulants market from 2020-2034.
- The research study provides the latest information on the market drivers, challenges, and opportunities in the Europe biostimulants market.
- Porter's Five Forces analysis assists stakeholders in assessing the impact of new entrants, competitive rivalry, supplier power, buyer power, and the threat of substitution. It helps stakeholders to analyze the level of competition within the Europe biostimulants industry and its attractiveness.
- Competitive landscape allows stakeholders to understand their competitive environment and provides an insight into the current positions of key players in the market.
Frequently Asked Questions About the Europe Biostimulants Market Report
The biostimulants market in Europe was valued at USD 2.1 Billion in 2025.
The Europe biostimulants market is projected to exhibit a CAGR of 8.44% during 2026-2034, reaching a value of USD 4.3 Billion by 2034.
The key factors driving the Europe biostimulants market include increasing demand for sustainable farming practices, the need to improve crop yields, environmental regulations, and consumer preference for organic products. Advancements in biotechnologies and government support for eco-friendly agriculture further boost market growth.
Germany accounted for the largest share, holding around 26.6% of the market in 2025 due to its advanced agricultural technologies, large-scale farming, government support for sustainability, and strong focus on innovation, driving demand for eco-friendly and effective biostimulant solutions.
Need more help?
- Speak to our experienced analysts for insights on the current market scenarios.
- Include additional segments and countries to customize the report as per your requirement.
- Gain an unparalleled competitive advantage in your domain by understanding how to utilize the report and positively impacting your operations and revenue.
- For further assistance, please connect with our analysts.
 Request Customization
 Speak to an Analyst
 Request Brochure
 Inquire Before Buying
Benefits of Customization
- Personalize this research
- Triangulate with your data
- Get data as per your format and definition
- Gain a deeper dive into a specific application, geography, customer, or competitor
- Any level of personalization
Get in Touch With Us
UNITED STATES
Phone: +1-201-971-6302
INDIA
Phone: +91-120-433-0800
UNITED KINGDOM
Phone: +44-753-714-6104
Email: [email protected]
Client Testimonials


.webp)


