
Europe Natural Sweetener Market Report by Product Type (Stevia, Xylitol, Sorbitol, Mannitol, Erythritol, and Others), Form (Powder, Liquid), Application (Food & Beverages, Pharmaceuticals, Personal Care, and Others), Distribution Channel (Supermarkets and Hypermarkets, Convenience Stores, Specialty Stores, Online Retailers, and Others), and Region 2026-2034
Europe Natural Sweetener Market Overview:
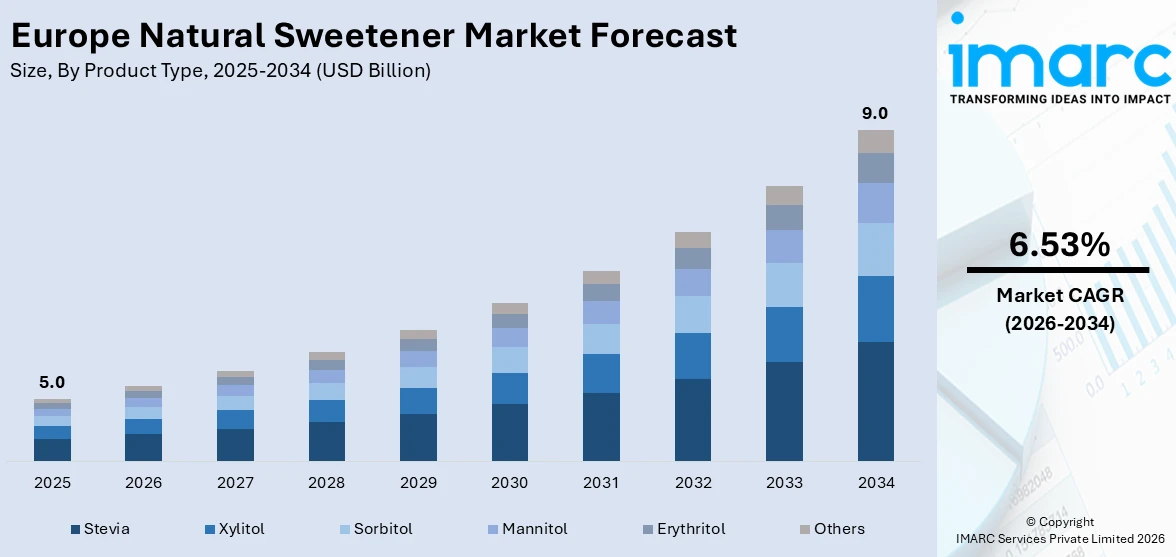
The Europe natural sweetener market size reached USD 5.0 Billion in 2025. Looking forward, IMARC Group expects the market to reach USD 9.0 Billion by 2034, exhibiting a growth rate (CAGR) of 6.53% during 2026-2034.
|
Report Attribute
|
Key Statistics
|
|---|---|
|
Base Year
|
2025
|
|
Forecast Years
|
2026-2034
|
|
Historical Years
|
2020-2025
|
|
Market Size in 2025
|
USD 5.0 Billion |
|
Market Forecast in 2034
|
USD 9.0 Billion |
| Market Growth Rate 2026-2034 | 6.53% |
Natural sweeteners refer to sugar substitutes that are naturally extracted from several plant-based sources and represent healthier alternatives to sugar or other sugar substitutes. Some of the common natural sweeteners include stevia, xylitol, sorbitol, mannitol, erythritol, etc. These sweeteners are added to various food products and beverages for improving their palatability, digestibility, and shelf life. Furthermore, natural sweeteners help in maintaining blood sugar levels, enhancing digestive functioning, improving metabolism, and minimizing high blood pressure. In Europe, natural sweeteners are widely used in bakery products, dairy items, confectioneries, fruit juices, carbonated beverages, pharmaceuticals, personal care items, etc.
To get more information on this market Request Sample
The high prevalence of diabetes, obesity, and heart-related ailments due to sedentary consumer lifestyles is currently bolstering the demand for natural sweeteners in Europe. Moreover, the growing awareness towards the low glycemic index (GI) of natural sweeteners, particularly among the health-conscious consumers, is also driving the market growth in the region. The rising geriatric population in Europe has led to the changing consumer inclination towards healthier sugar substitutes, such as natural sweeteners. Furthermore, the growing concerns towards the negative health impact of synthetic food additives are also fueling the market for organic product variants. The increasing consumption of ready-to-eat and processed food items has also propelled the use of natural sweeteners as food preservatives, flavor enhancers, and sweetness modulators. Furthermore, the rising demand of natural sweeteners in the pharmaceutical sector in the region is also augmenting its demand. Furthermore, various regional beverage companies are introducing healthy sucrose alternatives in carbonated drinks for targeting the health-conscious consumers in Europe. Additionally, the rising influence of social media trends along with the growing number of celebrity endorsements promoting the health benefits of natural sweeteners is further propelling the market growth. Besides this, the market is also being driven by the increasing use of natural sweeteners such as stevia in personal care products for providing skin nourishment and preventing skin disorders, such as dermatitis and eczema.
.webp)
Key Market Segmentation:
IMARC Group provides an analysis of the key trends in each segment of the Europe natural sweetener market report, along with forecasts at the regional and country levels from 2026-2034. Our report has categorized the market based on product type, form, application and distribution channel.
Breakup by Product Type:
- Stevia
- Xylitol
- Sorbitol
- Mannitol
- Erythritol
- Others
Breakup by Form:
- Powder
- Liquid
Breakup by Application:
- Food & Beverages
- Baked Goods
- Confectionary Products
- Dairy Products
- Fruit Juices
- Carbonated Drinks
- Others
- Pharmaceuticals
- Personal Care
- Others
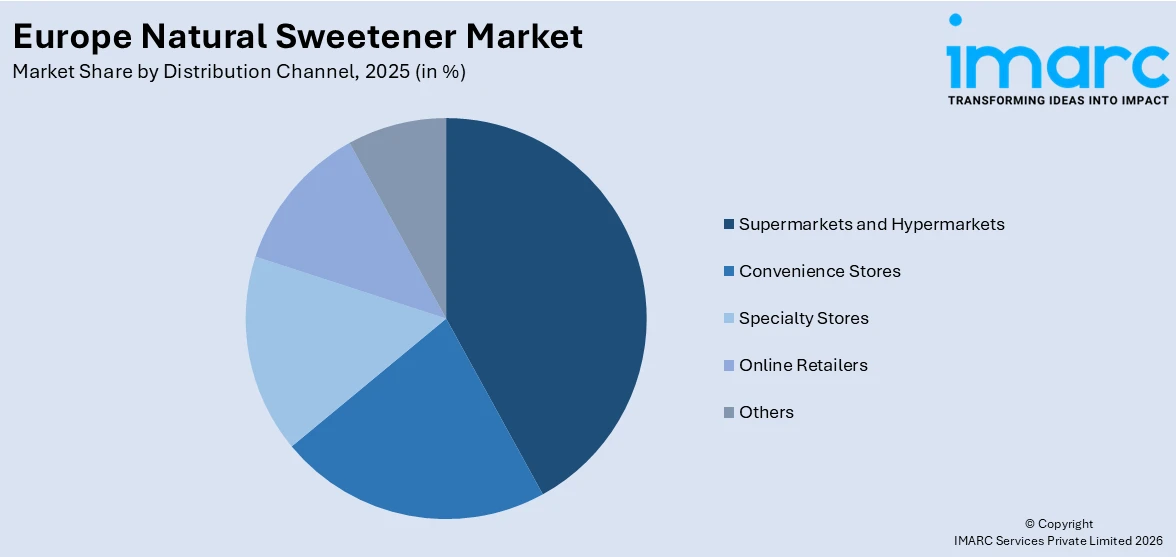
Breakup by Distribution Channel:
Access the comprehensive market breakdown Request Sample
- Supermarkets and Hypermarkets
- Convenience Stores
- Specialty Stores
- Online Retailers
- Others
Breakup by Country:
- Germany
- France
- United Kingdom
- Italy
- Spain
- Russia
- Others
Competitive Landscape:
The competitive landscape of the industry has also been examined with some of the key players being The Archer Daniels Midland Company, Associated British Foods PLC, Cargill Incorporated, Dupont De Nemours Inc., HYET Sweet B.V., Ingredion Incorporated, PureCircle, Roquette Freres, Symrise AG, Tate & Lyle PLC and Tereos Starch and Sweeteners.
Report Coverage:
| Report Features | Details |
|---|---|
| Base Year of the Analysis | 2025 |
| Historical Period | 2020-2025 |
| Forecast Period | 2026-2034 |
| Units | Billion USD |
| Segment Coverage | Product Type, Form, Application, Distribution Channel, Country |
| Countries Covered | Germany, France, United Kingdom, Italy, Spain, Russia, Others |
| Companies Covered | The Archer Daniels Midland Company, Associated British Foods PLC, Cargill Incorporated, Dupont De Nemours Inc., HYET Sweet B.V., Ingredion Incorporated, PureCircle, Roquette Freres, Symrise AG, Tate & Lyle PLC and Tereos Starch and Sweeteners |
| Customization Scope | 10% Free Customization |
| Post-Sale Analyst Support | 10-12 Weeks |
| Delivery Format | PDF and Excel through Email (We can also provide the editable version of the report in PPT/Word format on special request) |
Key Questions Answered in This Report:
- How has the Europe natural sweetener market performed so far and how will it perform in the coming years?
- What has been the impact of COVID-19 on the Europe natural sweetener market?
- What are the key regional markets?
- What is the breakup of the market based on the product type?
- What is the breakup of the market based on the form?
- What is the breakup of the market based on the application?
- What is the breakup of the market based on the distribution channel?
- What are the various stages in the value chain of the industry?
- What are the key driving factors and challenges in the industry?
- What is the structure of the Europe natural sweetener market and who are the key players?
- What is the degree of competition in the industry?
Need more help?
- Speak to our experienced analysts for insights on the current market scenarios.
- Include additional segments and countries to customize the report as per your requirement.
- Gain an unparalleled competitive advantage in your domain by understanding how to utilize the report and positively impacting your operations and revenue.
- For further assistance, please connect with our analysts.
 Request Customization
 Speak to an Analyst
 Request Brochure
 Inquire Before Buying
Benefits of Customization
- Personalize this research
- Triangulate with your data
- Get data as per your format and definition
- Gain a deeper dive into a specific application, geography, customer, or competitor
- Any level of personalization
Get in Touch With Us
UNITED STATES
Phone: +1-201-971-6302
INDIA
Phone: +91-120-433-0800
UNITED KINGDOM
Phone: +44-753-714-6104
Email: [email protected]
Client Testimonials


.webp)


